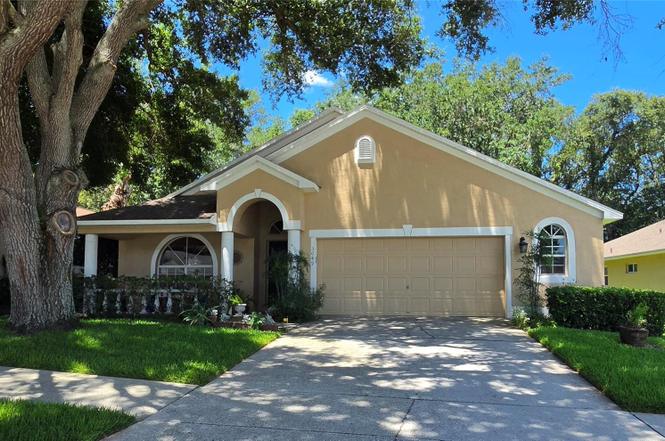
3049 Beaver Pond Trl · Valrico, FL
Flood risk 1/10 · Minimal
- FEMA flood zone
- X (unshaded)
- Chance of flooding over 30 yrs
- 0.0%
- Est. flood insurance / yr
- $507 – $1,088
Fire risk 3/10 · Minor
- Est. fire insurance / yr
- $947 – $1,759
Heat risk 10/10 · Severe
- Hot days now (above 109°F)
- 7 days/yr
- Hot days in 30 yrs
- 27 days/yr
Wind risk 9/10 · Severe
- Chance of severe wind over 30 yrs
- 99.0%
Air-quality risk 3/10 · Minor
- Unhealthy air days now
- 3 days/yr
- Unhealthy air days in 30 yrs
- 4 days/yr
Risk factors via First Street. Map © Google.
Why this score? — see what drove the D grade
The composite is a weighted blend of 9 inputs, each scored 0–100. Each bar is that input's sub-score; the figure is the points it added to the 100-point composite (weight × sub-score).
- Cash flow +13.0/30.0
- ARV discount +7.5/15.0
- Schools +4.2/10.0
- DSCR +3.9/10.0
- Rent growth +3.5/5.0
- Livability +3.5/5.0
- 1% rule +3.1/10.0
- Condition / age +2.5/5.0
- Appreciation +0.0/10.0
$385,000
🖨 Deal sheet (PDF) 📄 Offer letter ✓ Due diligence
Listing remarks
Welcome to the highly desirable Twin Lakes community! This well maintained 4 bedroom, 2 bathroom home offers a spacious and functional layout designed for comfortable family living. As you step through the front door, you're greeted by a bright and inviting living and dining area, perfect for gatherings. The kitchen features a convenient center island, providing additional counter space, along with a casual dining area. The split-bedroom floor plan allows privacy for the primary suite while providing flexibility for guest rooms, a home office or hobby space. The primary bedroom is filled with natural light and features an en-suite bathroom complete with a relaxing garden tub and seperate sh
Key facts
- 6,669 sq ft lot
- 2 garage spots
- Community pool
Property features AI
Finance
- Other: Association name listed; Unfurnished
- Financial info: Lease restrictions apply
- HOA & community: Has HOA (monthly approx. $99.67; quarterly association fee $299); HOA covers common area taxes and pool; Community amenities: pool, playground, park, tennis courts; Pets allowed (cats and dogs); Deed-restricted community; Senior community
Exterior
- Parking: Attached 2-car garage with garage door opener
- Utilities: Public water; Public sewer; Electricity connected; Cable connected; Water connected; Sewer connected
- Home design: Single-family residence; One story; Faces east; Homesteaded property
- Construction: Block and stucco construction; Shingle roof; Slab foundation; Built on lot of about 0.15 acre
- Exterior features: Front porch; Patio; Mature landscaping; Asphalt road access; Lot dimensions approximately 57 x 117
Interior
- Kitchen: Range; Microwave; Refrigerator; Dishwasher
- Bedrooms: 4 bedrooms
- Flooring: Carpet
- Bathrooms: 2 full bathrooms
- Heating & cooling: No heating system specified; Central air conditioning
- Interior features: Den/Library/Office; Florida room; Irrigation system; Electric water heater
- Laundry & utility: Washer; Dryer; Laundry in garage
Neighborhood map
What this means for you Summary
Snapshot
- This is a 4-bed/2.0-bath single-family listed at $385k.
Deal economics
- At list price, monthly cash flow is $-19 ($-233/yr) — negative.
- To cash-flow at today's rent, offer at most $382k (0.9% below list).
- To meet the 1% rule (rent ≥ 1% of price), the offer needs to be $313k (18.6% below list).
- Recommended offer: $313k (18.6% below list) — sets the bar for 1% rule.
Location & tenants
- Location reads 70/100 on livability (#442 in FL) — a middle-class / working-renter tenant base. Strengths: housing A+, crime A, employment A; Watch: amenities F, commute F, health & safety F.
- Hillsborough (suburban): math 47% / reading 50% proficiency, ranked #41 of 73 in FL (top 56%) — families likely to look elsewhere, expect single-tenant / working-renter base with shorter leases.
- Zoned schools: Lithia Springs Elementary School (math 74% / reading 78%, grade A, #198 of 2,144 statewide, top 10%, 620 students, 22% FRL); Randall Middle School (math 80% / reading 77%, grade A+, #25 of 571 statewide, top 4%, 1,409 students, 16% FRL); Bloomingdale High School (math 41% / reading 54%, grade D, #204 of 667 statewide, top 31%, 2,304 students, 45% FRL) — zoned schools average 28% FRL vs 52% district-wide (24 pts lower); this property's tenant base skews higher-income than the district average.
- Zoned-school proficiency averages 67% at this address vs 48% district-wide (+19 pts) — the actual schools serving this property are materially stronger than the Hillsborough average implies; a family-tenant draw the district grade alone would hide.
- Market conditions: Rents rising fast (+4.1%/yr); 210 active listings in the ZIP; 6 comparable units currently listed for rent nearby; rentals at typical pace (median 17d on market — plan ~3-4 weeks tenant-placement turnaround); high-income renter base; 9,053 units permitted in Hillsborough County in 2024 (4,555 in 5+ unit buildings).
- This rent runs 32% of the median local income ($116k/yr) — at the standard rent-burdened threshold; future hikes will face affordability resistance.
Forward outlook
- Local home prices are declining (-3.0%/yr); year-one equity from $3k of loan paydown is wiped out by about $12k of value loss. Plan a longer hold.
- Hillsborough County population projected at +37% by 2050 — long-run rental-demand tailwind backs the buy-and-hold thesis.
Negotiation context
- Only 9 days on market — expect competitive offers; lowballing is unlikely to land.
- Current owner paid $152k; list at $385k implies a 153% gain — meaningful room to come down on a strong offer.
Risks & watch-outs
- Climate carrying-cost: severe wind risk, 99% chance of damaging wind over 30y; extreme-heat days projected 7→27/yr by 2055 (HVAC capex compounding) — expect insurance premiums to compound above CPI over the hold.
Questions for the listing agent
- What do current leases actually rent for vs. the listed asking? Can we see a recent rent roll and the last 12 months of T-12 income?
- What does the HOA fee cover, when was the last increase, and are there any pending special assessments or reserve-fund shortfalls?
- Is there a deadline driving the sale (1031 exchange, divorce, estate, relocation)? That informs how much negotiation room exists.
- Schools are B-rated — typically a magnet for longer-tenancy family renters. What's the average tenant stay here, and is there a school-zone premium baked into asking?
- The area grade is low — what's the realistic commute time and amenity access for the typical tenant pool here? Any planned neighborhood developments (good or bad) we should know about?
- What's the average days-on-market for RENTAL listings here right now (not sales)? A rising rental-DOM trend means longer vacancies and softer asking-rent achievability than the comps imply.
- What's the recent tenant-quality profile in this submarket — average credit score on applications, eviction rate, late-payment / NSF rate, and stable-employment percentage? A property-management company in the area should have these aggregated.
- How much new for-sale + rental construction is in the pipeline within 1–3 miles? Heavy new supply typically softens prices + rents 12–24 months out; constrained supply supports both.
Investment metrics
- 1% rule
- 0.81% ✗
- Cap rate
- 6.23%
- Cash-on-cash
- -0.22%
- DSCR
- 0.99
- GRM
- 10.2
CMA / ARV
No comps found within radius.
Projected returns pro-forma
-3.0% appreciation · 4.06% rent growth · sell at horizon
- IRR
- -15.6%
- Equity multiple
- 0.44×
- Total profit
- $-60,300
- Equity at exit
- $57,405
- IRR
- -5.5%
- Equity multiple
- 0.63×
- Total profit
- $-40,167
- Equity at exit
- $33,288
Cash invested: $107,800 (down + closing). Projections, not guarantees.
Landlord ↔ Tenant lean methodology
- Overall (STATE)
- 87 Strongly Landlord-Friendly
- State Florida
- 87 Strongly Landlord-Friendly · R+3
- County
- — inherits STATE
- City
- — inherits STATE
ZIP-level market 33596
- Home prices YoY
- -17.8%
- Rents YoY
- 4.1%
- Active inventory
- 210
- Price-to-rent
- 10.2×
Monthly cashflow live
- Estimated rent
- $3,132 high interval (Pro) →
- Mortgage (P&I)
- −$2,019
- Tax from tax record
- −$215 /mo · $2,586/yr
- Insurance
- −$160
- HOA
- −$99
- Vacancy / Maint / Mgmt
- −$658
- Net cashflow
- $-19
Break-even live
Sensitivity live
| Price | -10% $199 | -5% $90 | +0% $-19 | +5% $-128 | +10% $-237 |
|---|---|---|---|---|---|
| Rent | -10% $-267 | -5% $-143 | +0% $-19 | +5% $104 | +10% $228 |
| Rate | -1.0pp $175 | -0.5pp $79 | base $-19 | +0.5pp $-119 | +1.0pp $-221 |
UW: 25.0% down · 7.5% · 30yr · 1.5% tax · 5.0% vac · 8.0% maint · 8.0% mgmt
Financing live
Cash to close
- Down payment
- $96,250
- Closing costs
- $11,550
- Reserves months
- —
- Total cash needed
- —
Loan-product check · same deal, 3 products live
Conventional
25% down · 7.5% · 30yr
- Down + closing
- —
- Monthly P&I
- —
- Monthly cashflow
- —
- DSCR
- —
- Eligible?
- —
Personal DTI + credit; lowest rate.
DSCR
20% down · 8.5% · 30yr
- Down + closing
- —
- Monthly P&I
- —
- Monthly cashflow
- —
- DSCR
- —
- Eligible?
- —
No personal income docs; deal must DSCR.
Hard money
10% down · 12.0% · 12mo
- Down + closing
- —
- Monthly P&I
- —
- Monthly cashflow
- —
- DSCR
- —
- Eligible?
- —
Short-term bridge; refi at stabilization.
Rent comps 6 comps
| Address | Beds | Baths | Sqft | Rent | $/sqft | DOM | Units | Dist |
|---|---|---|---|---|---|---|---|---|
| 5656 Rockfield Loop Valrico, FL | 3.0 | 2.0 | 1805 | $3,000 | $1.66 | 26d | 1 | 0.78mi |
| 4318 Brooke Dr Valrico, FL | 3.0 | 2.0 | 1852 | $2,486 | $1.34 | 26d | 1 | 1.25mi |
| 4351 Brandon Ridge Dr Valrico, FL | 4.0 | 3.0 | 2448 | $2,615 | $1.07 | 0d | 1 | 1.29mi |
| 5121 Fairway One Dr Valrico, FL | 3.0 | 2.5 | 2241 | $3,500 | $1.56 | 16d | 1 | 1.31mi |
| 4434 Brandon Ridge Dr Valrico, FL | 4.0 | 2.0 | 2005 | $2,581 | $1.29 | 6d | 1 | 1.35mi |
| 1707 Tallowtree Cir Valrico, FL | 3.0 | 2.0 | 1615 | $2,220 | $1.37 | 1d | 1 | 1.49mi |
HOA detail
- Monthly dues
- $99 · $1,188/yr
Listing history 7 events
-
2026-06-21days on market $385,000 Active 9 DOM
-
2026-06-18days on market $385,000 Active 6 DOM
-
2026-06-17days on market $385,000 Active 5 DOM
-
2026-06-16days on market $385,000 Active 4 DOM
-
2026-06-15days on market $385,000 Active 3 DOM
-
2026-06-13remarks 699-char remark
-
2026-06-13$385,000 Active 1 DOM
ⓘ Source: listings_history table (triggers on properties + properties_extension) + one-shot
backfill from property_details.listing_events for pre-trigger history.
Tax reassessment forecast FL · Resets to sale price
- Current annual tax
- $2,586 · $215/mo
- Projected year-2 tax
- $3,196 · $266/mo
- Expected delta
- +$610/yr (+$51/mo · 23.6%)
ⓘ Screening estimate from a state-policy table — verify with the county assessor before closing.
Climate risk First Street
- Flood 1/10 Low FEMA zone X (unshaded) · 0% chance over 30 yrs
- Wildfire 3/10 Moderate
- Heat 10/10 Extreme 7 d/yr ≥109°F today · 27 d/yr by 30 yrs out
- Wind 9/10 Extreme 99% chance of damaging wind over 30 yrs
- Air quality 3/10 Moderate 3 unhealthy d/yr today · 4 by 30 yrs out
Nearby sold comps map
Loading sold comps map…
Walkable amenities ~0.75 mi
Loading nearby amenities…
Taxation est. · year 1
- Rental income
- $37,587
- − Mortgage interest
- −$21,566
- − Property taxes
- −$2,586
- − Insurance
- −$1,925
- − Repairs & maintenance
- −$3,007
- − Management
- −$3,007
- − HOA
- −$1,188
- − Depreciation
- −$11,200
- Taxable loss
- −$6,891
- Est. tax savings @ 24.0%
- +$1,654
- After-tax cash flow
- $1,421/yr
For passive investors: Depreciation is non-cash, so a rental often shows a tax loss while cash-flowing — sheltering income. Rental losses are passive: they offset passive income freely, and up to $25,000/yr can offset ordinary (W-2) income if you actively participate and your MAGI is under $100k (phasing out to $0 by $150k); unused losses carry forward. On sale, claimed depreciation is recaptured at up to 25%, and gains may owe capital-gains tax (a 1031 exchange can defer both). Figures are a year-1 estimate at your 24.0% rate — not tax advice; consult a CPA.
Schools (NCES district)
- District
- Hillsborough
- NCES district ID
- 1200870
- Math proficiency
- 47% ▼ -8.00%
- Reading proficiency
- 50% ▼ -4.00%
- Median HH income
- $50,622
- Composite
- 41.6/100
- National rank
- #3435
- State rank
- #41 of 73 in FL
Livability — Valrico
- Score
- 70/100
- State rank
- #442
- US rank
- #7901
Category grades
Schools grade is shown separately in the Schools card above.
Census & demographics
- Census place
- Valrico, FL
- County
- Hillsborough County · 1,540,968 people
- City population
- 65,118
- Metro
- Tampa-St. Petersburg-Clearwater, FL
- Population (ZIP)
- 27,757
- Household income
- $116,465
- Rent vs Own
- Severe rent burden
- 437.0
Population outlook (Hillsborough County) Hauer SSP2
- Today (2025)
- 1,607,022 people
- By 2030
- 1,733,968 · +7.9%
- By 2040
- 1,979,565 · +23.2%
- By 2050
- 2,203,427 · +37.1%
- By 2075
- 2,667,893 · +66.0%
- By 2100
- 2,891,558 · +79.9%
Race, ethnicity, and origin ACS 2023
- Neighborhood character
- Predominantly White (67%)
- Race & ethnicity
- White 67% Hispanic / Latino 18% Two or more races 13% Black 8% Asian 2%
- Hispanic origin (detail)
- Mexican 1% Puerto Rican 11% Cuban 3%
- Common ancestry
- Romanian 3% Lithuanian 2% Italian 2%
- Foreign-born
- 9% · Canada, Jamaica
- Languages at home
- 86% English-only · Spanish 9% Other Indo-European 2% French/Haitian/Cajun 2%
Political lean MEDSL · Hillsborough
- 2024 margin
- Toss-up / Even · D 47.8% · R 50.9% · Other 1.3%
- 2008→2024 swing
- -10.2pp toward R · 2008: 7.1pp · 2024: -3.1pp
- All cycles
- 2024: R+3.1 2020: D+6.9 2016: D+6.8 2012: D+6.7 2008: D+7.1
Not yet ingested
- Civics
- —
Market trends
- HPI YoY
- ▼ -65.33%
- Current HPI
- 301.312
- Rent YoY
- ▲ 4.06%
- Metro
- Tampa-St. Petersburg-Clearwater, FL
- State GDP YoY
- ▲ 3.28%
- F500 in state
- 36
Industry mix (Fortune 500 HQ in FL)
| Industry | F500 HQs | Revenue |
|---|---|---|
| Industrial Technology | 2 | $29B |
|
||
| Insurance | 2 | $17B |
|
||
| Retail | 1 | $60B |
|
||
| Technology Distribution | 1 | $58B |
|
||
| Homebuilding | 1 | $35B |
|
||
| Technology Manufacturing | 1 | $35B |
|
||
Price history
+178.0% since first listed3 events — show timeline
- 2026-06-12 Listed $385,000 Stellar MLS as Distributed by MLS Grid
- 2003-08-20 Sold (Public Records) $152,000 Public Records
- 2001-04-17 Sold (Public Records) $138,500 Public Records
Property tax history
+1.6%/yrLatest (2025): $2,586 · +7.9% YoY. Source: county tax records.
Cash-flow waterfall
monthlySold comps — $/sqft
last 12 mo · ≤1 miLoading sold comps…