 🏗️ New Construction
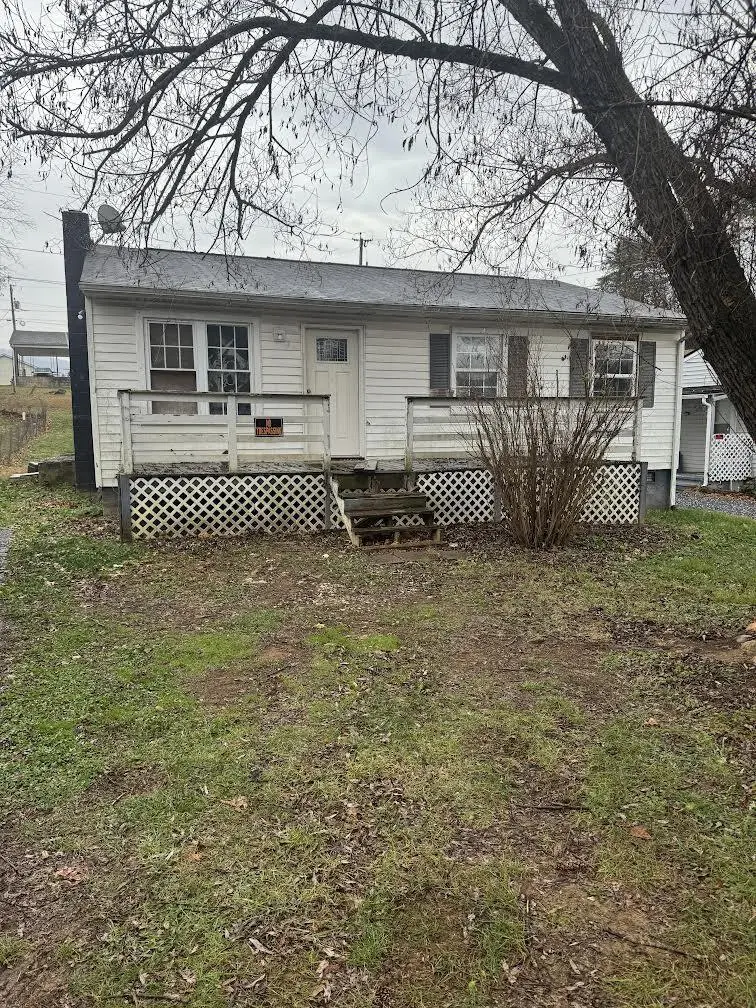
222 E 38th St · Buena Vista, VA
Flood risk 7/10 · Major
- FEMA flood zone
- X (unshaded)
- Chance of flooding over 30 yrs
- 0.77%
- Est. flood insurance / yr
- $507 – $1,088
Fire risk 3/10 · Minor
- Est. fire insurance / yr
- $666 – $1,236
Heat risk 6/10 · Moderate
- Hot days now (above 97°F)
- 7 days/yr
- Hot days in 30 yrs
- 18 days/yr
Wind risk 2/10 · Minimal
- Chance of severe wind over 30 yrs
- 1.0%
Air-quality risk 1/10 · Minimal
- Unhealthy air days now
- 0 days/yr
- Unhealthy air days in 30 yrs
- 0 days/yr
Risk factors via First Street. Map © Google.
Why this score? — see what drove the F grade
The composite is a weighted blend of 9 inputs, each scored 0–100. Each bar is that input's sub-score; the figure is the points it added to the 100-point composite (weight × sub-score).
- Cash flow +7.8/30.0
- ARV discount +7.5/15.0
- Schools +5.0/10.0
- Livability +3.6/5.0
- Rent growth +2.5/5.0
- Condition / age +2.5/5.0
- DSCR +1.9/10.0
- 1% rule +1.3/10.0
- Appreciation +0.0/10.0
$85,000
🖨 Deal sheet (PDF) 📄 Offer letter ✓ Due diligence
Listing remarks
Opportunity awaits in Buena Vista Virginia. This property is being sold as-is and ready for your vision. Whether you're an investor, flipper, or buyer looking to build equity, this fixer-upper offers solid potential in a convenient location. Bring your tools and imagination-this could be your next great project!
Key facts
- 6,098 sq ft lot
- Built 1979
- Listed 27 days
Property features AI
Exterior
- Utilities: Public water; Public sewer
- Home design: Single-family residence; Residential property; New construction
- Construction: Vinyl siding; Shingle roof
- Exterior features: Porch; 50ft x 100ft lot
Interior
- Flooring: Laminate; Tile; Vinyl
- Bathrooms: 1 full bathroom
- Heating & cooling: Baseboard heating; Electric heating; Ceiling fan(s); Central cooling not present
- Interior features: Electric water heater; Crawl space basement
Neighborhood map
What this means for you Summary
Snapshot
- This is a 3-bed/1.0-bath single-family listed at $85k.
Deal economics
- At list price, monthly cash flow is $-264 ($-3k/yr) — negative.
- The deal already cash-flows at list — no discount required.
- Meets the 1% rule at list price ($1k rent vs $85k).
- Recommended offer: $84k (1.5% below list) — sets the bar for market timing.
- Cap rate 5.0% vs local median 3.4% in Buena Vista — top-decile yield for the area; either an underpriced asset or a hidden risk that comps aren't pricing in. Stress-test before assuming the spread holds.
Location & tenants
- Location reads 71/100 on livability (#217 in VA) — a middle-class / working-renter tenant base. Strengths: crime A+, cost of living A+, housing A; Watch: health & safety C-, amenities F, commute F.
- Buena Vista City Public School District (rural): math 54% / reading 68% proficiency, ranked #61 of 131 in VA (top 47%) — acceptable for families but not a draw, mixed tenant base, ~2y average lease.
- Zoned schools: F.W. Kling Jr. Elementary (249 students, 86% FRL); Parry Mccluer Middle (math 72% / reading 77%, grade A, #50 of 342 statewide, top 16%, 119 students, 87% FRL); Parry Mccluer High (math 37% / reading 67%, grade D+, #295 of 319 statewide, top 93%, 330 students, 86% FRL) — zoned schools average 86% FRL vs 44% district-wide (42 pts higher); higher-poverty schools than district average — tighter screening recommended.
- Market conditions: 56 active listings in the ZIP; 2 comparable units currently listed for rent nearby; 18 units permitted in Buena Vista city in 2024 (0 in 5+ unit buildings).
Forward outlook
- Local home prices are declining (-3.0%/yr); year-one equity from $1k of loan paydown is wiped out by about $5k of value loss. Plan a longer hold.
- Buena Vista County population projected to shrink 4% by 2050 — rents likely to lag national; underwrite the cash flow, not the appreciation.
Negotiation context
- It's been on market 27 days — a 2% lower offer ($84k) is reasonable based on typical stale-listing flexibility.
- Current owner paid $65k; 31% above their basis — modest negotiation headroom, anchor on the comps not their cost.
Risks & watch-outs
- Watch-outs: flood insurance adds $66/mo.
- Climate carrying-cost: major flood risk; extreme-heat days projected 7→18/yr by 2055 (HVAC capex compounding) — expect insurance premiums to compound above CPI over the hold.
Questions for the listing agent
- What do current leases actually rent for vs. the listed asking? Can we see a recent rent roll and the last 12 months of T-12 income?
- Built in 1979 — when were the roof, HVAC, electrical panel, plumbing, and water heater last replaced?
- What's the actual annual flood-insurance premium (NFIP or private), and is the property in a SFHA with mandatory coverage?
- Is there a deadline driving the sale (1031 exchange, divorce, estate, relocation)? That informs how much negotiation room exists.
- Schools are B-rated — typically a magnet for longer-tenancy family renters. What's the average tenant stay here, and is there a school-zone premium baked into asking?
- The area grade is low — what's the realistic commute time and amenity access for the typical tenant pool here? Any planned neighborhood developments (good or bad) we should know about?
- What's the average days-on-market for RENTAL listings here right now (not sales)? A rising rental-DOM trend means longer vacancies and softer asking-rent achievability than the comps imply.
- What's the recent tenant-quality profile in this submarket — average credit score on applications, eviction rate, late-payment / NSF rate, and stable-employment percentage? A property-management company in the area should have these aggregated.
- How much new for-sale + rental construction is in the pipeline within 1–3 miles? Heavy new supply typically softens prices + rents 12–24 months out; constrained supply supports both.
Investment metrics
- 1% rule
- 0.63% ✗
- Cap rate
- 4.96%
- Cash-on-cash
- -4.77%
- DSCR
- 0.79
- GRM
- 13.1
CMA / ARV
- ARV (median comp)
- $177,966
- List price
- $85,000
- Delta
- -52.24%
- Verdict
- UNDERPRICED
- Comps
- 20 within 1.0 mi
Show comp detail 10 sales within ~0.75 mi
| Address | Dist | Beds/Ba | Sqft | Sold | Price | $/sf | Match |
|---|---|---|---|---|---|---|---|
| 262 E 35th St | 0.19mi | 3/1.0 | 960 (+1%) | 11mo | $75,000 | $78 | 80 |
| 132 W 37th St | 0.20mi | 3/1.0 | 1,008 (+6%) | 6mo | $169,000 | $168 | 76 |
| 230 E 39th St | 0.07mi | 2/1.0 (-1) | 910 (-4%) | 20mo | $158,000 | $174 | 68 |
| 550 Reids Hill Rd | 0.27mi | 2/2.0 (-1) | 960 (+1%) | 11mo | $120,000 | $125 | 68 |
| 255 Longhollow Rd | 0.60mi | 3/1.0 | 960 (+1%) | 15mo | $180,000 | $188 | 58 |
| 183 E 38th St | 0.06mi | 3/1.0 | 1,083 (+14%) | 20mo | $145,000 | $134 | 58 |
| 247 E 33rd St | 0.28mi | 3/1.0 | 1,056 (+11%) | 21mo | $174,000 | $165 | 51 |
| 145 Long Hollow Road Rd | 0.71mi | 3/1.0 | 960 (+1%) | 21mo | $175,000 | $182 | 48 |
| 216 E 30th St | 0.49mi | 2/1.0 (-1) | 904 (-5%) | 20mo | $95,000 | $105 | 47 |
| 154 W 31st St | 0.49mi | 4/1.0 (+1) | 1,080 (+13%) | 15mo | $159,000 | $147 | 37 |
Match score weights: distance 35% · size 25% · config 20% · recency 20%. Top-matched comps best support the ARV.
Projected returns pro-forma
-3.0% appreciation · 3.0% rent growth · sell at horizon
- IRR
- -27.3%
- Equity multiple
- 0.08×
- Total profit
- $-45,710
- Equity at exit
- $26,535
- IRR
- -25.4%
- Equity multiple
- -0.24×
- Total profit
- $-61,607
- Equity at exit
- $15,387
Cash invested: $49,831 (down + closing). Projections, not guarantees.
Landlord ↔ Tenant lean methodology
- Overall (STATE)
- 55 Moderately Landlord-Leaning
- State Virginia
- 55 Moderately Landlord-Leaning · D+2
- County
- — inherits STATE
- City
- — inherits STATE
ZIP-level market 24416
- Home prices YoY
- -33.8%
- Active inventory
- 56
- Price-to-rent
- 6.3×
Monthly cashflow live
- Estimated rent
- $1,129 medium interval (Pro) →
- Mortgage (P&I)
- −$933
- Tax from tax record
- −$82 /mo · $986/yr
- Insurance
- −$74
- Flood insurance flood zone
- −$66 /mo · $798/yr
- HOA
- −$0
- Vacancy / Maint / Mgmt
- −$237
- Net cashflow
- $-264
Break-even live
Sensitivity live
| Price | -10% $-164 | -5% $-214 | +0% $-264 | +5% $-315 | +10% $-365 |
|---|---|---|---|---|---|
| Rent | -10% $-354 | -5% $-309 | +0% $-264 | +5% $-220 | +10% $-175 |
| Rate | -1.0pp $-175 | -0.5pp $-219 | base $-264 | +0.5pp $-311 | +1.0pp $-357 |
UW: 25.0% down · 7.5% · 30yr · 1.5% tax · 5.0% vac · 8.0% maint · 8.0% mgmt
Financing live
Cash to close
- Down payment
- $44,492
- Closing costs
- $5,339
- Reserves months
- —
- Total cash needed
- —
Loan-product check · same deal, 3 products live
Conventional
25% down · 7.5% · 30yr
- Down + closing
- —
- Monthly P&I
- —
- Monthly cashflow
- —
- DSCR
- —
- Eligible?
- —
Personal DTI + credit; lowest rate.
DSCR
20% down · 8.5% · 30yr
- Down + closing
- —
- Monthly P&I
- —
- Monthly cashflow
- —
- DSCR
- —
- Eligible?
- —
No personal income docs; deal must DSCR.
Hard money
10% down · 12.0% · 12mo
- Down + closing
- —
- Monthly P&I
- —
- Monthly cashflow
- —
- DSCR
- —
- Eligible?
- —
Short-term bridge; refi at stabilization.
Rent comps 2 comps
| Address | Beds | Baths | Sqft | Rent | $/sqft | DOM | Units | Dist |
|---|---|---|---|---|---|---|---|---|
| E 40th St Buena Vista, VA | 2.0 | 2.0 | 784 | $1,115 | $1.42 | 15d | 3 | 0.12mi |
| 2222 Cedar Ave Buena Vista, VA | 2.0 | 1.0 | 900 | $850 | $0.94 | 45d | 1 | 1.27mi |
Listing history 2 events
-
2026-04-23$85,000 Active 313-char remark
-
2000-05-31soldstatus $64,900
ⓘ Source: listings_history table (triggers on properties + properties_extension) + one-shot
backfill from property_details.listing_events for pre-trigger history.
Tax reassessment forecast VA · Resets to sale price
- Current annual tax
- $986 · $82/mo
- Projected year-2 tax
- $986 · $82/mo
- Expected delta
- $0/yr ($0/mo · 0.0%)
ⓘ Screening estimate from a state-policy table — verify with the county assessor before closing.
Climate risk First Street
- Flood 7/10 Severe FEMA zone X (unshaded) · 77% chance over 30 yrs
- Wildfire 3/10 Moderate
- Heat 6/10 Major 7 d/yr ≥97°F today · 18 d/yr by 30 yrs out
- Wind 2/10 Low 100% chance of damaging wind over 30 yrs
- Air quality 1/10 Low 0 unhealthy d/yr today · 0 by 30 yrs out
Nearby sold comps map
Loading sold comps map…
Walkable amenities ~0.75 mi
Loading nearby amenities…
Taxation est. · year 1
- Rental income
- $13,543
- − Mortgage interest
- −$9,969
- − Property taxes
- −$986
- − Insurance
- −$1,687
- − Repairs & maintenance
- −$1,083
- − Management
- −$1,083
- − Depreciation
- −$5,177
- Taxable loss
- −$6,443
- Est. tax savings @ 24.0%
- +$1,546
- After-tax cash flow
- $-1,627/yr
For passive investors: Depreciation is non-cash, so a rental often shows a tax loss while cash-flowing — sheltering income. Rental losses are passive: they offset passive income freely, and up to $25,000/yr can offset ordinary (W-2) income if you actively participate and your MAGI is under $100k (phasing out to $0 by $150k); unused losses carry forward. On sale, claimed depreciation is recaptured at up to 25%, and gains may owe capital-gains tax (a 1031 exchange can defer both). Figures are a year-1 estimate at your 24.0% rate — not tax advice; consult a CPA.
Schools (NCES district)
- District
- Buena Vista City Public School District
- NCES district ID
- 5100560
- Math proficiency
- 54% ▼ -29.00%
- Reading proficiency
- 68% ▼ -5.00%
- Median HH income
- $35,243
- Composite
- 50.44/100
- National rank
- #1866
- State rank
- #61 of 131 in VA
Livability — Buena Vista
- Score
- 71/100
- State rank
- #217
- US rank
- #7146
Category grades
Schools grade is shown separately in the Schools card above.
Census & demographics
- Census place
- Buena Vista, VA
- County
- Buena Vista City · 9,082 people
- City population
- 9,082
- Metro
- nan
- Population (ZIP)
- 9,082
- Household income
- $54,882
- Rent vs Own
- Severe rent burden
- 239.0
Population outlook (Buena Vista County) Hauer SSP2
- Today (2025)
- 6,454 people
- By 2030
- 6,395 · -0.9%
- By 2040
- 6,271 · -2.8%
- By 2050
- 6,166 · -4.5%
- By 2075
- 6,287 · -2.6%
- By 2100
- 6,282 · -2.7%
Race, ethnicity, and origin ACS 2023
- Neighborhood character
- Predominantly White (85%)
- Race & ethnicity
- White 85% Two or more races 9% Hispanic / Latino 4% Black 2%
- Common ancestry
- Serbian 3% Slovak 3% Lithuanian 2%
- Foreign-born
- 1% · Canada
Political lean MEDSL · Buena Vista
- 2024 margin
- Solid R (+44.5) · D 26.9% · R 71.3% · Other 1.8%
- 2008→2024 swing
- -37.3pp toward R · 2008: -7.2pp · 2024: -44.5pp
- All cycles
- 2024: R+44.5 2020: R+37.4 2016: R+30.9 2012: R+25.5 2008: R+7.2
Not yet ingested
- Civics
- —
Market trends
- HPI YoY
- ▼ -73.06%
- Current HPI
- 143.115
- Rent YoY
- —
- Metro
- nan
- State GDP YoY
- ▲ 2.40%
- F500 in state
- 50
Industry mix (Fortune 500 HQ in VA)
| Industry | F500 HQs | Revenue |
|---|---|---|
| Aerospace / Defense | 4 | $236B |
|
||
| Technology / Defense | 3 | $32B |
|
||
| Financial Services | 2 | $176B |
|
||
| Utilities | 2 | $27B |
|
||
| Insurance | 2 | $25B |
|
||
| Technology | 2 | $15B |
|
||
Price history
+31.0% since first listed3 events — show timeline
- 2026-05-20 Pending — RHR
- 2026-04-23 Listed $85,000 RHR
- 2000-05-31 Sold (Public Records) $64,900 Public Records
Property tax history
+1.4%/yrLatest (2025): $986 · +65.2% YoY. Source: county tax records.
Cash-flow waterfall
monthlySold comps — $/sqft
last 12 mo · ≤1 miLoading sold comps…