104 North St · Indianola, IL
Flood risk 1/10 · Minimal
- FEMA flood zone
- X (unshaded)
- Chance of flooding over 30 yrs
- 0.0%
- Est. flood insurance / yr
- $507 – $1,088
Fire risk 1/10 · Minimal
- Est. fire insurance / yr
- $804 – $1,492
Heat risk 3/10 · Minor
- Hot days now (above 104°F)
- 7 days/yr
- Hot days in 30 yrs
- 18 days/yr
Wind risk 2/10 · Minimal
- Chance of severe wind over 30 yrs
- 1.0%
Air-quality risk 2/10 · Minimal
- Unhealthy air days now
- 1 days/yr
- Unhealthy air days in 30 yrs
- 2 days/yr
Risk factors via First Street. Map © Google.
Why this score? — see what drove the B+ grade
The composite is a weighted blend of 9 inputs, each scored 0–100. Each bar is that input's sub-score; the figure is the points it added to the 100-point composite (weight × sub-score).
- Cash flow +30.0/30.0
- 1% rule +10.0/10.0
- DSCR +10.0/10.0
- ARV discount +7.5/15.0
- Schools +5.0/10.0
- Appreciation +4.6/10.0
- Condition / age +3.8/5.0
- Livability +3.2/5.0
- Rent growth +2.5/5.0
$81,000
🖨 Deal sheet (PDF) 📄 Offer letter ✓ Due diligence
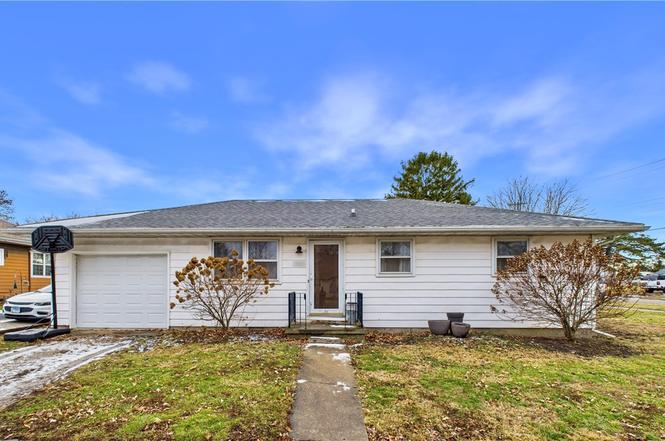
Listing remarks
Affordable small-town living starts here! This cozy home at 104 W North St in Ridgefarm, IL offers a great opportunity for first-time buyers, downsizers, or investors. The home features a functional layout with comfortable living space and plenty of natural light throughout. Situated on a manageable corner lot in a quiet neighborhood, this property offers easy maintenance and room to make it your own. Whether you're looking for a budget-friendly primary residence or a solid rental option, this home delivers value at an affordable price point. Don't miss your chance to own for less than rent-schedule your showing today!
Key facts
- Easy maintenance
- Natural light
- Functional layout
Tags
Neighborhood map
What this means for you Summary
Snapshot
- This is a 3-bed/1.0-bath single-family listed at $81k. Condition is rated good.
Deal economics
- At list price, monthly cash flow is $426 ($5k/yr) — positive.
- The deal already cash-flows at list — no discount required.
- Meets the 1% rule at list price ($1k rent vs $81k).
- Recommended offer: $79k (3.0% below list) — sets the bar for market timing.
Location & tenants
- Location reads 63/100 on livability (#769 in IL) — a middle-class / working-renter tenant base. Strengths: crime A+, cost of living A+, housing B+; Watch: amenities F, commute F, health & safety F.
- Zoned schools: Salt Fork Junior High School (math 17% / reading 42%, grade F, #256 of 665 statewide, top 41%, 186 students, 0% FRL); Salt Fork High School (math 5% / reading 15%, grade F, #528 of 693 statewide, top 82%, 247 students, 0% FRL).
- Market conditions: 2 active listings in the ZIP; 8 units permitted in Vermilion County in 2024 (0 in 5+ unit buildings).
Forward outlook
- Local home prices are declining (-0.8%/yr); year-one equity from $560 of loan paydown is wiped out by about $685 of value loss. Plan a longer hold.
- Vermilion County population projected at -24% by 2050 — secular population decline; favor cash flow + early exit over multi-decade hold.
- At projected returns (-0.8% appreciation + 3.0% rent growth), your $23k cash investment doubles in ~5 years — after that, you're playing with house money.
Negotiation context
- It's been on market 39 days — a 3% lower offer ($79k) is reasonable based on typical stale-listing flexibility.
Risks & watch-outs
- Watch-outs: built in 1956 — expect roof / HVAC / electrical / plumbing capex.
Questions for the listing agent
- It's been on market 39 days. Have you received any prior offers? Is the seller open to a 3% concession, seller financing, or rate buy-down credit?
- Built in 1956 — when were the roof, HVAC, electrical panel, plumbing, and water heater last replaced?
- Is there a deadline driving the sale (1031 exchange, divorce, estate, relocation)? That informs how much negotiation room exists.
- Schools are F-rated, which usually means shorter tenancies and higher turnover. Who's the typical renter profile here, and what's been the actual vacancy rate?
- What's the average days-on-market for RENTAL listings here right now (not sales)? A rising rental-DOM trend means longer vacancies and softer asking-rent achievability than the comps imply.
- What's the recent tenant-quality profile in this submarket — average credit score on applications, eviction rate, late-payment / NSF rate, and stable-employment percentage? A property-management company in the area should have these aggregated.
- How much new for-sale + rental construction is in the pipeline within 1–3 miles? Heavy new supply typically softens prices + rents 12–24 months out; constrained supply supports both.
Investment metrics
- 1% rule
- 1.54% ✓
- Cap rate
- 12.60%
- Cash-on-cash
- 22.54%
- DSCR
- 2.00
- GRM
- 5.4
CMA / ARV
No comps found within radius.
Projected returns pro-forma
-0.85% appreciation · 3.0% rent growth · sell at horizon
- IRR
- 20.7%
- Equity multiple
- 1.95×
- Total profit
- $21,618
- Equity at exit
- $20,152
- IRR
- 25.9%
- Equity multiple
- 3.69×
- Total profit
- $61,024
- Equity at exit
- $21,676
Cash invested: $22,680 (down + closing). Projections, not guarantees.
Landlord ↔ Tenant lean methodology
- Overall (STATE)
- 43 Moderately Tenant-Leaning
- State Illinois
- 43 Moderately Tenant-Leaning · D+7
- County
- — inherits STATE
- City
- — inherits STATE
ZIP-level market 61870
- Home prices YoY
- -0.4%
- Active inventory
- 2
- Price-to-rent
- 5.4×
Monthly cashflow live
- Estimated rent
- $1,248 medium interval (Pro) →
- Mortgage (P&I)
- −$425
- Tax est. 1.5%
- −$101 /mo · $1,215/yr
- Insurance
- −$34
- HOA
- −$0
- Vacancy / Maint / Mgmt
- −$262
- Net cashflow
- $426
Break-even live
Sensitivity live
| Price | -10% $482 | -5% $454 | +0% $426 | +5% $398 | +10% $370 |
|---|---|---|---|---|---|
| Rent | -10% $327 | -5% $377 | +0% $426 | +5% $475 | +10% $525 |
| Rate | -1.0pp $467 | -0.5pp $447 | base $426 | +0.5pp $405 | +1.0pp $384 |
UW: 25.0% down · 7.5% · 30yr · 1.5% tax · 5.0% vac · 8.0% maint · 8.0% mgmt
Financing live
Cash to close
- Down payment
- $20,250
- Closing costs
- $2,430
- Reserves months
- —
- Total cash needed
- —
Loan-product check · same deal, 3 products live
Conventional
25% down · 7.5% · 30yr
- Down + closing
- —
- Monthly P&I
- —
- Monthly cashflow
- —
- DSCR
- —
- Eligible?
- —
Personal DTI + credit; lowest rate.
DSCR
20% down · 8.5% · 30yr
- Down + closing
- —
- Monthly P&I
- —
- Monthly cashflow
- —
- DSCR
- —
- Eligible?
- —
No personal income docs; deal must DSCR.
Hard money
10% down · 12.0% · 12mo
- Down + closing
- —
- Monthly P&I
- —
- Monthly cashflow
- —
- DSCR
- —
- Eligible?
- —
Short-term bridge; refi at stabilization.
Listing history 3 events
-
2026-03-12status Pending
-
2026-02-20historical Active Under Contract
-
2026-01-30$81,000 Active
ⓘ Source: listings_history table (triggers on properties + properties_extension) + one-shot
backfill from property_details.listing_events for pre-trigger history.
Climate risk First Street
- Flood 1/10 Low FEMA zone X (unshaded) · 0% chance over 30 yrs
- Wildfire 1/10 Low
- Heat 3/10 Moderate 7 d/yr ≥104°F today · 18 d/yr by 30 yrs out
- Wind 2/10 Low 100% chance of damaging wind over 30 yrs
- Air quality 2/10 Low 1 unhealthy d/yr today · 2 by 30 yrs out
Nearby sold comps map
Loading sold comps map…
Walkable amenities ~0.75 mi
Loading nearby amenities…
Taxation est. · year 1
- Rental income
- $14,974
- − Mortgage interest
- −$4,537
- − Property taxes
- −$1,215
- − Insurance
- −$405
- − Repairs & maintenance
- −$1,198
- − Management
- −$1,198
- − Depreciation
- −$2,356
- Taxable income
- $4,065
- Est. tax owed @ 24.0%
- −$976
- After-tax cash flow
- $4,137/yr
For passive investors: Depreciation is non-cash, so a rental often shows a tax loss while cash-flowing — sheltering income. Rental losses are passive: they offset passive income freely, and up to $25,000/yr can offset ordinary (W-2) income if you actively participate and your MAGI is under $100k (phasing out to $0 by $150k); unused losses carry forward. On sale, claimed depreciation is recaptured at up to 25%, and gains may owe capital-gains tax (a 1031 exchange can defer both). Figures are a year-1 estimate at your 24.0% rate — not tax advice; consult a CPA.
Condition & rehab AI · 13 photos
This single-family home in Indianola, IL is in good condition with a good layout and ample natural light. It offers a great opportunity for first-time buyers, downsizers, or investors looking for an affordable primary residence or rental option.
Value-add opportunities
- Both paint exterior — enhances curb appeal and resale value
- Both landscape front yard — improves curb appeal and rental value
- Both install new window treatments — enhances curb appeal and rental value
Renovation cost estimate screening
Value-add ROI direction
- Both paint exterior — enhances curb appeal and resale value ↑
- Both landscape front yard — improves curb appeal and rental value ↑
- Both install new window treatments — enhances curb appeal and rental value ↑
ⓘ Cost ranges are severity-bucket heuristics (US national rule-of-thumb). Get contractor quotes + a written scope before underwriting a rehab budget.
Schools (NCES district)
No district data.
Livability — Indianola
- Score
- 63/100
- State rank
- #769
- US rank
- #15432
Category grades
Schools grade is shown separately in the Schools card above.
Census & demographics
- Census place
- Indianola, IL
- City population
- 475
- Population (ZIP)
- 1,153
Population outlook (Vermilion County) Hauer SSP2
- Today (2025)
- 72,775 people
- By 2030
- 69,235 · -4.9%
- By 2040
- 62,360 · -14.3%
- By 2050
- 55,539 · -23.7%
- By 2075
- 40,606 · -44.2%
- By 2100
- 26,985 · -62.9%
Race, ethnicity, and origin ACS 2023
- Neighborhood character
- Predominantly White (95%)
- Race & ethnicity
- White 95% Two or more races 3% Hispanic / Latino 2% Black 1%
- Common ancestry
- Serbian 3% Romanian 1% Iranian 1%
- Foreign-born
- 1%
- Languages at home
- 99% English-only · French/Haitian/Cajun 1%
Political lean MEDSL · Vermilion
- 2024 margin
- Solid R (+35.7) · D 31.4% · R 67.0% · Other 1.6%
- 2008→2024 swing
- -36.2pp toward R · 2008: 0.6pp · 2024: -35.7pp
- All cycles
- 2024: R+35.7 2020: R+32.9 2016: R+29.2 2012: R+15.7 2008: D+0.6
Not yet ingested
- Civics
- —
Market trends
- HPI YoY
- ▼ -0.85%
- Current HPI
- 219.5996
- Rent YoY
- —
- Metro
- —
- State GDP YoY
- ▲ 1.59%
- F500 in state
- 60
Industry mix (Fortune 500 HQ in IL)
| Industry | F500 HQs | Revenue |
|---|---|---|
| Insurance | 4 | $201B |
|
||
| Consumer Goods | 4 | $87B |
|
||
| Industrial Machinery | 3 | $64B |
|
||
| Healthcare | 2 | $55B |
|
||
| Retail / Pharmacy | 1 | $148B |
|
||
| Agriculture / Food | 1 | $86B |
|
||
Price history
3 events — show timeline
- 2026-03-12 Pending — CIBR
- 2026-02-20 Contingent — CIBR
- 2026-01-30 Listed $81,000 CIBR
Cash-flow waterfall
monthlySold comps — $/sqft
last 12 mo · ≤1 miLoading sold comps…