3084 Titan Springs Dr · Fort Worth, TX
Flood risk No data
- FEMA flood zone
- —
- Chance of flooding over 30 yrs
- —
- Est. flood insurance / yr
- —
Fire risk No data
- Est. fire insurance / yr
- —
Heat risk No data
- Hot days now (above threshold)
- —
- Hot days in 30 yrs
- —
Wind risk No data
- Chance of severe wind over 30 yrs
- —
Air-quality risk No data
- Unhealthy air days now
- —
- Unhealthy air days in 30 yrs
- —
Risk factors via First Street. Map © Google.
Why this score? — see what drove the D- grade
The composite is a weighted blend of 9 inputs, each scored 0–100. Each bar is that input's sub-score; the figure is the points it added to the 100-point composite (weight × sub-score).
- Cash flow +12.8/30.0
- ARV discount +7.5/15.0
- Livability +4.0/5.0
- DSCR +3.8/10.0
- Schools +3.5/10.0
- Rent growth +2.9/5.0
- 1% rule +2.6/10.0
- Condition / age +2.5/5.0
- Appreciation +0.0/10.0
$315,399
🖨 Deal sheet (PDF) 📄 Offer letter ✓ Due diligence
Listing remarks
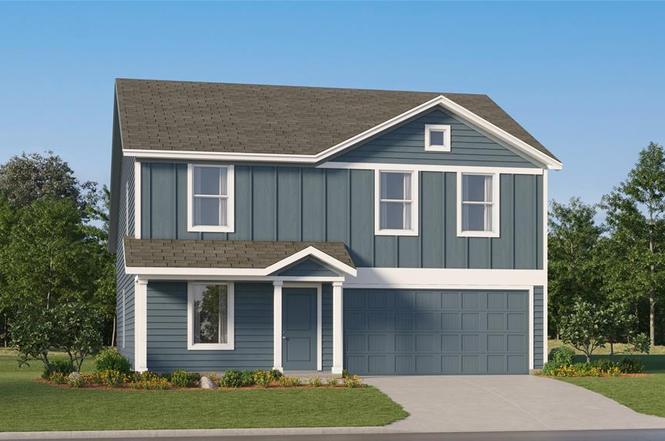
On the first floor of this spacious two-story home is a convenient and modern layout seamlessly connecting the kitchen, dining room and family room together. In a private corner is the tranquil owner’s suite with an attached bathroom and walk-in closet. Upstairs is a sprawling central game room made for gatherings of all sizes, along with three secondary bedrooms to provide sleeping accommodations to family members and guests.
Key facts
- Central game room
- Attached bathroom
- Walk-in closet
Tags
Property features AI
Finance
- Other: Deed restrictions apply; Subdivision: Northpointe
- Financial info: Financing available: Cash, Conventional, FHA, VA
- HOA & community: Mandatory homeowners association; HOA fee approximately $500 annually; HOA covers full use of facilities, grounds maintenance, and management fees; HOA managed by CMA
Exterior
- Parking: Attached 2-car garage (2 covered spaces, garage faces rear; 2-car single door); Garage approximately 20' wide by 18' long; No carport spaces
- Security: Burglar alarm; Carbon monoxide detector(s); Fire alarm; Prewired for security; Smoke detector(s)
- Utilities: City water; City sewer; Concrete streets/curbs/sidewalks; Not in a municipal utility district; Energy-efficient features: attic insulation (12 inch+), insulation, low-flow commodes, rain/freeze sensors, energy-efficient windows
- Home design: Single-family residence; Residential property; New construction (2025) — incomplete
- Construction: Brick and fiber cement construction; Composition roof; Slab foundation; Year built 2025
- Exterior features: Covered porch(es); Wood fencing; Interior landscaped lot; Lot dimensions approximately 40 x 120
Interior
- Kitchen: Dishwasher; Disposal; Electric oven; Gas cooktop; Microwave; Kitchen island; Eat-in kitchen; Built-in cabinets; Natural stone / granite counters; Walk-in pantry; Water line to refrigerator
- Bedrooms: 4 bedrooms — all on the main level; Primary bedroom on main level with dual sinks, linen closet, and walk-in closet
- Flooring: Carpet; Luxury vinyl plank
- Bathrooms: 2 full bathrooms
- Heating & cooling: Central heating (natural gas); Central air conditioning
- Interior features: High-speed internet available; Walk-in closets; 7 total rooms; 2 living areas; 1 dining area; Two-level home
- Laundry & utility: Laundry/utility features not specified
Neighborhood map
What this means for you Summary
Snapshot
- This is a 4-bed/2.0-bath other listed at $315k.
Deal economics
- At list price, monthly cash flow is $-28 ($-330/yr) — negative.
- To cash-flow at today's rent, offer at most $311k (1.5% below list).
- To meet the 1% rule (rent ≥ 1% of price), the offer needs to be $240k (23.9% below list).
- Recommended offer: $240k (23.9% below list) — sets the bar for 1% rule.
- Cap rate 6.2% vs local median 3.9% in Fort Worth — top-decile yield for the area; either an underpriced asset or a hidden risk that comps aren't pricing in. Stress-test before assuming the spread holds.
Location & tenants
- Location reads 80/100 on livability (#49 in TX, #1,954 nationally) — a professional / high-income tenant draw. Strengths: amenities A+, cost of living A+, housing A+; Watch: crime F.
- Eagle Mt-Saginaw ISD (urban): math 35% / reading 42% proficiency, ranked #361 of 826 in TX (top 44%) — families likely to look elsewhere, expect single-tenant / working-renter base with shorter leases.
- Zoned schools: Eagle Mountain El (math 40% / reading 42%, grade F, #1,462 of 4,322 statewide, top 34%, 507 students, 19% FRL); Wayside Middle (math 42% / reading 42%, grade D-, #572 of 1,662 statewide, top 36%, 1,077 students, 39% FRL); Boswell H S (math 49% / reading 62%, grade C, #364 of 1,632 statewide, top 23%, 2,547 students, 37% FRL) — zoned schools at 32% FRL track the district average.
- Market conditions: Rents rising (+1.5%/yr); 1074 active listings in the ZIP; 40 comparable units currently listed for rent nearby; rentals at typical pace (median 27d on market — plan ~3-4 weeks tenant-placement turnaround); solid renter incomes; 18,938 units permitted in Tarrant County in 2024 (8,336 in 5+ unit buildings).
Forward outlook
- Local home prices are declining (-3.0%/yr); year-one equity from $2k of loan paydown is wiped out by about $9k of value loss. Plan a longer hold.
- Tarrant County population projected at +41% by 2050 — long-run rental-demand tailwind backs the buy-and-hold thesis.
Negotiation context
- It's been on market 69 days — a 6% lower offer ($296k) is reasonable based on typical stale-listing flexibility.
Questions for the listing agent
- What do current leases actually rent for vs. the listed asking? Can we see a recent rent roll and the last 12 months of T-12 income?
- It's been on market 69 days. Have you received any prior offers? Is the seller open to a 24% concession, seller financing, or rate buy-down credit?
- What does the HOA fee cover, when was the last increase, and are there any pending special assessments or reserve-fund shortfalls?
- Why hasn't it sold? Are there any deal-killer items the seller is aware of (foundation, flood, title, zoning, code violations)?
- Is there a deadline driving the sale (1031 exchange, divorce, estate, relocation)? That informs how much negotiation room exists.
- Schools are D-rated, which usually means shorter tenancies and higher turnover. Who's the typical renter profile here, and what's been the actual vacancy rate?
- Crime grade is F in this area — have there been break-ins, vandalism, or insurance claims at this property in the last 3 years? What carrier currently insures it and at what premium?
- The area grade is low — what's the realistic commute time and amenity access for the typical tenant pool here? Any planned neighborhood developments (good or bad) we should know about?
- What's the average days-on-market for RENTAL listings here right now (not sales)? A rising rental-DOM trend means longer vacancies and softer asking-rent achievability than the comps imply.
- What's the recent tenant-quality profile in this submarket — average credit score on applications, eviction rate, late-payment / NSF rate, and stable-employment percentage? A property-management company in the area should have these aggregated.
- How much new for-sale + rental construction is in the pipeline within 1–3 miles? Heavy new supply typically softens prices + rents 12–24 months out; constrained supply supports both.
Investment metrics
- 1% rule
- 0.76% ✗
- Cap rate
- 6.19%
- Cash-on-cash
- -0.37%
- DSCR
- 0.98
- GRM
- 10.9
CMA / ARV
No comps found within radius.
Projected returns pro-forma
-3.0% appreciation · 1.51% rent growth · sell at horizon
- IRR
- -18.5%
- Equity multiple
- 0.36×
- Total profit
- $-56,530
- Equity at exit
- $47,027
- IRR
- -13.7%
- Equity multiple
- 0.25×
- Total profit
- $-66,100
- Equity at exit
- $27,270
Cash invested: $88,312 (down + closing). Projections, not guarantees.
Landlord ↔ Tenant lean methodology
- Overall (STATE)
- 87 Strongly Landlord-Friendly
- State Texas
- 87 Strongly Landlord-Friendly · R+5
- County
- — inherits STATE
- City
- — inherits STATE
ZIP-level market 76179
- Rents YoY
- 1.5%
- Active inventory
- 1074
- Price-to-rent
- 10.9×
Monthly cashflow live
- Estimated rent
- $2,401 high interval (Pro) →
- Mortgage (P&I)
- −$1,654
- Tax from tax record
- −$97 /mo · $1,166/yr
- Insurance
- −$131
- HOA
- −$42
- Vacancy / Maint / Mgmt
- −$504
- Net cashflow
- $-28
Break-even live
Sensitivity live
| Price | -10% $151 | -5% $62 | +0% $-28 | +5% $-117 | +10% $-206 |
|---|---|---|---|---|---|
| Rent | -10% $-217 | -5% $-122 | +0% $-28 | +5% $67 | +10% $162 |
| Rate | -1.0pp $131 | -0.5pp $53 | base $-28 | +0.5pp $-109 | +1.0pp $-192 |
UW: 25.0% down · 7.5% · 30yr · 1.5% tax · 5.0% vac · 8.0% maint · 8.0% mgmt
Financing live
Cash to close
- Down payment
- $78,850
- Closing costs
- $9,462
- Reserves months
- —
- Total cash needed
- —
Loan-product check · same deal, 3 products live
Conventional
25% down · 7.5% · 30yr
- Down + closing
- —
- Monthly P&I
- —
- Monthly cashflow
- —
- DSCR
- —
- Eligible?
- —
Personal DTI + credit; lowest rate.
DSCR
20% down · 8.5% · 30yr
- Down + closing
- —
- Monthly P&I
- —
- Monthly cashflow
- —
- DSCR
- —
- Eligible?
- —
No personal income docs; deal must DSCR.
Hard money
10% down · 12.0% · 12mo
- Down + closing
- —
- Monthly P&I
- —
- Monthly cashflow
- —
- DSCR
- —
- Eligible?
- —
Short-term bridge; refi at stabilization.
Rent comps 40 comps
| Address | Beds | Baths | Sqft | Rent | $/sqft | DOM | Units | Dist |
|---|---|---|---|---|---|---|---|---|
| 3012 Tooley Dr Fort Worth, TX | 4.0 | 2.0 | 1719 | $2,200 | $1.28 | 26d | 1 | 0.05mi |
| 3053 Titan Springs Dr Fort Worth, TX | 4.0 | 2.0 | 1667 | $2,320 | $1.39 | 26d | 1 | 0.14mi |
| 8925 Old Rawhide Ln Fort Worth, TX | 4.0 | 2.0 | 1809 | $2,295 | $1.27 | 14d | 1 | 0.41mi |
| 8916 Old Rawhide Ln Fort Worth, TX | 4.0 | 2.0 | 1776 | $2,250 | $1.27 | 26d | 1 | 0.44mi |
| 8901 Timber Gulch Dr Fort Worth, TX | 3.0 | 2.0 | 1442 | $2,195 | $1.52 | 14d | 1 | 0.48mi |
| 9021 Eagles Landing Dr Fort Worth, TX | 4.0 | 2.0 | 1850 | $2,295 | $1.24 | 22d | 1 | 0.48mi |
| 9709 Trusler Rd Fort Worth, TX | 3.0 | 2.0 | 1440 | $2,250 | $1.56 | 26d | 1 | 0.49mi |
| 6212 Flour Mill Run Fort Worth, TX | 4.0 | 2.0 | 1820 | $2,500 | $1.37 | 26d | 1 | 0.54mi |
| 9833 Trusler Rd Fort Worth, TX | 3.0 | 2.0 | 1450 | $2,050 | $1.41 | 0d | 1 | 0.65mi |
| 9832 Trusler Rd Fort Worth, TX | 3.0 | 2.0 | 1266 | $1,875 | $1.48 | 26d | 1 | 0.66mi |
| 2916 Tibbles Dr Fort Worth, TX | 3.0 | 2.0 | 1440 | $1,899 | $1.32 | 26d | 1 | 0.69mi |
| 9108 Lookout Pt Fort Worth, TX | 3.0 | 2.0 | 1711 | $2,100 | $1.23 | 9d | 1 | 0.71mi |
| 2800 Slatewood Dr Fort Worth, TX | 3.0 | 2.0 | 1450 | $2,045 | $1.41 | 0d | 1 | 0.73mi |
| 2800 Slatewood Dr Fort Worth, TX | 3.0 | 2.0 | 1450 | $2,045 | $1.41 | 3d | 1 | 0.73mi |
| 8928 Puerto Vista Dr Fort Worth, TX | 3.0 | 2.0 | 1631 | $2,050 | $1.26 | 26d | 1 | 0.74mi |
| 2629 Turtle Dove Dr Fort Worth, TX | 3.0 | 2.0 | 1534 | $2,075 | $1.35 | 8d | 1 | 0.76mi |
| 8700 Smokehouse Dr Fort Worth, TX | 5.0 | 2.0 | 2133 | $2,495 | $1.17 | 26d | 1 | 0.76mi |
| 5864 Mount Plymouth Pt Fort Worth, TX | 3.0 | 2.0 | 1635 | $2,100 | $1.28 | 26d | 1 | 0.81mi |
| 5729 Mirror Ridge Dr Fort Worth, TX | 3.0 | 2.0 | 1276 | $1,950 | $1.53 | 20d | 1 | 0.83mi |
| 2521 Bunkerton Dr Fort Worth, TX | 4.0 | 2.0 | 1674 | $2,450 | $1.46 | 26d | 1 | 0.84mi |
| 6312 Spring Buck Run Unit Na Fort Worth, TX | 4.0 | 2.0 | 1819 | $2,195 | $1.21 | 19d | 1 | 0.89mi |
| 2500 Bunkerton Dr Fort Worth, TX | 4.0 | 2.0 | 1674 | $1,909 | $1.14 | 26d | 1 | 0.90mi |
| 5817 Deck House Rd Fort Worth, TX | 3.0 | 2.0 | 1327 | $1,900 | $1.43 | 26d | 1 | 0.92mi |
| 10212 Regal Bend Ln Saginaw, TX | 4.0 | 2.0 | 1867 | $2,395 | $1.28 | 19d | 1 | 0.92mi |
| 5837 Fantail Dr Fort Worth, TX | 3.0 | 2.0 | 1635 | $1,925 | $1.18 | 0d | 1 | 0.93mi |
| 5837 Fantail Dr Fort Worth, TX | 3.0 | 2.0 | 1635 | $1,925 | $1.18 | 24d | 1 | 0.93mi |
| 8725 Hidden Hill Dr Fort Worth, TX | 3.0 | 2.5 | 2052 | $2,500 | $1.22 | 26d | 1 | 0.94mi |
| 2521 Birchcrest Dr Fort Worth, TX | 4.0 | 3.0 | 2371 | $2,795 | $1.18 | 26d | 1 | 0.98mi |
| 8225 Spotted Doe Dr Fort Worth, TX | 4.0 | 2.0 | 1777 | $2,250 | $1.27 | 26d | 1 | 0.99mi |
| 2528 Northcote Dr Fort Worth, TX | 3.0 | 2.5 | 2277 | $2,306 | $1.01 | 0d | 1 | 1.05mi |
| 6261 Bush Buck Run Fort Worth, TX | 4.0 | 2.0 | 1597 | $1,995 | $1.25 | 26d | 1 | 1.07mi |
| 9925 Little Tree Ln Fort Worth, TX | 3.0 | 2.5 | 2081 | $2,600 | $1.25 | 26d | 1 | 1.11mi |
| 10021 Elkhorn Dr Fort Worth, TX | 4.0 | 3.0 | 2238 | $2,595 | $1.16 | 4d | 1 | 1.14mi |
| 10021 Elkhorn Dr Fort Worth, TX | 4.0 | 3.0 | 2238 | $2,595 | $1.16 | 0d | 1 | 1.14mi |
| 6220 Jackstaff Dr Fort Worth, TX | 3.0 | 2.0 | 1700 | $1,999 | $1.18 | 3d | 1 | 1.16mi |
| 6268 Topsail Dr Fort Worth, TX | 3.0 | 2.5 | 2616 | $2,850 | $1.09 | 26d | 1 | 1.20mi |
| 8521 Centerboard Ln Fort Worth, TX | 5.0 | 2.0 | 2136 | $2,525 | $1.18 | 8d | 1 | 1.29mi |
| 8517 Centerboard Ln Fort Worth, TX | 4.0 | 2.0 | 1773 | $2,400 | $1.35 | 26d | 1 | 1.30mi |
| 8520 Little Acorn Dr Fort Worth, TX | 4.0 | 2.0 | 1836 | $2,300 | $1.25 | 26d | 1 | 1.36mi |
| 8520 Little Acorn Dr Fort Worth, TX | 4.0 | 2.0 | 1836 | $2,200 | $1.20 | 0d | 1 | 1.36mi |
HOA detail
- Monthly dues
- $42 · $504/yr
Listing history 8 events
-
2026-05-18status Pending
-
2026-05-15price $315,399
-
2026-05-14price $313,414
-
2026-05-12price $315,399
-
2026-05-09price $316,549
-
2026-04-15price $320,549
-
2026-04-04price $317,549
-
2026-03-10$341,549 Active
ⓘ Source: listings_history table (triggers on properties + properties_extension) + one-shot
backfill from property_details.listing_events for pre-trigger history.
Tax reassessment forecast TX · Resets to sale price
- Current annual tax
- $1,166 · $97/mo
- Projected year-2 tax
- $5,772 · $481/mo
- Expected delta
- +$4,606/yr (+$384/mo · 395.1%)
ⓘ Screening estimate from a state-policy table — verify with the county assessor before closing.
Nearby sold comps map
Loading sold comps map…
Walkable amenities ~0.75 mi
Loading nearby amenities…
Taxation est. · year 1
- Rental income
- $28,815
- − Mortgage interest
- −$17,667
- − Property taxes
- −$1,166
- − Insurance
- −$1,577
- − Repairs & maintenance
- −$2,305
- − Management
- −$2,305
- − HOA
- −$504
- − Depreciation
- −$9,175
- Taxable loss
- −$5,884
- Est. tax savings @ 24.0%
- +$1,412
- After-tax cash flow
- $1,082/yr
For passive investors: Depreciation is non-cash, so a rental often shows a tax loss while cash-flowing — sheltering income. Rental losses are passive: they offset passive income freely, and up to $25,000/yr can offset ordinary (W-2) income if you actively participate and your MAGI is under $100k (phasing out to $0 by $150k); unused losses carry forward. On sale, claimed depreciation is recaptured at up to 25%, and gains may owe capital-gains tax (a 1031 exchange can defer both). Figures are a year-1 estimate at your 24.0% rate — not tax advice; consult a CPA.
Schools (NCES district)
- District
- Eagle Mt-Saginaw ISD
- NCES district ID
- 4817700
- Math proficiency
- 35% ▼ -16.00%
- Reading proficiency
- 42% ▼ -9.00%
- Median HH income
- $72,781
- Composite
- 35.41/100
- National rank
- #4945
- State rank
- #361 of 826 in TX
Livability — Fort Worth
- Score
- 80/100
- State rank
- #49
- US rank
- #1954
Category grades
Schools grade is shown separately in the Schools card above.
Census & demographics
- Census place
- Fort Worth, TX
- County
- Tarrant County · 2,033,669 people
- City population
- 911,619
- Metro
- Dallas-Fort Worth-Arlington, TX
- Population (ZIP)
- 80,090
- Household income
- $107,428
- Rent vs Own
- Severe rent burden
- 1494.0
Population outlook (Tarrant County) Hauer SSP2
- Today (2025)
- 2,380,417 people
- By 2030
- 2,578,900 · +8.3%
- By 2040
- 2,974,995 · +25.0%
- By 2050
- 3,350,489 · +40.8%
- By 2075
- 4,216,909 · +77.2%
- By 2100
- 4,741,527 · +99.2%
Race, ethnicity, and origin ACS 2023
- Neighborhood character
- Diverse neighborhood (Simpson 0.63)
- Race & ethnicity
- White 53% Hispanic / Latino 28% Two or more races 14% Black 12% Asian 4%
- Hispanic origin (detail)
- Mexican 22% Puerto Rican 2%
- Common ancestry
- Slovak 2% Lithuanian 2% Italian 1%
- Foreign-born
- 8% · Canada, Jamaica
- Languages at home
- 81% English-only · Spanish 15% Other Asian/Pacific 2% Other Indo-European 1%
Political lean MEDSL · Tarrant
- 2024 margin
- Lean R (+5.1) · D 46.7% · R 51.9% · Other 1.4%
- 2008→2024 swing
- +6.6pp toward D · 2008: -11.7pp · 2024: -5.1pp
- All cycles
- 2024: R+5.1 2020: D+0.2 2016: R+8.7 2012: R+15.7 2008: R+11.7
Not yet ingested
- Civics
- —
Market trends
- HPI YoY
- ▼ -137.12%
- Current HPI
- 237.6676
- Rent YoY
- ▲ 1.51%
- Metro
- Dallas-Fort Worth-Arlington, TX
- State GDP YoY
- ▲ 3.95%
- F500 in state
- 110
Industry mix (Fortune 500 HQ in TX)
| Industry | F500 HQs | Revenue |
|---|---|---|
| Energy | 16 | $1,198B |
|
||
| Technology | 5 | $198B |
|
||
| Engineering / Construction | 4 | $72B |
|
||
| Energy Services | 3 | $60B |
|
||
| Utilities | 3 | $41B |
|
||
| Healthcare | 2 | $330B |
|
||
Price history
-7.7% since first listed8 events — show timeline
- 2026-05-18 Pending — NTREIS
- 2026-05-15 Price Changed $315,399 NTREIS
- 2026-05-14 Price Changed $313,414 NTREIS
- 2026-05-12 Price Changed $315,399 NTREIS
- 2026-05-09 Price Changed $316,549 NTREIS
- 2026-04-15 Price Changed $320,549 NTREIS
- 2026-04-04 Price Changed $317,549 NTREIS
- 2026-03-10 Listed $341,549 NTREIS
Cash-flow waterfall
monthlySold comps — $/sqft
last 12 mo · ≤1 miLoading sold comps…