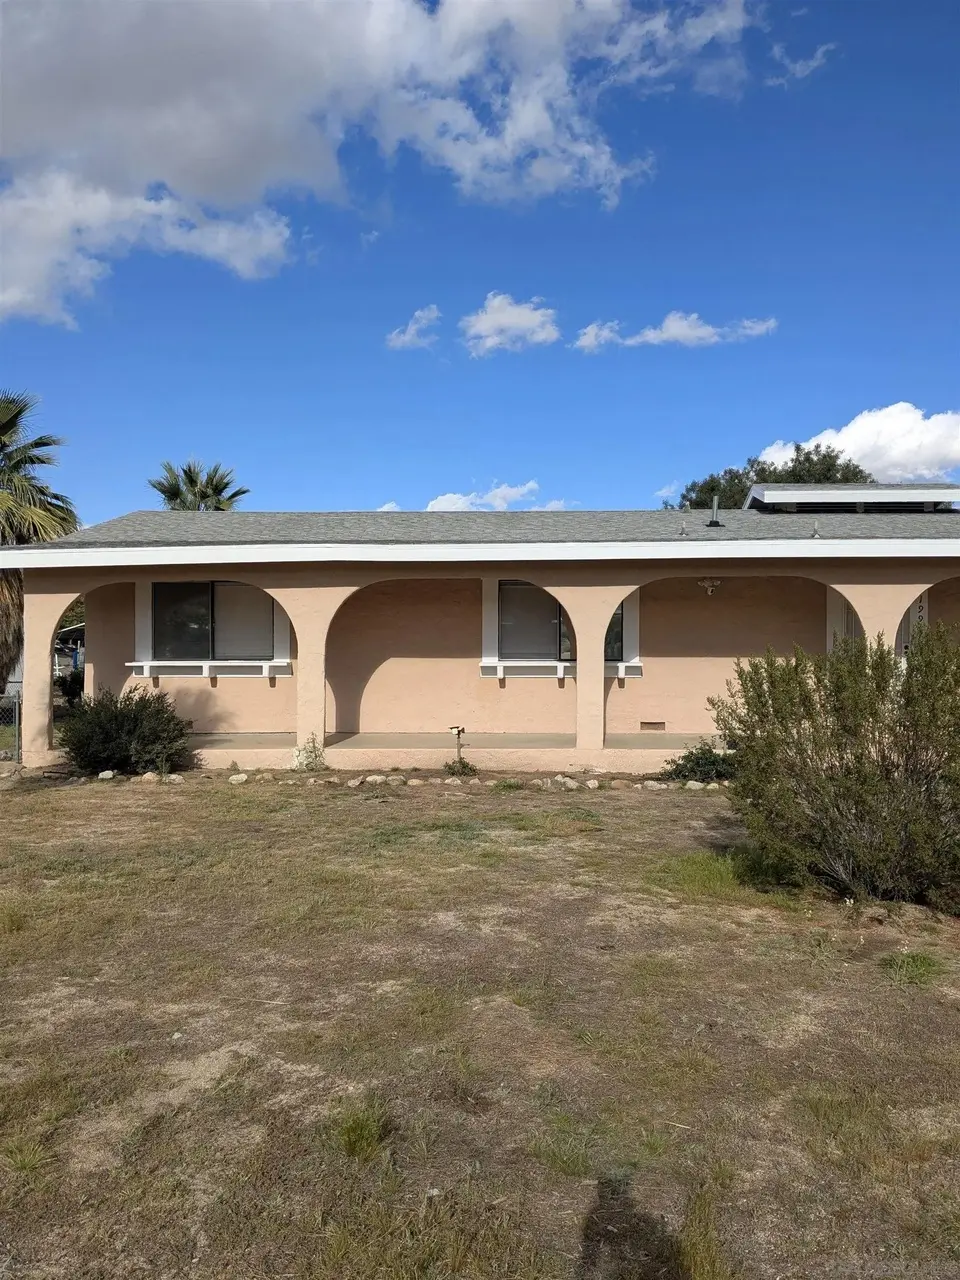
1991 Hauberk Rd · Borrego Springs, CA
Flood risk 1/10 · Minimal
- FEMA flood zone
- AO
- Chance of flooding over 30 yrs
- 0.0%
- Est. flood insurance / yr
- $848 – $2,087
Fire risk 5/10 · Moderate
- Est. fire insurance / yr
- $659 – $1,223
Heat risk 9/10 · Severe
- Hot days now (above 112°F)
- 10 days/yr
- Hot days in 30 yrs
- 29 days/yr
Wind risk 1/10 · Minimal
- Chance of severe wind over 30 yrs
- —
Air-quality risk 3/10 · Minor
- Unhealthy air days now
- 3 days/yr
- Unhealthy air days in 30 yrs
- 4 days/yr
Risk factors via First Street. Map © Google.
Why this score? — see what drove the D+ grade
The composite is a weighted blend of 9 inputs, each scored 0–100. Each bar is that input's sub-score; the figure is the points it added to the 100-point composite (weight × sub-score).
- Cash flow +15.1/30.0
- ARV discount +12.8/15.0
- DSCR +4.6/10.0
- 1% rule +3.0/10.0
- Livability +2.9/5.0
- Schools +2.6/10.0
- Rent growth +2.5/5.0
- Condition / age +2.5/5.0
- Appreciation +0.0/10.0
$330,000
🖨 Deal sheet (PDF) 📄 Offer letter ✓ Due diligence
Listing remarks MLS
Well kept lovely home in the Sun Gold development situated on a corner lot with big backyard and ample parking. 2 car garage, new septic system and newer flooring in the master bedroom and back bedroom. Bonus room for office, crafts, etc. Low maintenance yard but plenty of room for gardens. Borrego is a gorgeous dark sky community so perfect for star gazing. Clean air, incredible metal art sculptures throughout the valley and peace and quiet. A truly unique place to live!
Key facts
- Big backyard
- Newer flooring
- Ample parking
Tags
Neighborhood map
What this means for you Summary
Snapshot
- This is a 3-bed/2.0-bath single-family listed at $330k.
Deal economics
- At list price, monthly cash flow is $-13 ($-159/yr) — negative.
- To cash-flow at today's rent, offer at most $328k (0.7% below list).
- To meet the 1% rule (rent ≥ 1% of price), the offer needs to be $263k (20.4% below list).
- Recommended offer: $263k (20.4% below list) — sets the bar for 1% rule.
Location & tenants
- Location reads 58/100 on livability (#712 in CA) — a working-class tenant base; expect higher turnover. Strengths: crime A+, employment A+, housing A+; Watch: amenities F, commute F, cost of living F.
- Borrego Springs Unified (rural): math 20% / reading 35% proficiency, ranked #1,120 of 1,400 in CA (top 80%) — low school quality limits family demand, transient renter base, plan for 1-2y turnover; 72% free/reduced lunch — lower-income household profile, screen leases tightly.
- Zoned schools: Borrego Springs Elementary (math 24% / reading 24%, grade F, #973 of 1,571 statewide, top 73%, 154 students, 84% FRL); Borrego Springs Middle (math 12% / reading 32%, grade F, #388 of 498 statewide, top 80%, 80 students, 92% FRL); Borrego Springs High (math 30% / reading 50%, grade F, #520 of 1,170 statewide, top 45%, 124 students, 87% FRL) — zoned schools average 88% FRL vs 72% district-wide (16 pts higher); higher-poverty schools than district average — tighter screening recommended.
- Market conditions: 172 active listings in the ZIP; 11,759 units permitted in San Diego County in 2024 (7,244 in 5+ unit buildings).
Forward outlook
- Local home prices are declining (-3.0%/yr); year-one equity from $2k of loan paydown is wiped out by about $10k of value loss. Plan a longer hold.
- San Diego County population projected at +20% by 2050 — long-run rental-demand tailwind backs the buy-and-hold thesis.
Negotiation context
- It's been on market 86 days — a 6% lower offer ($310k) is reasonable based on typical stale-listing flexibility.
- 3 sale attempts since 20y ago with the ask held roughly flat each time — persistent listings suggest the price (not the market) is what's stuck; bring a comps-based counter.
- Current owner paid $80k; list at $330k implies a 312% gain — meaningful room to come down on a strong offer.
Risks & watch-outs
- Watch-outs: flood insurance adds $122/mo.
- Climate carrying-cost: in FEMA flood zone AO (mandatory federal flood insurance); moderate wildfire risk; extreme-heat days projected 10→29/yr by 2055 (HVAC capex compounding) — expect insurance premiums to compound above CPI over the hold.
Questions for the listing agent
- What do current leases actually rent for vs. the listed asking? Can we see a recent rent roll and the last 12 months of T-12 income?
- It's been on market 86 days. Have you received any prior offers? Is the seller open to a 20% concession, seller financing, or rate buy-down credit?
- Built in 1974 — when were the roof, HVAC, electrical panel, plumbing, and water heater last replaced?
- What's the actual annual flood-insurance premium (NFIP or private), and is the property in a SFHA with mandatory coverage?
- Why hasn't it sold? Are there any deal-killer items the seller is aware of (foundation, flood, title, zoning, code violations)?
- Is there a deadline driving the sale (1031 exchange, divorce, estate, relocation)? That informs how much negotiation room exists.
- Schools are F-rated, which usually means shorter tenancies and higher turnover. Who's the typical renter profile here, and what's been the actual vacancy rate?
- The area grade is low — what's the realistic commute time and amenity access for the typical tenant pool here? Any planned neighborhood developments (good or bad) we should know about?
- What's the average days-on-market for RENTAL listings here right now (not sales)? A rising rental-DOM trend means longer vacancies and softer asking-rent achievability than the comps imply.
- What's the recent tenant-quality profile in this submarket — average credit score on applications, eviction rate, late-payment / NSF rate, and stable-employment percentage? A property-management company in the area should have these aggregated.
- How much new for-sale + rental construction is in the pipeline within 1–3 miles? Heavy new supply typically softens prices + rents 12–24 months out; constrained supply supports both.
Investment metrics
- 1% rule
- 0.80% ✗
- Cap rate
- 6.69%
- Cash-on-cash
- 1.42%
- DSCR
- 1.06
- GRM
- 10.5
CMA / ARV
- ARV (median comp)
- $374,187
- List price
- $330,000
- Delta
- -11.81%
- Verdict
- UNDERPRICED
- Comps
- 20 within 1.0 mi
Show comp detail 7 sales within ~0.75 mi
| Address | Dist | Beds/Ba | Sqft | Sold | Price | $/sf | Match |
|---|---|---|---|---|---|---|---|
| 1981 Hauberk Dr | 0.02mi | 3/2.0 | 1,368 (+2%) | 13mo | $355,000 | $260 | 85 |
| 356 Velite Dr | 0.15mi | 3/2.0 | 1,427 (+6%) | 11mo | $375,000 | $263 | 74 |
| 1906 Trebuchet Dr | 0.09mi | 2/2.0 (-1) | 1,410 (+5%) | 14mo | $375,000 | $266 | 70 |
| 1815 Falchion St | 0.26mi | 3/2.0 | 1,212 (-10%) | 18mo | $405,000 | $334 | 56 |
| 2207 Hoberg Rd | 0.50mi | 2/2.0 (-1) | 1,497 (+11%) | 7mo | $650,000 | $434 | 47 |
| 354 Wranglers Dr | 0.65mi | 3/2.0 | 1,225 (-9%) | 13mo | $465,000 | $380 | 44 |
| 1607 Lazy Dr S | 0.66mi | 2/2.0 (-1) | 1,225 (-9%) | 14mo | $445,000 | $363 | 38 |
Match score weights: distance 35% · size 25% · config 20% · recency 20%. Top-matched comps best support the ARV.
Projected returns pro-forma
-3.0% appreciation · 3.0% rent growth · sell at horizon
- IRR
- -16.6%
- Equity multiple
- 0.41×
- Total profit
- $-54,398
- Equity at exit
- $49,204
- IRR
- -8.5%
- Equity multiple
- 0.47×
- Total profit
- $-48,774
- Equity at exit
- $28,532
Cash invested: $92,400 (down + closing). Projections, not guarantees.
Landlord ↔ Tenant lean methodology
- Overall (STATE)
- 18 Strongly Tenant-Friendly
- State California
- 18 Strongly Tenant-Friendly · D+13
- County
- — inherits STATE
- City
- — inherits STATE
ZIP-level market 92004
- Home prices YoY
- -18.4%
- Active inventory
- 172
- Price-to-rent
- 10.5×
Monthly cashflow live
- Estimated rent
- $2,628 medium interval (Pro) →
- Mortgage (P&I)
- −$1,731
- Tax from tax record
- −$99 /mo · $1,188/yr
- Insurance
- −$138
- Flood insurance flood zone
- −$122 /mo · $1,468/yr
- HOA
- −$0
- Vacancy / Maint / Mgmt
- −$552
- Net cashflow
- $-13
Break-even live
Sensitivity live
| Price | -10% $174 | -5% $80 | +0% $-13 | +5% $-107 | +10% $-200 |
|---|---|---|---|---|---|
| Rent | -10% $-221 | -5% $-117 | +0% $-13 | +5% $91 | +10% $194 |
| Rate | -1.0pp $153 | -0.5pp $71 | base $-13 | +0.5pp $-99 | +1.0pp $-186 |
UW: 25.0% down · 7.5% · 30yr · 1.5% tax · 5.0% vac · 8.0% maint · 8.0% mgmt
Financing live
Cash to close
- Down payment
- $82,500
- Closing costs
- $9,900
- Reserves months
- —
- Total cash needed
- —
Loan-product check · same deal, 3 products live
Conventional
25% down · 7.5% · 30yr
- Down + closing
- —
- Monthly P&I
- —
- Monthly cashflow
- —
- DSCR
- —
- Eligible?
- —
Personal DTI + credit; lowest rate.
DSCR
20% down · 8.5% · 30yr
- Down + closing
- —
- Monthly P&I
- —
- Monthly cashflow
- —
- DSCR
- —
- Eligible?
- —
No personal income docs; deal must DSCR.
Hard money
10% down · 12.0% · 12mo
- Down + closing
- —
- Monthly P&I
- —
- Monthly cashflow
- —
- DSCR
- —
- Eligible?
- —
Short-term bridge; refi at stabilization.
Listing history 15 events
-
2026-06-02days on market $330,000 Active 86 DOM
-
2026-06-01days on market $330,000 Active 85 DOM
-
2026-05-31days on market $330,000 Active 84 DOM
-
2026-05-31days on market $330,000 Active 83 DOM
-
2026-03-09$330,000 Active 476-char remark
Show marketing remark (476 chars)
Well kept lovely home in the Sun Gold development situated on a corner lot with big backyard and ample parking. 2 car garage, new septic system and newer flooring in the master bedroom and back bedroom. Bonus room for office, crafts, etc. Low maintenance yard but plenty of room for gardens. Borrego is a gorgeous dark sky community so perfect for star gazing. Clean air, incredible metal art sculptures throughout the valley and peace and quiet. A truly unique place to live!
-
2011-08-22soldstatus $80,000 10-char remark
Show marketing remark (10 chars)
Short Sale
-
2011-01-31price $85,000
-
2010-09-21$85,000 10-char remark
Show marketing remark (10 chars)
Short Sale
-
2006-10-30soldstatus $265,000
-
2006-10-30soldstatus $265,000
-
2006-02-01$285,000
-
2005-04-01soldstatus $185,000
-
2000-08-25soldstatus $117,500
-
1990-06-08soldstatus $77,000
-
1985-09-04soldstatus $89,000
ⓘ Source: listings_history table (triggers on properties + properties_extension) + one-shot
backfill from property_details.listing_events for pre-trigger history.
Tax reassessment forecast CA · Resets to sale price
- Current annual tax
- $1,188 · $99/mo
- Projected year-2 tax
- $2,508 · $209/mo
- Expected delta
- +$1,320/yr (+$110/mo · 111.1%)
ⓘ Screening estimate from a state-policy table — verify with the county assessor before closing.
Climate risk First Street
- Flood 1/10 Low FEMA zone AO · 0% chance over 30 yrs
- Wildfire 5/10 Major
- Heat 9/10 Extreme 10 d/yr ≥112°F today · 29 d/yr by 30 yrs out
- Wind 1/10 Low
- Air quality 3/10 Moderate 3 unhealthy d/yr today · 4 by 30 yrs out
Nearby sold comps map
Loading sold comps map…
Walkable amenities ~0.75 mi
Loading nearby amenities…
Taxation est. · year 1
- Rental income
- $31,536
- − Mortgage interest
- −$18,485
- − Property taxes
- −$1,188
- − Insurance
- −$3,118
- − Repairs & maintenance
- −$2,523
- − Management
- −$2,523
- − Depreciation
- −$9,600
- Taxable loss
- −$5,901
- Est. tax savings @ 24.0%
- +$1,416
- After-tax cash flow
- $1,257/yr
For passive investors: Depreciation is non-cash, so a rental often shows a tax loss while cash-flowing — sheltering income. Rental losses are passive: they offset passive income freely, and up to $25,000/yr can offset ordinary (W-2) income if you actively participate and your MAGI is under $100k (phasing out to $0 by $150k); unused losses carry forward. On sale, claimed depreciation is recaptured at up to 25%, and gains may owe capital-gains tax (a 1031 exchange can defer both). Figures are a year-1 estimate at your 24.0% rate — not tax advice; consult a CPA.
Schools (NCES district)
- District
- Borrego Springs Unified
- NCES district ID
- 0605700
- Math proficiency
- 20% ▼ -6.00%
- Reading proficiency
- 35% ▼ -6.00%
- Median HH income
- $42,330
- Composite
- 26.31/100
- National rank
- #12684
- State rank
- #1120 of 1400 in CA
Livability — Borrego Springs
- Score
- 58/100
- State rank
- #712
- US rank
- #21334
Category grades
Schools grade is shown separately in the Schools card above.
Census & demographics
- Census place
- Borrego Springs, CA
- Population (ZIP)
- 3,030
Population outlook (San Diego County) Hauer SSP2
- Today (2025)
- 3,678,185 people
- By 2030
- 3,856,546 · +4.8%
- By 2040
- 4,171,407 · +13.4%
- By 2050
- 4,421,607 · +20.2%
- By 2075
- 4,831,599 · +31.4%
- By 2100
- 4,832,502 · +31.4%
Race, ethnicity, and origin ACS 2023
- Neighborhood character
- Predominantly White (66%)
- Race & ethnicity
- White 66% Hispanic / Latino 33% Two or more races 24%
- Hispanic origin (detail)
- Mexican 29%
- Common ancestry
- Lithuanian 10% Slovak 5% Scotch-Irish 1%
- Foreign-born
- 27% · Canada
- Languages at home
- 70% English-only · Spanish 30%
Political lean MEDSL · San Diego
- 2024 margin
- D (+16.8) · D 56.9% · R 40.1% · Other 2.9%
- 2008→2024 swing
- +6.6pp toward D · 2008: 10.2pp · 2024: 16.8pp
- All cycles
- 2024: D+16.8 2020: D+22.8 2016: D+17.8 2012: D+5.1 2008: D+10.2
Not yet ingested
- Civics
- —
Market trends
- HPI YoY
- ▼ -50.39%
- Current HPI
- 222.8196
- Rent YoY
- —
- Metro
- —
- State GDP YoY
- ▲ 3.21%
- F500 in state
- 116
Industry mix (Fortune 500 HQ in CA)
| Industry | F500 HQs | Revenue |
|---|---|---|
| Technology | 27 | $1,492B |
|
||
| Financial Services | 3 | $174B |
|
||
| Retail | 3 | $44B |
|
||
| Insurance | 3 | $26B |
|
||
| Media / Entertainment | 2 | $115B |
|
||
| Pharmaceuticals / Biotech | 2 | $62B |
|
||
Price history
+270.8% since first listed11 events — show timeline
- 2026-03-09 Listed $330,000 SDMLS
- 2011-08-22 Sold (MLS) $80,000 CRMLS
- 2011-01-31 Price Changed $85,000 SDMLS
- 2010-09-21 Listed $85,000 CRMLS
- 2006-10-30 Sold (Public Records) $265,000 Public Records
- 2006-10-30 Sold (MLS) $265,000 CRMLS
- 2006-02-01 Listed $285,000 CRMLS
- 2005-04-01 Sold (Public Records) $185,000 Public Records
- 2000-08-25 Sold (Public Records) $117,500 Public Records
- 1990-06-08 Sold (Public Records) $77,000 Public Records
- 1985-09-04 Sold (Public Records) $89,000 Public Records
Property tax history
-5.0%/yrLatest (2025): $1,188 · +2.1% YoY. Source: county tax records.
Cash-flow waterfall
monthlySold comps — $/sqft
last 12 mo · ≤1 miLoading sold comps…