36 Fryer Aly · Addison (Webster Springs), WV
Flood risk 1/10 · Minimal
- FEMA flood zone
- X (unshaded)
- Chance of flooding over 30 yrs
- 0.0%
- Est. flood insurance / yr
- $507 – $1,088
Fire risk 3/10 · Minor
- Est. fire insurance / yr
- $787 – $1,461
Heat risk 4/10 · Minor
- Hot days now (above 90°F)
- 9 days/yr
- Hot days in 30 yrs
- 27 days/yr
Wind risk 1/10 · Minimal
- Chance of severe wind over 30 yrs
- —
Air-quality risk 1/10 · Minimal
- Unhealthy air days now
- 0 days/yr
- Unhealthy air days in 30 yrs
- 0 days/yr
Risk factors via First Street. Map © Google.
Why this score? — see what drove the C- grade
The composite is a weighted blend of 9 inputs, each scored 0–100. Each bar is that input's sub-score; the figure is the points it added to the 100-point composite (weight × sub-score).
- Cash flow +19.3/30.0
- ARV discount +7.5/15.0
- DSCR +6.1/10.0
- Appreciation +6.1/10.0
- 1% rule +5.1/10.0
- Rent growth +2.5/5.0
- Livability +2.5/5.0
- Condition / age +2.5/5.0
- Schools +2.2/10.0
$85,000
🖨 Deal sheet 📄 Offer letter ✓ Due diligence
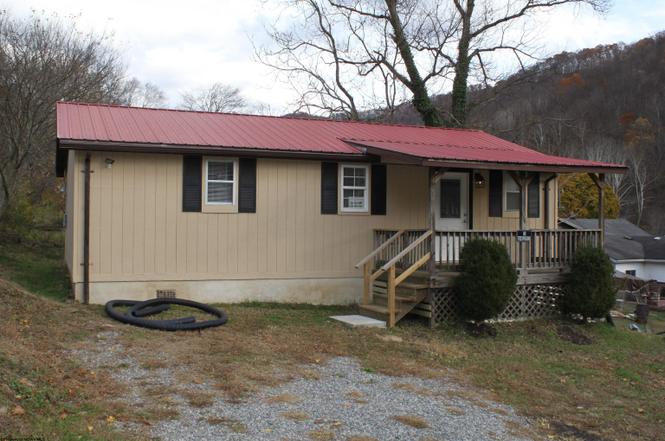
Listing remarks
Well Maintained, Ready to Move-into, Single Level Living Home featuring Open Living Space with Modern Kitchen with new appliances & pantry closet, 3 bedrooms, 1 bath, covered porches, all city utilities, cell phone and high speed internet available, plus Elk River is at the end of the street.
Key facts
- Covered porches
- Open living space
- New appliances
Tags
Property features AI
Finance
- HOA & community: Community pool
Exterior
- Parking: Off-street parking; On-street parking
- Utilities: Public water; Public sewer; Cable available
- Home design: Single-family detached residence; 1 story
- Construction: Frame construction; Metal roof; Crawl space basement
- Exterior features: Porch; Level lot; River frontage / close proximity to river
Interior
- Kitchen: Range; Refrigerator; Microwave
- Bedrooms: 6 total rooms (bedroom count not specified)
- Flooring: Vinyl flooring
- Bathrooms: 1 full bathroom
- Heating & cooling: Baseboard heating; Electric heating
- Interior features: Refrigerator; Microwave; Range
Neighborhood map
What this means for you Summary
Snapshot
- This is a 3-bed/1.0-bath single-family listed at $85k.
Deal economics
- At list price, monthly cash flow is $93 ($1k/yr) — positive.
- The deal already cash-flows at list — no discount required.
- Meets the 1% rule at list price ($861 rent vs $85k).
- Recommended offer: $75k (12.0% below list) — sets the bar for market timing.
Location & tenants
- Location reads: area grade C — affects rentability + tenant quality, not the cash-flow math above.
- Webster County Schools (rural): math 23% / reading 31% proficiency, ranked #45 of 55 in WV (top 82%) — low school quality limits family demand, transient renter base, plan for 1-2y turnover.
- Zoned schools: Webster Springs Elementary School (math 27% / reading 37%, grade F, #191 of 377 statewide, top 56%, 235 students, 0% FRL); Webster County High School (math 22% / reading 32%, grade F, #79 of 110 statewide, top 78%, 526 students, 0% FRL) — zoned schools average 0% FRL vs 57% district-wide (57 pts lower); this property's tenant base skews higher-income than the district average.
- Market conditions: 17 active listings in the ZIP.
Forward outlook
- In year one you build about $3k of equity ($588 loan paydown + $2k appreciation (2.3% local appreciation)).
- Webster County population projected at -40% by 2050 — secular population decline; favor cash flow + early exit over multi-decade hold.
- At projected returns (2.3% appreciation + 3.0% rent growth), your $24k cash investment doubles in ~6 years — after that, you're playing with house money.
Negotiation context
- It's been on market 182 days — a 12% lower offer ($75k) is reasonable based on typical stale-listing flexibility.
- 3 sale attempts with the ask held roughly flat each time — persistent listings suggest the price (not the market) is what's stuck; bring a comps-based counter.
Questions for the listing agent
- It's been on market 182 days. Have you received any prior offers? Is the seller open to a 12% concession, seller financing, or rate buy-down credit?
- Why hasn't it sold? Are there any deal-killer items the seller is aware of (foundation, flood, title, zoning, code violations)?
- Is there a deadline driving the sale (1031 exchange, divorce, estate, relocation)? That informs how much negotiation room exists.
- What's the average days-on-market for RENTAL listings here right now (not sales)? A rising rental-DOM trend means longer vacancies and softer asking-rent achievability than the comps imply.
- What's the recent tenant-quality profile in this submarket — average credit score on applications, eviction rate, late-payment / NSF rate, and stable-employment percentage? A property-management company in the area should have these aggregated.
- How much new for-sale + rental construction is in the pipeline within 1–3 miles? Heavy new supply typically softens prices + rents 12–24 months out; constrained supply supports both.
Investment metrics
- 1% rule
- 1.01% ✓
- Cap rate
- 7.61%
- Cash-on-cash
- 4.69%
- DSCR
- 1.21
- GRM
- 8.2
CMA / ARV
No comps found within radius.
Projected returns pro-forma
2.28% appreciation · 3.0% rent growth · sell at horizon
- IRR
- 9.9%
- Equity multiple
- 1.55×
- Total profit
- $12,983
- Equity at exit
- $34,819
- IRR
- 12.8%
- Equity multiple
- 2.77×
- Total profit
- $42,038
- Equity at exit
- $51,152
Cash invested: $23,800 (down + closing). Projections, not guarantees.
Landlord ↔ Tenant lean methodology
- Overall (STATE)
- 83 Strongly Landlord-Friendly
- State West Virginia
- 83 Strongly Landlord-Friendly · R+22
- County
- — inherits STATE
- City
- — inherits STATE
ZIP-level market 26288
- Home prices YoY
- 1.7%
- Active inventory
- 17
- Price-to-rent
- 8.2×
Monthly cashflow live
- Estimated rent
- $861 medium interval (Pro) →
- Mortgage (P&I)
- −$446
- Tax est. 1.5%
- −$106 /mo · $1,275/yr
- Insurance
- −$35
- HOA
- −$0
- Vacancy / Maint / Mgmt
- −$181
- Net cashflow
- $93
Break-even live
UW: 25.0% down · 7.5% · 30yr · 1.5% tax · 5.0% vac · 8.0% maint · 8.0% mgmt
Financing live
Cash to close
- Down payment
- $21,250
- Closing costs
- $2,550
- Reserves months
- —
- Total cash needed
- —
Loan-product check · same deal, 3 products live
Conventional
25% down · 7.5% · 30yr
- Down + closing
- —
- Monthly P&I
- —
- Monthly cashflow
- —
- DSCR
- —
- Eligible?
- —
Personal DTI + credit; lowest rate.
DSCR
20% down · 8.5% · 30yr
- Down + closing
- —
- Monthly P&I
- —
- Monthly cashflow
- —
- DSCR
- —
- Eligible?
- —
No personal income docs; deal must DSCR.
Hard money
10% down · 12.0% · 12mo
- Down + closing
- —
- Monthly P&I
- —
- Monthly cashflow
- —
- DSCR
- —
- Eligible?
- —
Short-term bridge; refi at stabilization.
Listing history 21 events
-
2026-06-18days on market $85,000 Active 182 DOM
-
2026-06-17days on market $85,000 Active 181 DOM
-
2026-06-16days on market $85,000 Active 180 DOM
-
2026-06-15days on market $85,000 Active 179 DOM
-
2026-06-15days on market $85,000 Active 178 DOM
-
2026-06-13days on market $85,000 Active 177 DOM
-
2026-06-12days on market $85,000 Active 176 DOM
-
2026-06-09days on market $85,000 Active 173 DOM
-
2026-06-08days on market $85,000 Active 172 DOM
-
2026-06-08days on market $85,000 Active 171 DOM
-
2026-06-07days on market $85,000 Active 170 DOM
-
2026-06-04days on market $85,000 Active 168 DOM
-
2026-06-03days on market $85,000 Active 167 DOM
-
2026-06-02days on market $85,000 Active 166 DOM
-
2026-06-01days on market $85,000 Active 165 DOM
-
2026-05-31days on market $85,000 Active 164 DOM
-
2026-05-16status Active
-
2026-05-01historical
-
2026-04-30status Active
-
2026-04-06status Pending
-
2025-11-10$85,000 Active
ⓘ Source: listings_history table (triggers on properties + properties_extension) + one-shot
backfill from property_details.listing_events for pre-trigger history.
Climate risk First Street
- Flood 1/10 Low FEMA zone X (unshaded) · 0% chance over 30 yrs
- Wildfire 3/10 Moderate
- Heat 4/10 Moderate 9 d/yr ≥90°F today · 27 d/yr by 30 yrs out
- Wind 1/10 Low
- Air quality 1/10 Low 0 unhealthy d/yr today · 0 by 30 yrs out
Nearby sold comps map
Loading sold comps map…
Walkable amenities ~0.75 mi
Loading nearby amenities…
Taxation est. · year 1
- Rental income
- $10,336
- − Mortgage interest
- −$4,761
- − Property taxes
- −$1,275
- − Insurance
- −$425
- − Repairs & maintenance
- −$827
- − Management
- −$827
- − Depreciation
- −$2,473
- Taxable loss
- −$252
- Est. tax savings @ 24.0%
- +$60
- After-tax cash flow
- $1,177/yr
For passive investors: Depreciation is non-cash, so a rental often shows a tax loss while cash-flowing — sheltering income. Rental losses are passive: they offset passive income freely, and up to $25,000/yr can offset ordinary (W-2) income if you actively participate and your MAGI is under $100k (phasing out to $0 by $150k); unused losses carry forward. On sale, claimed depreciation is recaptured at up to 25%, and gains may owe capital-gains tax (a 1031 exchange can defer both). Figures are a year-1 estimate at your 24.0% rate — not tax advice; consult a CPA.
Schools (NCES district)
- District
- Webster County Schools
- NCES district ID
- 5401530
- Math proficiency
- 23% ▼ -1.00%
- Reading proficiency
- 31% ▼ -3.00%
- Median HH income
- $30,013
- Composite
- 21.78/100
- National rank
- #8252
- State rank
- #45 of 55 in WV
Livability — Addison (Webster Springs)
No livability data for this city. (Only ~50 U.S. cities are tracked.)
Census & demographics
- Census place
- Addison (Webster Springs), WV
- Population (ZIP)
- 2,958
Population outlook (Webster County) Hauer SSP2
- Today (2025)
- 7,604 people
- By 2030
- 6,943 · -8.7%
- By 2040
- 5,661 · -25.6%
- By 2050
- 4,557 · -40.1%
- By 2075
- 2,883 · -62.1%
- By 2100
- 2,096 · -72.4%
Race, ethnicity, and origin ACS 2023
- Neighborhood character
- Predominantly White (95%)
- Race & ethnicity
- White 95% Two or more races 5%
- Common ancestry
- Iranian 4% Slovak 3% Serbian 1%
- Languages at home
- 99% English-only · German/W. Germanic 1%
Political lean MEDSL · Webster
- 2024 margin
- Solid R (+66.7) · D 16.0% · R 82.7% · Other 1.4%
- 2008→2024 swing
- -72.1pp toward R · 2008: 5.4pp · 2024: -66.7pp
- All cycles
- 2024: R+66.7 2020: R+63.2 2016: R+58.5 2012: R+28.0 2008: D+5.4
Not yet ingested
- Civics
- —
Market trends
- HPI YoY
- ▲ 2.28%
- Current HPI
- 133.4561
- Rent YoY
- —
- Metro
- —
- State GDP YoY
- —
- F500 in state
- 0
Price history
5 events — show timeline
- 2026-05-16 Relisted — NCWVREIN
- 2026-05-01 Delisted — NCWVREIN
- 2026-04-30 Relisted — NCWVREIN
- 2026-04-06 Pending — NCWVREIN
- 2025-11-10 Listed $85,000 NCWVREIN
Cash-flow waterfall
monthlySold comps — $/sqft
last 12 mo · ≤1 miLoading sold comps…