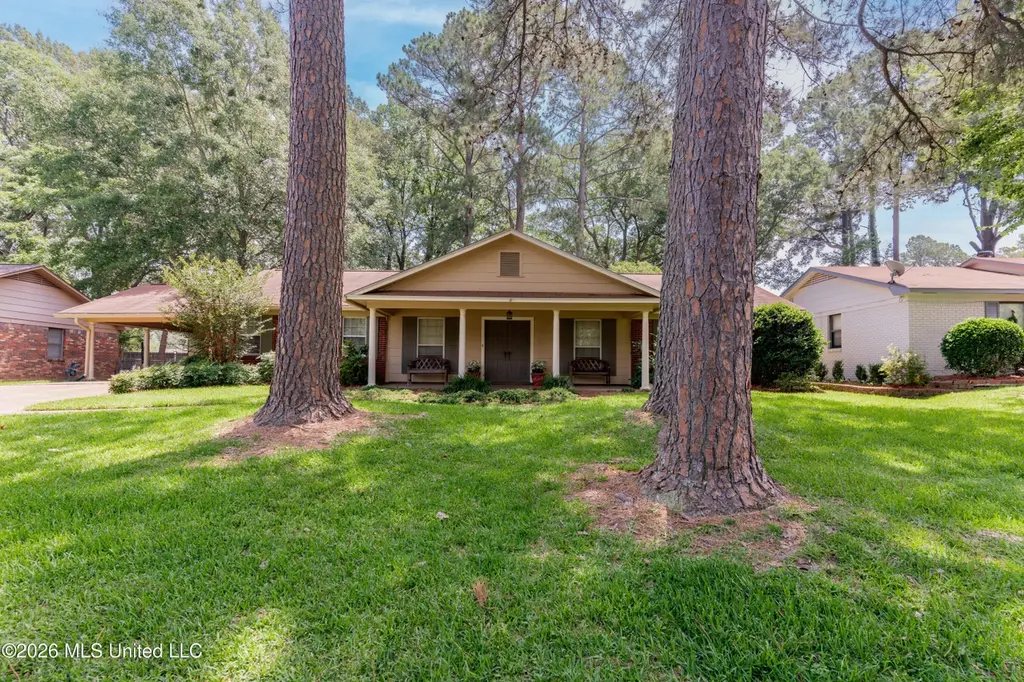
715 Tanglewood Dr · Clinton, MS
Flood risk 1/10 · Minimal
- FEMA flood zone
- X (unshaded)
- Chance of flooding over 30 yrs
- 0.0%
- Est. flood insurance / yr
- $507 – $1,088
Fire risk 1/10 · Minimal
- Est. fire insurance / yr
- $1,241 – $2,305
Heat risk 7/10 · Major
- Hot days now (above 109°F)
- 7 days/yr
- Hot days in 30 yrs
- 20 days/yr
Wind risk 8/10 · Major
- Chance of severe wind over 30 yrs
- 80.0%
Air-quality risk 1/10 · Minimal
- Unhealthy air days now
- 0 days/yr
- Unhealthy air days in 30 yrs
- 0 days/yr
Risk factors via First Street. Map © Google.
Why this score? — see what drove the D grade
The composite is a weighted blend of 9 inputs, each scored 0–100. Each bar is that input's sub-score; the figure is the points it added to the 100-point composite (weight × sub-score).
- Cash flow +13.5/30.0
- ARV discount +10.6/15.0
- Schools +4.8/10.0
- DSCR +4.1/10.0
- Livability +3.5/5.0
- 1% rule +3.1/10.0
- Condition / age +2.5/5.0
- Rent growth +1.6/5.0
- Appreciation +0.0/10.0
$226,900
🖨 Deal sheet 📄 Offer letter ✓ Due diligence
Listing remarks
Welcome to 715 Tanglewood Drive in Clinton Park! This well-maintained home offers a functional layout and plenty of desirable features. Relax and enjoy the LARGE COVERED FRONT PORCH, perfect for morning coffee, visiting with neighbors, or unwinding at the end of the day. Inside, you'll find HARDWOOD FLOORS in the spacious den/dining room, creating a warm and inviting atmosphere for everyday living and entertaining. A COAT CLOSET IN THE ENTRY provides convenient storage for guests and everyday essentials. The kitchen features GRANITE COUNTERTOPS, STAINLESS STEEL APPLIANCES, and an ELECTRIC COOKTOP, offering both style and functionality. An adjoining BREAKFAST AREA provides the perfect spot f
Key facts
- Electric cooktop
- Granite countertops
- Hardwood floors
Tags
Property features AI
Exterior
- Parking: Attached carport with 2 carport spaces
- Utilities: Public water; Public sewer; Electricity connected; Natural gas connected; Sewer connected; Water connected
- Home design: Single family residence (house); One level
- Construction: Brick and siding exterior; Slab foundation; Year built info from public records (year not specified)
- Exterior features: Three tab shingle roof; Back yard fence with gate
Interior
- Kitchen: Cooktop; Oven; Dishwasher
- Bedrooms: Bedrooms info not provided
- Flooring: Flooring info not provided
- Bathrooms: 2 full bathrooms and 1 half bathroom (3 total)
- Heating & cooling: Central heating; Central air; Ceiling fan(s)
- Interior features: Ceiling fans; Central heating; Central air
- Laundry & utility: Washer/Dryer; Gas water heater
Neighborhood map
What this means for you Summary
Snapshot
- This is a 3-bed/2.0-bath single-family listed at $227k.
Deal economics
- At list price, monthly cash flow is $10 ($125/yr) — positive.
- The deal already cash-flows at list — no discount required.
- To meet the 1% rule (rent ≥ 1% of price), the offer needs to be $184k (18.7% below list).
- Recommended offer: $184k (18.7% below list) — sets the bar for 1% rule.
- Cap rate 6.3% vs local median 4.3% in Clinton — top-decile yield for the area; either an underpriced asset or a hidden risk that comps aren't pricing in. Stress-test before assuming the spread holds.
Location & tenants
- Location reads 69/100 on livability (#49 in MS) — a middle-class / working-renter tenant base. Strengths: crime A+, cost of living A+, housing A+; Watch: amenities F, commute F, health & safety F.
- Clinton Public School District (rural): math 58% / reading 53% proficiency, ranked #4 of 130 in MS (top 3%) — acceptable for families but not a draw, mixed tenant base, ~2y average lease.
- Zoned schools: Clinton Park Elem School (712 students, 100% FRL); Clinton Jr Hi School (math 69% / reading 54%, grade B+, #6 of 179 statewide, top 3%, 871 students, 100% FRL) — zoned schools average 100% FRL vs 38% district-wide (61 pts higher); higher-poverty schools than district average — tighter screening recommended.
- Market conditions: Rents falling (-3.7%/yr); 233 active listings in the ZIP; solid renter incomes; 167 units permitted in Hinds County in 2024 (0 in 5+ unit buildings).
Forward outlook
- Local home prices are declining (-3.0%/yr); year-one equity from $2k of loan paydown is wiped out by about $7k of value loss. Plan a longer hold.
- Hinds County population projected to shrink 6% by 2050 — rents likely to lag national; underwrite the cash flow, not the appreciation.
Negotiation context
- Only 14 days on market — expect competitive offers; lowballing is unlikely to land.
Risks & watch-outs
- Climate carrying-cost: severe wind risk, 80% chance of damaging wind over 30y; extreme-heat days projected 7→20/yr by 2055 (HVAC capex compounding) — expect insurance premiums to compound above CPI over the hold.
Questions for the listing agent
- Built in 1963 — when were the roof, HVAC, electrical panel, plumbing, and water heater last replaced?
- Is there a deadline driving the sale (1031 exchange, divorce, estate, relocation)? That informs how much negotiation room exists.
- Schools are B-rated — typically a magnet for longer-tenancy family renters. What's the average tenant stay here, and is there a school-zone premium baked into asking?
- The area grade is low — what's the realistic commute time and amenity access for the typical tenant pool here? Any planned neighborhood developments (good or bad) we should know about?
- What's the average days-on-market for RENTAL listings here right now (not sales)? A rising rental-DOM trend means longer vacancies and softer asking-rent achievability than the comps imply.
- What's the recent tenant-quality profile in this submarket — average credit score on applications, eviction rate, late-payment / NSF rate, and stable-employment percentage? A property-management company in the area should have these aggregated.
- How much new for-sale + rental construction is in the pipeline within 1–3 miles? Heavy new supply typically softens prices + rents 12–24 months out; constrained supply supports both.
Investment metrics
- 1% rule
- 0.81% ✗
- Cap rate
- 6.35%
- Cash-on-cash
- 0.20%
- DSCR
- 1.01
- GRM
- 10.2
CMA / ARV
- ARV (on-the-fly)
- $243,939
- Comps found
- 12
Show comp detail 12 sales within ~0.75 mi
| Address | Dist | Beds/Ba | Sqft | Sold | Price | $/sf | Match |
|---|---|---|---|---|---|---|---|
| 1406 Post Rd | 0.25mi | 3/2.0 | 1,871 (-1%) | 3mo | $249,500 | $133 | 84 |
| 107 Murial St | 0.18mi | 3/2.0 | 1,782 (-6%) | 2mo | $239,900 | $135 | 80 |
| 705 Pinehurst St | 0.13mi | 3/2.0 | 1,692 (-10%) | 0mo | $212,500 | $126 | 76 |
| 1409 Post Rd | 0.25mi | 3/2.0 | 2,000 (+6%) | 3mo | $194,000 | $97 | 76 |
| 1013 Normandy Dr | 0.51mi | 4/2.0 (+1) | 1,893 (+0%) | 2mo | $225,000 | $119 | 69 |
| 2 Pheasant Run | 0.56mi | 3/2.0 | 1,863 (-2%) | 6mo | $190,000 | $102 | 66 |
| 807 Normandy Dr | 0.58mi | 4/2.0 (+1) | 1,833 (-3%) | 1mo | $249,900 | $136 | 62 |
| 707 Berkshire St | 0.47mi | 4/3.0 (+1) | 1,813 (-4%) | 1mo | $225,000 | $124 | 62 |
| 105 Mcree Dr | 0.42mi | 3/2.0 | 1,671 (-12%) | 3mo | $219,000 | $131 | 58 |
| 4 Southwood Blvd | 0.72mi | 4/3.0 (+1) | 1,987 (+5%) | 0mo | $158,000 | $80 | 49 |
| 601 Bellevue St | 0.45mi | 4/2.5 (+1) | 1,648 (-13%) | 4mo | $212,000 | $129 | 47 |
| 1203 Rockingham Dr | 0.75mi | 3/2.0 | 1,729 (-9%) | 5mo | $225,000 | $130 | 46 |
Match score weights: distance 35% · size 25% · config 20% · recency 20%. Top-matched comps best support the ARV.
Projected returns pro-forma
-3.0% appreciation · 0.0% rent growth · sell at horizon
- IRR
- -19.2%
- Equity multiple
- 0.35×
- Total profit
- $-41,558
- Equity at exit
- $33,832
- IRR
- -18.9%
- Equity multiple
- 0.11×
- Total profit
- $-56,418
- Equity at exit
- $19,618
Cash invested: $63,532 (down + closing). Projections, not guarantees.
Landlord ↔ Tenant lean methodology
- Overall (STATE)
- 90 Strongly Landlord-Friendly
- State Mississippi
- 90 Strongly Landlord-Friendly · R+11
- County
- — inherits STATE
- City
- — inherits STATE
ZIP-level market 39056
- Rents YoY
- -3.7%
- Active inventory
- 233
- Price-to-rent
- 10.2×
Monthly cashflow live
- Estimated rent
- $1,845 medium interval (Pro) →
- Mortgage (P&I)
- −$1,190
- Tax from tax record
- −$163 /mo · $1,952/yr
- Insurance
- −$95
- HOA
- −$0
- Vacancy / Maint / Mgmt
- −$387
- Net cashflow
- $10
Break-even live
UW: 25.0% down · 7.5% · 30yr · 1.5% tax · 5.0% vac · 8.0% maint · 8.0% mgmt
Financing live
Cash to close
- Down payment
- $56,725
- Closing costs
- $6,807
- Reserves months
- —
- Total cash needed
- —
Loan-product check · same deal, 3 products live
Conventional
25% down · 7.5% · 30yr
- Down + closing
- —
- Monthly P&I
- —
- Monthly cashflow
- —
- DSCR
- —
- Eligible?
- —
Personal DTI + credit; lowest rate.
DSCR
20% down · 8.5% · 30yr
- Down + closing
- —
- Monthly P&I
- —
- Monthly cashflow
- —
- DSCR
- —
- Eligible?
- —
No personal income docs; deal must DSCR.
Hard money
10% down · 12.0% · 12mo
- Down + closing
- —
- Monthly P&I
- —
- Monthly cashflow
- —
- DSCR
- —
- Eligible?
- —
Short-term bridge; refi at stabilization.
Listing history 12 events
-
2026-06-18days on market $226,900 Active 14 DOM
-
2026-06-17days on market $226,900 Active 13 DOM
-
2026-06-16days on market $226,900 Active 12 DOM
-
2026-06-15days on market $226,900 Active 11 DOM
-
2026-06-14days on market $226,900 Active 9 DOM
-
2026-06-13days on market $226,900 Active 8 DOM
-
2026-06-10days on market $226,900 Active 6 DOM
-
2026-06-09days on market $226,900 Active 5 DOM
-
2026-06-08days on market $226,900 Active 4 DOM
-
2026-06-07days on market $226,900 Active 3 DOM
-
2026-06-05remarks 699-char remark
-
2026-06-05$226,900 Active 1 DOM
ⓘ Source: listings_history table (triggers on properties + properties_extension) + one-shot
backfill from property_details.listing_events for pre-trigger history.
Tax reassessment forecast MS · Resets to sale price
- Current annual tax
- $1,952 · $163/mo
- Projected year-2 tax
- $1,952 · $163/mo
- Expected delta
- $0/yr ($0/mo · 0.0%)
ⓘ Screening estimate from a state-policy table — verify with the county assessor before closing.
Climate risk First Street
- Flood 1/10 Low FEMA zone X (unshaded) · 0% chance over 30 yrs
- Wildfire 1/10 Low
- Heat 7/10 Severe 7 d/yr ≥109°F today · 20 d/yr by 30 yrs out
- Wind 8/10 Severe 80% chance of damaging wind over 30 yrs
- Air quality 1/10 Low 0 unhealthy d/yr today · 0 by 30 yrs out
Nearby sold comps map
Loading sold comps map…
Walkable amenities ~0.75 mi
Loading nearby amenities…
Taxation est. · year 1
- Rental income
- $22,139
- − Mortgage interest
- −$12,710
- − Property taxes
- −$1,952
- − Insurance
- −$1,134
- − Repairs & maintenance
- −$1,771
- − Management
- −$1,771
- − Depreciation
- −$6,601
- Taxable loss
- −$3,800
- Est. tax savings @ 24.0%
- +$912
- After-tax cash flow
- $1,037/yr
For passive investors: Depreciation is non-cash, so a rental often shows a tax loss while cash-flowing — sheltering income. Rental losses are passive: they offset passive income freely, and up to $25,000/yr can offset ordinary (W-2) income if you actively participate and your MAGI is under $100k (phasing out to $0 by $150k); unused losses carry forward. On sale, claimed depreciation is recaptured at up to 25%, and gains may owe capital-gains tax (a 1031 exchange can defer both). Figures are a year-1 estimate at your 24.0% rate — not tax advice; consult a CPA.
Schools (NCES district)
- District
- Clinton Public School District
- NCES district ID
- 2801090
- Math proficiency
- 58% ▼ -9.00%
- Reading proficiency
- 53% ▼ -7.00%
- Median HH income
- $55,993
- Composite
- 47.95/100
- National rank
- #2205
- State rank
- #4 of 130 in MS
Livability — Clinton
- Score
- 69/100
- State rank
- #49
- US rank
- #8341
Category grades
Schools grade is shown separately in the Schools card above.
Census & demographics
- Census place
- Clinton, MS
- County
- Hinds County · 167,040 people
- City population
- 26,836
- Metro
- Jackson, MS
- Population (ZIP)
- 26,836
- Household income
- $75,110
- Rent vs Own
- Severe rent burden
- 780.0
Population outlook (Hinds County) Hauer SSP2
- Today (2025)
- 242,528 people
- By 2030
- 241,113 · -0.6%
- By 2040
- 235,557 · -2.9%
- By 2050
- 226,946 · -6.4%
- By 2075
- 199,995 · -17.5%
- By 2100
- 164,165 · -32.3%
Race, ethnicity, and origin ACS 2023
- Neighborhood character
- Diverse neighborhood (Simpson 0.58)
- Race & ethnicity
- White 50% Black 40% Asian 4% Two or more races 3% Hispanic / Latino 2%
- Common ancestry
- Slovak 4% Italian 2% Serbian 1%
- Foreign-born
- 6% · Canada, Vietnam, China
- Languages at home
- 92% English-only · Other Indo-European 2% Spanish 1% Vietnamese 1%
Political lean MEDSL · Hinds
- 2024 margin
- Solid D (+46.1) · D 72.4% · R 26.3% · Other 1.4%
- 2008→2024 swing
- +7.1pp toward D · 2008: 39.0pp · 2024: 46.1pp
- All cycles
- 2024: D+46.1 2020: D+48.3 2016: D+43.7 2012: D+45.1 2008: D+39.0
Not yet ingested
- Civics
- —
Market trends
- HPI YoY
- ▼ -148.13%
- Current HPI
- 176.266
- Rent YoY
- ▼ -3.70%
- Metro
- Jackson, MS
- State GDP YoY
- —
- F500 in state
- 0
Price history
2 events — show timeline
- 2026-06-04 Listed $226,900 MLSU
- 1984-02-16 Sold (Public Records) — Public Records
Property tax history
+7.3%/yrLatest (2025): $1,952 · +1.9% YoY. Source: county tax records.
Cash-flow waterfall
monthlySold comps — $/sqft
last 12 mo · ≤1 miLoading sold comps…