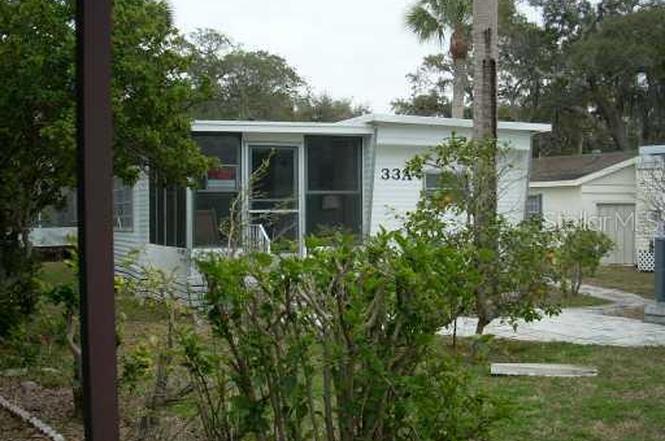
15010 113th Ave N Unit 33A · Largo, FL
Flood risk 10/10 · Severe
- FEMA flood zone
- AE
- Chance of flooding over 30 yrs
- 0.99%
- Est. flood insurance / yr
- $1,737 – $8,500
Fire risk 1/10 · Minimal
- Est. fire insurance / yr
- $947 – $1,759
Heat risk 10/10 · Severe
- Hot days now (above 107°F)
- 7 days/yr
- Hot days in 30 yrs
- 24 days/yr
Wind risk 10/10 · Severe
- Chance of severe wind over 30 yrs
- 99.0%
Air-quality risk 3/10 · Minor
- Unhealthy air days now
- 2 days/yr
- Unhealthy air days in 30 yrs
- 3 days/yr
Risk factors via First Street. Map © Google.
Why this score? — see what drove the C- grade
The composite is a weighted blend of 9 inputs, each scored 0–100. Each bar is that input's sub-score; the figure is the points it added to the 100-point composite (weight × sub-score).
- Cash flow +19.0/30.0
- ARV discount +7.5/15.0
- 1% rule +6.5/10.0
- DSCR +6.0/10.0
- Schools +4.3/10.0
- Livability +4.1/5.0
- Rent growth +3.0/5.0
- Condition / age +2.5/5.0
- Appreciation +0.0/10.0
$149,900
🖨 Deal sheet (PDF) 📄 Offer letter ✓ Due diligence
Listing remarks MLS
This is a great opportunity to purchase a mobile home in an intracoastal community. This is a must see. Totally furnished. Waterfront park with 2 community docks.
Key facts
- Expansive kitchen
- Remodeled bathroom
- New cabinets
Tags
Property features AI
Finance
- Financial info: Total monthly fees: $140; Total annual fees: $1,680; Lease restrictions apply
- HOA & community: Monthly HOA: $140 (includes grounds maintenance, water, sewer); Association requires approval; Clubhouse; Deed restrictions; Buyer approval required; Senior community; Cats allowed
Exterior
- Parking: Assigned parking
- Utilities: Public water; Public sewer; Electricity available and connected; Cable available and connected; Broadband/high-speed internet available; Water connected; Sewer connected
- Home design: Residential mobile home (double wide); Completed condition; One story; Faces west; Entry level: One
- Construction: Metal siding; Metal roof; Crawlspace foundation; Built as double wide
- Exterior features: Covered front porch with screened porch; French doors; Rain gutters; Shed(s); Flood zone
Interior
- Kitchen: Dishwasher; Microwave; Range; Refrigerator; Tankless water heater
- Bedrooms: 2 bedrooms
- Bathrooms: 1 full bath; 1 half bath
- Heating & cooling: Central heating (electric); Central air conditioning
- Interior features: Ceiling fans; Kitchen/family room combo; Living room/dining room combo; Open floorplan; Solid surface counters; Aluminum window frames
- Laundry & utility: Washer hookup; Electric dryer hookup; Laundry hookups inside; Outside/other laundry access
Neighborhood map
What this means for you Summary
Snapshot
- This is a 2-bed/1.5-bath manufactured listed at $150k.
Deal economics
- At list price, monthly cash flow is $-270 ($-3k/yr) — negative.
- To cash-flow at today's rent, offer at most $102k (31.9% below list).
- Meets the 1% rule at list price ($2k rent vs $150k).
- Recommended offer: $102k (31.9% below list) — sets the bar for cash-flow.
- Cap rate 7.5% vs local median 4.2% in Largo — top-decile yield for the area; either an underpriced asset or a hidden risk that comps aren't pricing in. Stress-test before assuming the spread holds.
Location & tenants
- Location reads 82/100 on livability (#82 in FL, #1,240 nationally) — a professional / high-income tenant draw. Strengths: commute A+, cost of living A+, housing A+; Watch: employment D+, amenities F.
- Pinellas (suburban): math 51% / reading 51% proficiency, ranked #31 of 73 in FL (top 42%) — acceptable for families but not a draw, mixed tenant base, ~2y average lease.
- Zoned schools: Oakhurst Elementary School (math 72% / reading 68%, grade A-, #345 of 2,144 statewide, top 17%, 664 students, 38% FRL); Seminole Middle School (math 55% / reading 53%, grade B-, #196 of 571 statewide, top 36%, 824 students, 49% FRL); Seminole High School (math 26% / reading 47%, grade F, #351 of 667 statewide, top 54%, 1,546 students, 39% FRL).
- Market conditions: Rents rising (+2.0%/yr); 213 active listings in the ZIP; 5 comparable units currently listed for rent nearby; rentals leasing fast (median 7d on market — plan ~1-2 weeks tenant-placement turnaround); solid renter incomes; 2,676 units permitted in Pinellas County in 2024 (1,422 in 5+ unit buildings).
Forward outlook
- Local home prices are declining (-3.0%/yr); year-one equity from $1k of loan paydown is wiped out by about $4k of value loss. Plan a longer hold.
- Pinellas County population projected at +14% by 2050 — modest demand growth; plan on rents tracking national, not racing it.
Negotiation context
- It's been on market 308 days — a 12% lower offer ($132k) is reasonable based on typical stale-listing flexibility.
- 2 sale attempts since 16y ago; this cycle's ask has dropped $30k (17%) from the opening price — seller is motivated, your offer sets the floor, not the list.
- Current owner paid $57k; list at $150k implies a 163% gain — meaningful room to come down on a strong offer.
Risks & watch-outs
- Watch-outs: flood insurance adds $427/mo.
- Climate carrying-cost: in FEMA flood zone AE (mandatory federal flood insurance); severe wind risk, 99% chance of damaging wind over 30y; extreme-heat days projected 7→24/yr by 2055 (HVAC capex compounding) — expect insurance premiums to compound above CPI over the hold.
Questions for the listing agent
- What do current leases actually rent for vs. the listed asking? Can we see a recent rent roll and the last 12 months of T-12 income?
- It's been on market 308 days. Have you received any prior offers? Is the seller open to a 32% concession, seller financing, or rate buy-down credit?
- Built in 1963 — when were the roof, HVAC, electrical panel, plumbing, and water heater last replaced?
- What's the actual annual flood-insurance premium (NFIP or private), and is the property in a SFHA with mandatory coverage?
- What does the HOA fee cover, when was the last increase, and are there any pending special assessments or reserve-fund shortfalls?
- Why hasn't it sold? Are there any deal-killer items the seller is aware of (foundation, flood, title, zoning, code violations)?
- Is there a deadline driving the sale (1031 exchange, divorce, estate, relocation)? That informs how much negotiation room exists.
- What's the average days-on-market for RENTAL listings here right now (not sales)? A rising rental-DOM trend means longer vacancies and softer asking-rent achievability than the comps imply.
- What's the recent tenant-quality profile in this submarket — average credit score on applications, eviction rate, late-payment / NSF rate, and stable-employment percentage? A property-management company in the area should have these aggregated.
- How much new for-sale + rental construction is in the pipeline within 1–3 miles? Heavy new supply typically softens prices + rents 12–24 months out; constrained supply supports both.
Investment metrics
- 1% rule
- 1.15% ✓
- Cap rate
- 7.54%
- Cash-on-cash
- 4.46%
- DSCR
- 1.20
- GRM
- 7.2
CMA / ARV
No comps found within radius.
Projected returns pro-forma
-3.0% appreciation · 2.01% rent growth · sell at horizon
- IRR
- -31.4%
- Equity multiple
- -0.02×
- Total profit
- $-42,827
- Equity at exit
- $22,351
- IRR
- -43.0%
- Equity multiple
- -0.54×
- Total profit
- $-64,731
- Equity at exit
- $12,961
Cash invested: $41,972 (down + closing). Projections, not guarantees.
Landlord ↔ Tenant lean methodology
- Overall (STATE)
- 87 Strongly Landlord-Friendly
- State Florida
- 87 Strongly Landlord-Friendly · R+3
- County
- — inherits STATE
- City
- — inherits STATE
ZIP-level market 33774
- Rents YoY
- 2.0%
- Active inventory
- 213
- Price-to-rent
- 7.2×
Monthly cashflow live
- Estimated rent
- $1,729 high interval (Pro) →
- Mortgage (P&I)
- −$786
- Tax from tax record
- −$221 /mo · $2,655/yr
- Insurance
- −$62
- Flood insurance flood zone
- −$427 /mo · $5,118/yr
- HOA
- −$140
- Lot rent leased land?
- −$0
- Vacancy / Maint / Mgmt
- −$363
- Net cashflow
- $-270
Break-even live
Sensitivity live
| Price | -10% $-186 | -5% $-228 | +0% $-270 | +5% $-313 | +10% $-355 |
|---|---|---|---|---|---|
| Rent | -10% $-407 | -5% $-339 | +0% $-270 | +5% $-202 | +10% $-134 |
| Rate | -1.0pp $-195 | -0.5pp $-232 | base $-270 | +0.5pp $-309 | +1.0pp $-349 |
UW: 25.0% down · 7.5% · 30yr · 1.5% tax · 5.0% vac · 8.0% maint · 8.0% mgmt
Financing live
Cash to close
- Down payment
- $37,475
- Closing costs
- $4,497
- Reserves months
- —
- Total cash needed
- —
Loan-product check · same deal, 3 products live
Conventional
25% down · 7.5% · 30yr
- Down + closing
- —
- Monthly P&I
- —
- Monthly cashflow
- —
- DSCR
- —
- Eligible?
- —
Personal DTI + credit; lowest rate.
DSCR
20% down · 8.5% · 30yr
- Down + closing
- —
- Monthly P&I
- —
- Monthly cashflow
- —
- DSCR
- —
- Eligible?
- —
No personal income docs; deal must DSCR.
Hard money
10% down · 12.0% · 12mo
- Down + closing
- —
- Monthly P&I
- —
- Monthly cashflow
- —
- DSCR
- —
- Eligible?
- —
Short-term bridge; refi at stabilization.
Rent comps 5 comps
| Address | Beds | Baths | Sqft | Rent | $/sqft | DOM | Units | Dist |
|---|---|---|---|---|---|---|---|---|
| 14531 Walsingham Rd Largo, FL | 2.0 | 1.0–2.0 | 657 | $2,600 | $3.96 | 26d | 3 | 0.65mi |
| 206 Bates Ave Unit E Indian Rocks Beach, FL | 1.0 | 1.0 | 600 | $1,945 | $3.24 | 6d | 1 | 0.93mi |
| 206 Bates Ave Indian Rocks Beach, FL | 1.0 | 1.0 | 600 | $1,945 | $3.24 | 0d | 1 | 0.93mi |
| 720 E Gulf Blvd Unit B Indian Rocks Beach, FL | 2.0 | 1.0 | 748 | $2,600 | $3.48 | 22d | 1 | 0.95mi |
| 12760 Indian Rocks Rd Largo, FL | 1.0–2.0 | 1.0–2.0 | 923 | $2,500 | $2.71 | 0d | 5 | 1.20mi |
HOA detail
- Monthly dues
- $140 · $1,680/yr
- Likely covers
- water
Listing history 14 events
-
2026-06-09days on market $149,900 Active 308 DOM
-
2026-06-08days on market $149,900 Active 307 DOM
-
2026-06-07days on market $149,900 Active 306 DOM
-
2026-06-04days on market $149,900 Active 303 DOM
-
2026-06-03days on market $149,900 Active 302 DOM
-
2026-06-01days on market $149,900 Active 300 DOM
-
2026-05-31days on market $149,900 Active 299 DOM
-
2026-05-05price $149,900
-
2025-09-09price $169,000
-
2025-08-05$179,900 Active
-
2010-05-21soldstatus $57,000 162-char remark
Show marketing remark (162 chars)
This is a great opportunity to purchase a mobile home in an intracoastal community. This is a must see. Totally furnished. Waterfront park with 2 community docks.
-
2010-05-21soldstatus $57,000
Show marketing remark (162 chars)
This is a great opportunity to purchase a mobile home in an intracoastal community. This is a must see. Totally furnished. Waterfront park with 2 community docks.
-
2010-02-24$62,500 162-char remark
Show marketing remark (162 chars)
This is a great opportunity to purchase a mobile home in an intracoastal community. This is a must see. Totally furnished. Waterfront park with 2 community docks.
-
1993-12-30soldstatus $18,700
ⓘ Source: listings_history table (triggers on properties + properties_extension) + one-shot
backfill from property_details.listing_events for pre-trigger history.
Tax reassessment forecast FL · Resets to sale price
- Current annual tax
- $2,655 · $221/mo
- Projected year-2 tax
- $2,655 · $221/mo
- Expected delta
- $0/yr ($0/mo · 0.0%)
ⓘ Screening estimate from a state-policy table — verify with the county assessor before closing.
Climate risk First Street
- Flood 10/10 Extreme FEMA zone AE · 99% chance over 30 yrs
- Wildfire 1/10 Low
- Heat 10/10 Extreme 7 d/yr ≥107°F today · 24 d/yr by 30 yrs out
- Wind 10/10 Extreme 99% chance of damaging wind over 30 yrs
- Air quality 3/10 Moderate 2 unhealthy d/yr today · 3 by 30 yrs out
Nearby sold comps map
Loading sold comps map…
Walkable amenities ~0.75 mi
Loading nearby amenities…
Taxation est. · year 1
- Rental income
- $20,747
- − Mortgage interest
- −$8,397
- − Property taxes
- −$2,655
- − Insurance
- −$5,868
- − Repairs & maintenance
- −$1,660
- − Management
- −$1,660
- − HOA
- −$1,680
- − Depreciation
- −$4,361
- Taxable loss
- −$5,533
- Est. tax savings @ 24.0%
- +$1,328
- After-tax cash flow
- $-1,918/yr
For passive investors: Depreciation is non-cash, so a rental often shows a tax loss while cash-flowing — sheltering income. Rental losses are passive: they offset passive income freely, and up to $25,000/yr can offset ordinary (W-2) income if you actively participate and your MAGI is under $100k (phasing out to $0 by $150k); unused losses carry forward. On sale, claimed depreciation is recaptured at up to 25%, and gains may owe capital-gains tax (a 1031 exchange can defer both). Figures are a year-1 estimate at your 24.0% rate — not tax advice; consult a CPA.
Schools (NCES district)
- District
- Pinellas
- NCES district ID
- 1201560
- Math proficiency
- 51% ▼ -5.00%
- Reading proficiency
- 51% ▼ -3.00%
- Median HH income
- $46,270
- Composite
- 43.27/100
- National rank
- #3046
- State rank
- #31 of 73 in FL
Livability — Largo
- Score
- 82/100
- State rank
- #82
- US rank
- #1240
Category grades
Schools grade is shown separately in the Schools card above.
Census & demographics
- County
- Pinellas County · 939,478 people
- City population
- 106,311
- Metro
- Tampa-St. Petersburg-Clearwater, FL
- Population (ZIP)
- 19,799
- Household income
- $79,139
- Rent vs Own
- Severe rent burden
- 546.0
Population outlook (Pinellas County) Hauer SSP2
- Today (2025)
- 1,027,532 people
- By 2030
- 1,063,586 · +3.5%
- By 2040
- 1,125,020 · +9.5%
- By 2050
- 1,168,637 · +13.7%
- By 2075
- 1,265,188 · +23.1%
- By 2100
- 1,260,357 · +22.7%
Race, ethnicity, and origin ACS 2023
- Neighborhood character
- Predominantly White (74%)
- Race & ethnicity
- White 74% Black 11% Hispanic / Latino 9% Two or more races 7%
- Hispanic origin (detail)
- Mexican 2% Puerto Rican 3% Cuban 2%
- Common ancestry
- Romanian 7% Lithuanian 4% Hispanic 2%
- Foreign-born
- 8% · Canada
- Languages at home
- 91% English-only · Spanish 4% French/Haitian/Cajun 2% Russian/Polish/Slavic 1%
Political lean MEDSL · Pinellas
- 2024 margin
- Lean R (+5.2) · D 46.9% · R 52.1%
- 2008→2024 swing
- -13.5pp toward R · 2008: 8.3pp · 2024: -5.2pp
- All cycles
- 2024: R+5.2 2020: D+0.2 2016: R+1.1 2012: D+5.6 2008: D+8.3
Not yet ingested
- Civics
- —
Market trends
- HPI YoY
- ▼ -383.61%
- Current HPI
- 336.629
- Rent YoY
- ▲ 2.01%
- Metro
- Tampa-St. Petersburg-Clearwater, FL
- State GDP YoY
- ▲ 3.28%
- F500 in state
- 36
Industry mix (Fortune 500 HQ in FL)
| Industry | F500 HQs | Revenue |
|---|---|---|
| Industrial Technology | 2 | $29B |
|
||
| Insurance | 2 | $17B |
|
||
| Retail | 1 | $60B |
|
||
| Technology Distribution | 1 | $58B |
|
||
| Homebuilding | 1 | $35B |
|
||
| Technology Manufacturing | 1 | $35B |
|
||
Price history
+701.6% since first listed7 events — show timeline
- 2026-05-05 Price Changed $149,900 Stellar MLS as Distributed by MLS Grid
- 2025-09-09 Price Changed $169,000 Stellar MLS as Distributed by MLS Grid
- 2025-08-05 Listed $179,900 Stellar MLS as Distributed by MLS Grid
- 2010-05-21 Sold (Public Records) $57,000 Public Records
- 2010-05-21 Sold (MLS) $57,000 Stellar MLS as Distributed by MLS Grid
- 2010-02-24 Listed $62,500 Stellar MLS as Distributed by MLS Grid
- 1993-12-30 Sold (Public Records) $18,700 Public Records
Property tax history
+10.6%/yrLatest (2025): $2,655 · +7.4% YoY. Source: county tax records.
Cash-flow waterfall
monthlySold comps — $/sqft
last 12 mo · ≤1 miLoading sold comps…