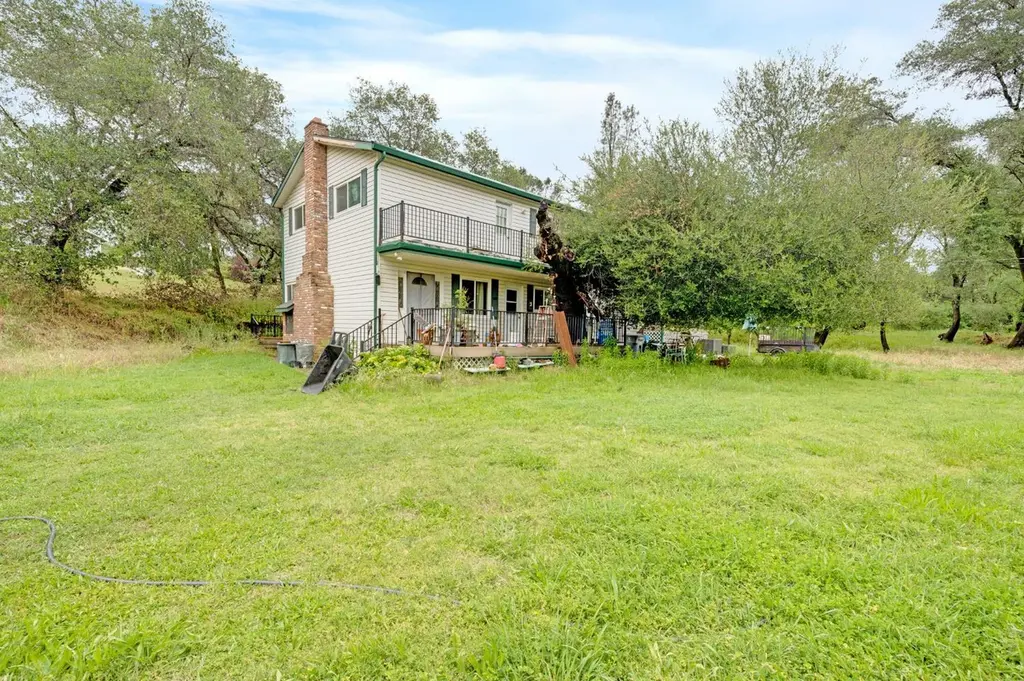
5560 Virginiatown Rd · Penryn, CA
Flood risk 7/10 · Major
- FEMA flood zone
- X (unshaded)
- Chance of flooding over 30 yrs
- 0.77%
- Est. flood insurance / yr
- $507 – $1,088
Fire risk 10/10 · Severe
- Est. fire insurance / yr
- $659 – $1,223
Heat risk 7/10 · Major
- Hot days now (above 102°F)
- 7 days/yr
- Hot days in 30 yrs
- 16 days/yr
Wind risk 1/10 · Minimal
- Chance of severe wind over 30 yrs
- —
Air-quality risk 10/10 · Severe
- Unhealthy air days now
- 31 days/yr
- Unhealthy air days in 30 yrs
- 35 days/yr
Risk factors via First Street. Map © Google.
Why this score? — see what drove the D- grade
The composite is a weighted blend of 9 inputs, each scored 0–100. Each bar is that input's sub-score; the figure is the points it added to the 100-point composite (weight × sub-score).
- Cash flow +11.2/30.0
- ARV discount +7.5/15.0
- Schools +4.3/10.0
- DSCR +3.3/10.0
- Livability +2.8/5.0
- Rent growth +2.5/5.0
- Condition / age +2.5/5.0
- 1% rule +2.0/10.0
- Appreciation +0.0/10.0
$427,500
🖨 Deal sheet (PDF) 📄 Offer letter ✓ Due diligence
Listing remarks
Semi-private setting on nearly half an acre, nestled among a beautiful country backdrop. This inviting home features dual-pane windows throughout and a desirable layout that's ideal for both everyday living and entertaining. The spacious design includes a versatile fifth room that can serve as an additional bedroom, office, or flex space to suit your needs. Enjoy peaceful evenings from the balcony off the master bedroom or relax around the cozy fireplace. The expansive lot offers potential for a pool and outdoor living enhancements. A wonderful family home located in a highly desirable area, known for its quiet surroundings and tranquil nights that the current owners truly appreciate.
Key facts
- Expansive lot
- Dual-pane windows
- Versatile fifth room
Tags
Property features AI
Finance
- HOA & community: No homeowners association; Not a senior community
Exterior
- Parking: No garage; Gravel, unpaved driveway and sidewalks
- Security: Smoke detector; Carbon monoxide detector; Double-strapped water heater
- Utilities: Solar; Septic system (engineered septic, septic connected); 220 volts in kitchen and laundry; 3-phase electric
- Home design: Single family residence (residential property); Faces north; Original condition; Three or more levels; 2 stories
- Construction: Composition roof
- Exterior features: Covered deck; Balcony; Storage shed(s) on property; Regular-shaped lot
Interior
- Kitchen: Electric cooktop; Built-in electric oven; Microwave; Hood over range; Disposal; Dishwasher; Ice maker; Tile and ceramic counters
- Bedrooms: 4 bedrooms total; Master bedroom with closet, balcony and outside access
- Flooring: Wood; Tile; Laminate; Simulated wood; Carpet
- Bathrooms: 3 full bathrooms; Master bath with window, double sinks and shower stall; Other baths with quartz and tile finishes, tub with shower over, windows and double sinks
- Heating & cooling: Central heating; Fireplace heating option; Central cooling; Window and wall units; Ceiling fans
- Interior features: One wood-burning stone fireplace in the living room; Windows and insulation with energy-efficient features; Smoke detector and carbon monoxide detector; Double-strapped water heater; Possible guest room and office included among room types; Dining/living combo and dining bar
- Laundry & utility: Laundry inside (washer and dryer included) with cabinets; 220 volts available in laundry
Neighborhood map
What this means for you Summary
Snapshot
- This is a 4-bed/2.0-bath single-family listed at $428k.
Deal economics
- At list price, monthly cash flow is $-227 ($-3k/yr) — negative.
- To cash-flow at today's rent, offer at most $387k (9.4% below list).
- To meet the 1% rule (rent ≥ 1% of price), the offer needs to be $299k (30.0% below list).
- Recommended offer: $299k (30.0% below list) — sets the bar for 1% rule.
- Cap rate 5.8% vs local median 0.6% in Penryn — top-decile yield for the area; either an underpriced asset or a hidden risk that comps aren't pricing in. Stress-test before assuming the spread holds.
Location & tenants
- Location reads 55/100 on livability (#868 in CA) — a working-class tenant base; expect higher turnover. Strengths: employment A+, housing B; Watch: amenities F, commute F, cost of living F.
- Western Placer Unified (suburban): math 39% / reading 56% proficiency, ranked #148 of 517 in CA (top 29%) — families likely to look elsewhere, expect single-tenant / working-renter base with shorter leases.
- Zoned schools: Carlin C. Coppin Elementary (math 38% / reading 49%, grade F, #539 of 1,571 statewide, top 35%, 396 students, 45% FRL); Glen Edwards Middle (math 29% / reading 46%, grade F, #166 of 498 statewide, top 34%, 770 students, 42% FRL); Lincoln High (math 28% / reading 67%, grade D, #384 of 1,170 statewide, top 33%, 1,355 students, 33% FRL).
- Market conditions: 56 active listings in the ZIP; 3,535 units permitted in Placer County in 2024 (689 in 5+ unit buildings).
Forward outlook
- Local home prices are declining (-3.0%/yr); year-one equity from $3k of loan paydown is wiped out by about $13k of value loss. Plan a longer hold.
- Placer County population projected at +20% by 2050 — long-run rental-demand tailwind backs the buy-and-hold thesis.
Negotiation context
- Only 10 days on market — expect competitive offers; lowballing is unlikely to land.
Risks & watch-outs
- Watch-outs: flood insurance adds $66/mo.
- Climate carrying-cost: major flood risk; severe wildfire risk; extreme-heat days projected 7→16/yr by 2055 (HVAC capex compounding) — expect insurance premiums to compound above CPI over the hold.
Questions for the listing agent
- What do current leases actually rent for vs. the listed asking? Can we see a recent rent roll and the last 12 months of T-12 income?
- Built in 1960 — when were the roof, HVAC, electrical panel, plumbing, and water heater last replaced?
- What's the actual annual flood-insurance premium (NFIP or private), and is the property in a SFHA with mandatory coverage?
- Is there a deadline driving the sale (1031 exchange, divorce, estate, relocation)? That informs how much negotiation room exists.
- Schools are A-rated — typically a magnet for longer-tenancy family renters. What's the average tenant stay here, and is there a school-zone premium baked into asking?
- The area grade is low — what's the realistic commute time and amenity access for the typical tenant pool here? Any planned neighborhood developments (good or bad) we should know about?
- What's the average days-on-market for RENTAL listings here right now (not sales)? A rising rental-DOM trend means longer vacancies and softer asking-rent achievability than the comps imply.
- What's the recent tenant-quality profile in this submarket — average credit score on applications, eviction rate, late-payment / NSF rate, and stable-employment percentage? A property-management company in the area should have these aggregated.
- How much new for-sale + rental construction is in the pipeline within 1–3 miles? Heavy new supply typically softens prices + rents 12–24 months out; constrained supply supports both.
Investment metrics
- 1% rule
- 0.70% ✗
- Cap rate
- 5.84%
- Cash-on-cash
- -1.61%
- DSCR
- 0.93
- GRM
- 11.9
CMA / ARV
- ARV (median comp)
- $1,041,704
- List price
- $427,500
- Delta
- -58.96%
- Verdict
- UNDERPRICED
- Comps
- 9 within 1.0 mi
Show comp detail 2 sales within ~0.75 mi
| Address | Dist | Beds/Ba | Sqft | Sold | Price | $/sf | Match |
|---|---|---|---|---|---|---|---|
| 5855 Virginiatown Rd | 0.29mi | 3/2.0 (-1) | 2,482 (+10%) | 17mo | $910,000 | $367 | 51 |
| 785 Stonewood Rd | 0.40mi | 3/2.0 (-1) | 2,389 (+6%) | 23mo | $1,050,000 | $440 | 47 |
Match score weights: distance 35% · size 25% · config 20% · recency 20%. Top-matched comps best support the ARV.
Projected returns pro-forma
-3.0% appreciation · 3.0% rent growth · sell at horizon
- IRR
- -20.1%
- Equity multiple
- 0.30×
- Total profit
- $-83,934
- Equity at exit
- $63,742
- IRR
- -13.3%
- Equity multiple
- 0.23×
- Total profit
- $-92,462
- Equity at exit
- $36,962
Cash invested: $119,700 (down + closing). Projections, not guarantees.
Landlord ↔ Tenant lean methodology
- Overall (STATE)
- 18 Strongly Tenant-Friendly
- State California
- 18 Strongly Tenant-Friendly · D+13
- County
- — inherits STATE
- City
- — inherits STATE
ZIP-level market 95658
- Active inventory
- 56
- Price-to-rent
- 11.9×
Monthly cashflow live
- Estimated rent
- $2,991 medium interval (Pro) →
- Mortgage (P&I)
- −$2,242
- Tax from tax record
- −$104 /mo · $1,247/yr
- Insurance
- −$178
- Flood insurance flood zone
- −$66 /mo · $798/yr
- HOA
- −$0
- Vacancy / Maint / Mgmt
- −$628
- Net cashflow
- $-227
Break-even live
Sensitivity live
| Price | -10% $15 | -5% $-106 | +0% $-227 | +5% $-348 | +10% $-469 |
|---|---|---|---|---|---|
| Rent | -10% $-464 | -5% $-346 | +0% $-227 | +5% $-109 | +10% $9 |
| Rate | -1.0pp $-12 | -0.5pp $-119 | base $-227 | +0.5pp $-338 | +1.0pp $-451 |
UW: 25.0% down · 7.5% · 30yr · 1.5% tax · 5.0% vac · 8.0% maint · 8.0% mgmt
Financing live
Cash to close
- Down payment
- $106,875
- Closing costs
- $12,825
- Reserves months
- —
- Total cash needed
- —
Loan-product check · same deal, 3 products live
Conventional
25% down · 7.5% · 30yr
- Down + closing
- —
- Monthly P&I
- —
- Monthly cashflow
- —
- DSCR
- —
- Eligible?
- —
Personal DTI + credit; lowest rate.
DSCR
20% down · 8.5% · 30yr
- Down + closing
- —
- Monthly P&I
- —
- Monthly cashflow
- —
- DSCR
- —
- Eligible?
- —
No personal income docs; deal must DSCR.
Hard money
10% down · 12.0% · 12mo
- Down + closing
- —
- Monthly P&I
- —
- Monthly cashflow
- —
- DSCR
- —
- Eligible?
- —
Short-term bridge; refi at stabilization.
Listing history 2 events
-
2026-05-04status Pending 693-char remark
-
2026-04-24$427,500 Active 693-char remark
ⓘ Source: listings_history table (triggers on properties + properties_extension) + one-shot
backfill from property_details.listing_events for pre-trigger history.
Tax reassessment forecast CA · Resets to sale price
- Current annual tax
- $1,247 · $104/mo
- Projected year-2 tax
- $3,249 · $271/mo
- Expected delta
- +$2,002/yr (+$167/mo · 160.6%)
ⓘ Screening estimate from a state-policy table — verify with the county assessor before closing.
Climate risk First Street
- Flood 7/10 Severe FEMA zone X (unshaded) · 77% chance over 30 yrs
- Wildfire 10/10 Extreme
- Heat 7/10 Severe 7 d/yr ≥102°F today · 16 d/yr by 30 yrs out
- Wind 1/10 Low
- Air quality 10/10 Extreme 31 unhealthy d/yr today · 35 by 30 yrs out
Nearby sold comps map
Loading sold comps map…
Walkable amenities ~0.75 mi
Loading nearby amenities…
Taxation est. · year 1
- Rental income
- $35,893
- − Mortgage interest
- −$23,947
- − Property taxes
- −$1,247
- − Insurance
- −$2,935
- − Repairs & maintenance
- −$2,871
- − Management
- −$2,871
- − Depreciation
- −$12,436
- Taxable loss
- −$10,415
- Est. tax savings @ 24.0%
- +$2,500
- After-tax cash flow
- $-229/yr
For passive investors: Depreciation is non-cash, so a rental often shows a tax loss while cash-flowing — sheltering income. Rental losses are passive: they offset passive income freely, and up to $25,000/yr can offset ordinary (W-2) income if you actively participate and your MAGI is under $100k (phasing out to $0 by $150k); unused losses carry forward. On sale, claimed depreciation is recaptured at up to 25%, and gains may owe capital-gains tax (a 1031 exchange can defer both). Figures are a year-1 estimate at your 24.0% rate — not tax advice; consult a CPA.
Schools (NCES district)
- District
- Western Placer Unified
- NCES district ID
- 0642140
- Math proficiency
- 39% ▼ -12.00%
- Reading proficiency
- 56% ▼ -5.00%
- Median HH income
- $73,025
- Composite
- 42.84/100
- National rank
- #3130
- State rank
- #148 of 517 in CA
Livability — Penryn
- Score
- 55/100
- State rank
- #868
- US rank
- #23617
Category grades
Schools grade is shown separately in the Schools card above.
Census & demographics
- Population (ZIP)
- 6,197
Population outlook (Placer County) Hauer SSP2
- Today (2025)
- 422,709 people
- By 2030
- 444,249 · +5.1%
- By 2040
- 480,192 · +13.6%
- By 2050
- 506,390 · +19.8%
- By 2075
- 550,219 · +30.2%
- By 2100
- 547,760 · +29.6%
Race, ethnicity, and origin ACS 2023
- Neighborhood character
- Predominantly White (80%)
- Race & ethnicity
- White 80% Hispanic / Latino 9% Two or more races 7% Black 3% Native American 2% Asian 1%
- Hispanic origin (detail)
- Mexican 8%
- Common ancestry
- Italian 5% Slovak 4% Russian 3%
- Foreign-born
- 4% · Canada
- Languages at home
- 93% English-only · German/W. Germanic 2% Spanish 1% Other Asian/Pacific 1%
Political lean MEDSL · Placer
- 2024 margin
- Lean R (+8.5) · D 44.3% · R 52.8% · Other 2.9%
- 2008→2024 swing
- +2.8pp toward D · 2008: -11.3pp · 2024: -8.5pp
- All cycles
- 2024: R+8.5 2020: R+6.7 2016: R+11.3 2012: R+20.1 2008: R+11.3
Not yet ingested
- Civics
- —
Market trends
- HPI YoY
- ▼ -292.40%
- Current HPI
- 288.3247
- Rent YoY
- —
- Metro
- —
- State GDP YoY
- ▲ 3.21%
- F500 in state
- 116
Industry mix (Fortune 500 HQ in CA)
| Industry | F500 HQs | Revenue |
|---|---|---|
| Technology | 27 | $1,492B |
|
||
| Financial Services | 3 | $174B |
|
||
| Retail | 3 | $44B |
|
||
| Insurance | 3 | $26B |
|
||
| Media / Entertainment | 2 | $115B |
|
||
| Pharmaceuticals / Biotech | 2 | $62B |
|
||
Price history
2 events — show timeline
- 2026-05-04 Pending — BAREIS
- 2026-04-24 Listed $427,500 BAREIS
Property tax history
+1.5%/yrLatest (2025): $1,247 · +1.3% YoY. Source: county tax records.
Cash-flow waterfall
monthlySold comps — $/sqft
last 12 mo · ≤1 miLoading sold comps…