 Multi-family
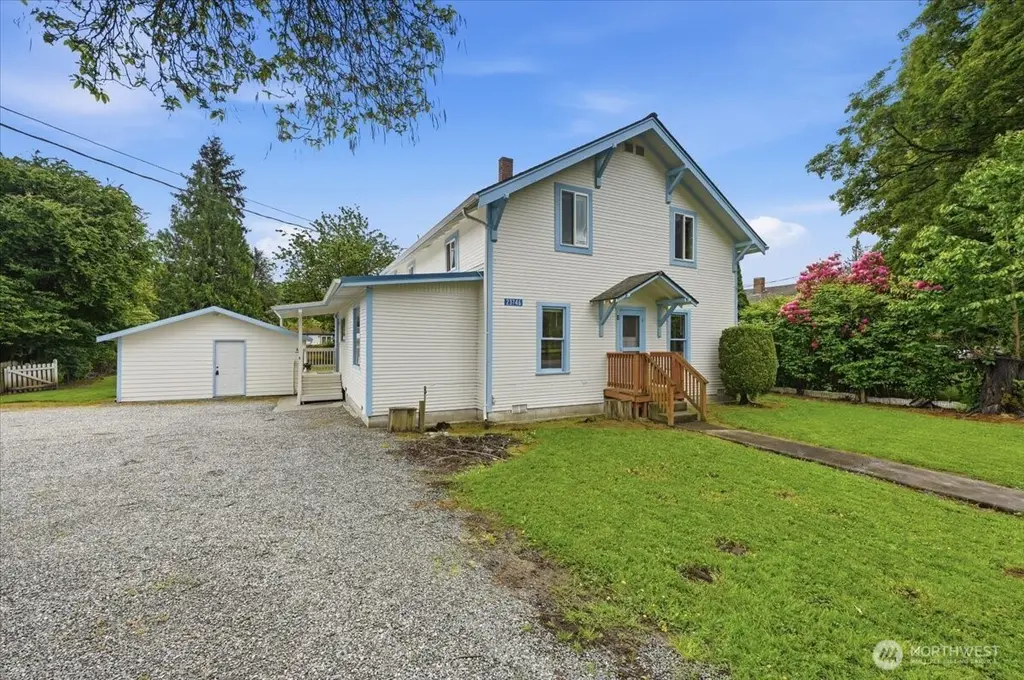
23746 Old Day Creek Road Rd Unit A & B · Clear Lake, WA
Flood risk 6/10 · Moderate
- FEMA flood zone
- AE
- Chance of flooding over 30 yrs
- 0.72%
- Est. flood insurance / yr
- $2,026 – $9,024
Fire risk 3/10 · Minor
- Est. fire insurance / yr
- $604 – $1,122
Heat risk 2/10 · Minimal
- Hot days now (above 83°F)
- 7 days/yr
- Hot days in 30 yrs
- 18 days/yr
Wind risk 1/10 · Minimal
- Chance of severe wind over 30 yrs
- —
Air-quality risk 6/10 · Moderate
- Unhealthy air days now
- 9 days/yr
- Unhealthy air days in 30 yrs
- 10 days/yr
Risk factors via First Street. Map © Google.
Why this score? — see what drove the D+ grade
The composite is a weighted blend of 9 inputs, each scored 0–100. Each bar is that input's sub-score; the figure is the points it added to the 100-point composite (weight × sub-score).
- Cash flow +11.5/30.0
- Appreciation +10.0/10.0
- ARV discount +7.5/15.0
- Schools +4.7/10.0
- Condition / age +3.8/5.0
- DSCR +3.4/10.0
- 1% rule +3.3/10.0
- Livability +3.1/5.0
- Rent growth +2.5/5.0
$475,000
🖨 Deal sheet (PDF) 📄 Offer letter ✓ Due diligence
Multi-family units
County records classify this as Multi-Family (2-4 Unit). Listing-text estimate: 1 unit. estimate disagrees with records
Listing remarks
Don't miss this great opportunity!! A distinctive offering with two self-contained living spaces, thoughtfully designed to support elevated multi-use living. Each unit provides private access and full independence, creating an ideal setting for extended living, guests, or income-producing potential. Each living space offers 2 bedrooms and a full bath with sunny kitchen and family rooms! This home has been super well managed & taken care of; Upgrades since 2022 incl exterior and interior paint, basement cleaned, roof replaced, new carpet, updated baths, replaced some appliances, septic pumped & inspected 4/2026. There is a shared washer and dryer in the basement as well. A lovel
Key facts
- Upgrades since 2022
- Private access
- 0.25 acre lot
Tags
Property features AI
Finance
- Other: Building name: North Park Clear Lake
- Financial info: Listing terms: Cash, Conventional, FHA; Multi-family totals: 2 units; Multi-family expenses listed (example: insurance expense and total expenses reported)
Exterior
- Parking: Uncovered parking for 4 vehicles; Garage (approximately 432 sq ft)
- Security: Partially fenced property (listed under security features)
- Utilities: Public water (PUD); Power provided by PSE; Septic tank sewer
- Home design: Duplex (residential income / multi-family); 2 stories; Has a view; Built/renovated effectively in 1994
- Construction: Wood construction; Composition and metal roofing; Block foundation
- Exterior features: Wood exterior; Partially fenced yard; Paved site
Interior
- Kitchen: Both units include a range/oven; Both units include a refrigerator; No dishwashers
- Bedrooms: Two 2-bedroom units (Unit A and Unit B); a total of 4 possible bedrooms
- Flooring: Laminate; Carpet
- Bathrooms: Each unit has 1 bathroom
- Heating & cooling: Wall furnace heating; No central cooling
- Interior features: Basement; Storage; Thermal windows; Partially fenced
- Laundry & utility: Electric energy source
Neighborhood map
What this means for you Summary
Snapshot
- This is a 4-bed/2.0-bath multifamily listed at $475k. Condition is rated good.
Deal economics
- At list price, monthly cash flow is $-619 ($-7k/yr) — negative.
- To cash-flow at today's rent, offer at most $385k (18.8% below list).
- To meet the 1% rule (rent ≥ 1% of price), the offer needs to be $396k (16.7% below list).
- Recommended offer: $385k (18.8% below list) — sets the bar for cash-flow.
- Cap rate 5.9% vs local median 1.6% in Clear Lake — top-decile yield for the area; either an underpriced asset or a hidden risk that comps aren't pricing in. Stress-test before assuming the spread holds.
Location & tenants
- Location reads 62/100 on livability (#403 in WA) — a middle-class / working-renter tenant base. Strengths: crime A+, housing B; Watch: health & safety C-, cost of living D+, amenities F.
- Sedro-Woolley School District (suburban): math 47% / reading 58% proficiency, ranked #117 of 291 in WA (top 40%) — acceptable for families but not a draw, mixed tenant base, ~2y average lease.
- Zoned schools: Clear Lake Elementary School (298 students, 44% FRL); Cascade Middle School (697 students, 58% FRL); Sedro Woolley Senior High School (1,276 students, 49% FRL).
- Market conditions: 232 active listings in the ZIP; solid renter incomes; 561 units permitted in Skagit County in 2024 (270 in 5+ unit buildings).
- At $3,955/mo this rent would consume 51% of the median local household income ($93k/yr) (locally 502% of renters already pay >50% of income on rent) — very limited rent-growth headroom before tenants either downsize or default.
Forward outlook
- In year one you build about $51k of equity ($3k loan paydown + $48k appreciation (10.0% local appreciation)).
- Skagit County population projected at +11% by 2050 — modest demand growth; plan on rents tracking national, not racing it.
- By year 2, paydown + projected appreciation supports a ~$82k cash-out refi (75% LTV) — recoverable capital for the next deal without selling this one.
Negotiation context
- Only 12 days on market — expect competitive offers; lowballing is unlikely to land.
Risks & watch-outs
- Watch-outs: flood insurance adds $460/mo; built in 1910 — expect roof / HVAC / electrical / plumbing capex.
- Climate carrying-cost: in FEMA flood zone AE (mandatory federal flood insurance) — expect insurance premiums to compound above CPI over the hold.
Questions for the listing agent
- What do current leases actually rent for vs. the listed asking? Can we see a recent rent roll and the last 12 months of T-12 income?
- Built in 1910 — when were the roof, HVAC, electrical panel, plumbing, and water heater last replaced?
- What's the actual annual flood-insurance premium (NFIP or private), and is the property in a SFHA with mandatory coverage?
- Is there a deadline driving the sale (1031 exchange, divorce, estate, relocation)? That informs how much negotiation room exists.
- Schools are B-rated — typically a magnet for longer-tenancy family renters. What's the average tenant stay here, and is there a school-zone premium baked into asking?
- The area grade is low — what's the realistic commute time and amenity access for the typical tenant pool here? Any planned neighborhood developments (good or bad) we should know about?
- What's the average days-on-market for RENTAL listings here right now (not sales)? A rising rental-DOM trend means longer vacancies and softer asking-rent achievability than the comps imply.
- What's the recent tenant-quality profile in this submarket — average credit score on applications, eviction rate, late-payment / NSF rate, and stable-employment percentage? A property-management company in the area should have these aggregated.
- How much new apartment / multifamily construction is in the pipeline within 1–3 miles? Heavy new supply (>2% of stock underway) typically softens rents 12–24 months out; light construction supports rent growth.
Investment metrics
- 1% rule
- 0.83% ✗
- Cap rate
- 5.89%
- Cash-on-cash
- -1.43%
- DSCR
- 0.94
- GRM
- 10.0
CMA / ARV
No comps found within radius.
Projected returns pro-forma
10.0% appreciation · 3.0% rent growth · sell at horizon
- IRR
- 20.4%
- Equity multiple
- 2.65×
- Total profit
- $219,642
- Equity at exit
- $427,918
- IRR
- 18.6%
- Equity multiple
- 6.10×
- Total profit
- $678,474
- Equity at exit
- $922,821
Cash invested: $133,000 (down + closing). Projections, not guarantees.
Landlord ↔ Tenant lean methodology
- Overall (STATE)
- 28 Tenant-Leaning
- State Washington
- 28 Tenant-Leaning · D+8
- County
- — inherits STATE
- City
- — inherits STATE
ZIP-level market 98284
- Home prices YoY
- 3.5%
- Active inventory
- 232
- Price-to-rent
- 20.0×
Monthly cashflow live
- Estimated rent
- $3,955 medium interval (Pro) →
- Mortgage (P&I)
- −$2,491
- Tax est. 1.5%
- −$594 /mo · $7,125/yr
- Insurance
- −$198
- Flood insurance flood zone
- −$460 /mo · $5,525/yr
- HOA
- −$0
- Vacancy / Maint / Mgmt
- −$831
- Net cashflow
- $-619
Break-even live
Sensitivity live
| Price | -10% $-290 | -5% $-454 | +0% $-619 | +5% $-783 | +10% $-947 |
|---|---|---|---|---|---|
| Rent | -10% $-931 | -5% $-775 | +0% $-619 | +5% $-462 | +10% $-306 |
| Rate | -1.0pp $-379 | -0.5pp $-498 | base $-619 | +0.5pp $-742 | +1.0pp $-867 |
2-unit breakdown (identical units grouped — click to expand)
| Units | Beds | Baths | Est. rent |
|---|---|---|---|
| 2× units | 2 | 1 | $3,954 |
| #1 | 2 | 1 | $1,977 |
| #2 | 2 | 1 | $1,977 |
| Total (2 units) | $3,955 | ||
UW: 25.0% down · 7.5% · 30yr · 1.5% tax · 5.0% vac · 8.0% maint · 8.0% mgmt
Financing live
Cash to close
- Down payment
- $118,750
- Closing costs
- $14,250
- Reserves months
- —
- Total cash needed
- —
Loan-product check · same deal, 3 products live
Conventional
25% down · 7.5% · 30yr
- Down + closing
- —
- Monthly P&I
- —
- Monthly cashflow
- —
- DSCR
- —
- Eligible?
- —
Personal DTI + credit; lowest rate.
DSCR
20% down · 8.5% · 30yr
- Down + closing
- —
- Monthly P&I
- —
- Monthly cashflow
- —
- DSCR
- —
- Eligible?
- —
No personal income docs; deal must DSCR.
Hard money
10% down · 12.0% · 12mo
- Down + closing
- —
- Monthly P&I
- —
- Monthly cashflow
- —
- DSCR
- —
- Eligible?
- —
Short-term bridge; refi at stabilization.
Listing history 6 events
-
2026-06-03status $475,000 Pending 12 DOM
-
2026-06-02days on market $475,000 Active 12 DOM
-
2026-06-01days on market $475,000 Active 11 DOM
-
2026-05-31days on market $475,000 Active 10 DOM
-
2026-05-30days on market $475,000 Active 9 DOM
-
2026-05-21$475,000 Active
ⓘ Source: listings_history table (triggers on properties + properties_extension) + one-shot
backfill from property_details.listing_events for pre-trigger history.
Climate risk First Street
- Flood 6/10 Major FEMA zone AE · 72% chance over 30 yrs
- Wildfire 3/10 Moderate
- Heat 2/10 Low 7 d/yr ≥83°F today · 18 d/yr by 30 yrs out
- Wind 1/10 Low
- Air quality 6/10 Major 9 unhealthy d/yr today · 10 by 30 yrs out
Nearby sold comps map
Loading sold comps map…
Walkable amenities ~0.75 mi
Loading nearby amenities…
Taxation est. · year 1
- Rental income
- $47,460
- − Mortgage interest
- −$26,607
- − Property taxes
- −$7,125
- − Insurance
- −$7,900
- − Repairs & maintenance
- −$3,797
- − Management
- −$3,797
- − Depreciation
- −$13,818
- Taxable loss
- −$15,584
- Est. tax savings @ 24.0%
- +$3,740
- After-tax cash flow
- $-3,683/yr
For passive investors: Depreciation is non-cash, so a rental often shows a tax loss while cash-flowing — sheltering income. Rental losses are passive: they offset passive income freely, and up to $25,000/yr can offset ordinary (W-2) income if you actively participate and your MAGI is under $100k (phasing out to $0 by $150k); unused losses carry forward. On sale, claimed depreciation is recaptured at up to 25%, and gains may owe capital-gains tax (a 1031 exchange can defer both). Figures are a year-1 estimate at your 24.0% rate — not tax advice; consult a CPA.
Condition & rehab AI · 12 photos
This multi-family home offers two self-contained living spaces with fresh paint and new carpet. While the kitchen and bathrooms need updating, the overall condition is good and the home has been well-maintained.
Repairs flagged
- Moderate kitchen cabinets — dated and in need of updating
- Moderate kitchen appliances — outdated and in need of replacement
Value-add opportunities
- Both update kitchen cabinets and appliances — modernizing the kitchen would appeal to both buyers and renters
- Both paint exterior — fresh paint would improve curb appeal and home value
- Both update bathrooms — updated bathrooms would attract more buyers and renters
Renovation cost estimate screening
| Repair item | Severity | Est. cost |
|---|---|---|
| kitchen cabinets · dated and in need of updating | Moderate | $3,000–15,000 |
| kitchen appliances · outdated and in need of replacement | Moderate | $3,000–15,000 |
| Total estimated repair cost · 2 items | $6,000–30,000 |
Value-add ROI direction
- Both update kitchen cabinets and appliances — modernizing the kitchen would appeal to both buyers and renters ↑
- Both paint exterior — fresh paint would improve curb appeal and home value ↑
- Both update bathrooms — updated bathrooms would attract more buyers and renters ↑
ⓘ Cost ranges are severity-bucket heuristics (US national rule-of-thumb). Get contractor quotes + a written scope before underwriting a rehab budget.
Schools (NCES district)
- District
- Sedro-Woolley School District
- NCES district ID
- 5307740
- Math proficiency
- 47% ▼ -2.00%
- Reading proficiency
- 58% ▬ 0.00%
- Median HH income
- $57,385
- Composite
- 47.45/100
- National rank
- #5005
- State rank
- #117 of 291 in WA
Livability — Clear Lake
- Score
- 62/100
- State rank
- #403
- US rank
- #16153
Category grades
Schools grade is shown separately in the Schools card above.
Census & demographics
- Census place
- Clear Lake, WA
- County
- Skagit County · 118,108 people
- Metro
- Mount Vernon-Anacortes, WA
- Population (ZIP)
- 27,835
- Household income
- $93,006
- Rent vs Own
- Severe rent burden
- 502.0
Population outlook (Skagit County) Hauer SSP2
- Today (2025)
- 131,498 people
- By 2030
- 135,556 · +3.1%
- By 2040
- 141,717 · +7.8%
- By 2050
- 145,714 · +10.8%
- By 2075
- 152,201 · +15.7%
- By 2100
- 147,980 · +12.5%
Race, ethnicity, and origin ACS 2023
- Neighborhood character
- Predominantly White (76%)
- Race & ethnicity
- White 76% Hispanic / Latino 14% Two or more races 8% Asian 2% Native American 1%
- Hispanic origin (detail)
- Mexican 12% Puerto Rican 1%
- Common ancestry
- Portuguese 6% Slovak 4% Italian 3%
- Foreign-born
- 5% · Canada, China
- Languages at home
- 88% English-only · Spanish 10% German/W. Germanic 1%
Political lean MEDSL · Skagit
- 2024 margin
- Lean D (+8.9) · D 52.9% · R 44.0% · Other 3.0%
- 2008→2024 swing
- -0.7pp no change · 2008: 9.6pp · 2024: 8.9pp
- All cycles
- 2024: D+8.9 2020: D+7.5 2016: D+3.2 2012: D+5.8 2008: D+9.6
Not yet ingested
- Civics
- —
Market trends
- HPI YoY
- ▲ 43.42%
- Current HPI
- 1280.83
- Rent YoY
- —
- Metro
- Mount Vernon-Anacortes, WA
- State GDP YoY
- ▲ 4.65%
- F500 in state
- 22
Industry mix (Fortune 500 HQ in WA)
| Industry | F500 HQs | Revenue |
|---|---|---|
| Retail | 2 | $269B |
|
||
| Technology / Retail | 1 | $638B |
|
||
| Technology | 1 | $245B |
|
||
| Telecommunications | 1 | $38B |
|
||
| Food / Beverage | 1 | $36B |
|
||
| Automotive / Trucks | 1 | $34B |
|
||
Price history
1 event — show timeline
- 2026-05-21 Listed $475,000 NWMLS as Distributed by MLS Grid
Cash-flow waterfall
monthlySold comps — $/sqft
last 12 mo · ≤1 miLoading sold comps…