 🏗️ New Construction
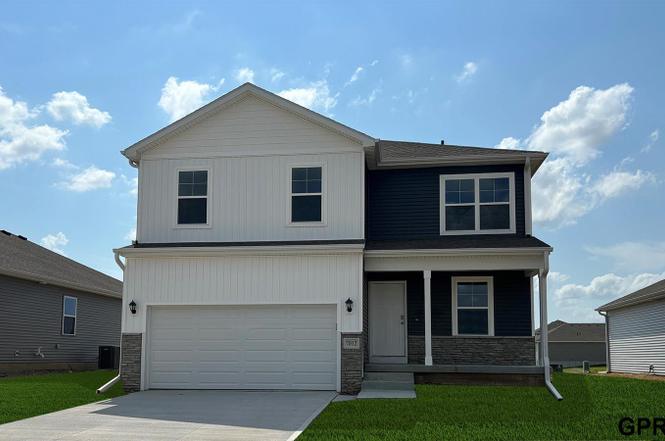
7119 S 205th St · Omaha, NE
Flood risk 1/10 · Minimal
- FEMA flood zone
- X (unshaded)
- Chance of flooding over 30 yrs
- 0.0%
- Est. flood insurance / yr
- $507 – $1,088
Fire risk 1/10 · Minimal
- Est. fire insurance / yr
- $1,161 – $2,155
Heat risk 3/10 · Minor
- Hot days now (above 103°F)
- 6 days/yr
- Hot days in 30 yrs
- 14 days/yr
Wind risk 2/10 · Minimal
- Chance of severe wind over 30 yrs
- —
Air-quality risk 1/10 · Minimal
- Unhealthy air days now
- 0 days/yr
- Unhealthy air days in 30 yrs
- 0 days/yr
Risk factors via First Street. Map © Google.
Why this score? — see what drove the F grade
The composite is a weighted blend of 9 inputs, each scored 0–100. Each bar is that input's sub-score; the figure is the points it added to the 100-point composite (weight × sub-score).
- Cash flow +8.0/30.0
- ARV discount +7.5/15.0
- Schools +5.8/10.0
- Livability +4.2/5.0
- Rent growth +3.0/5.0
- Condition / age +2.5/5.0
- DSCR +2.1/10.0
- 1% rule +1.4/10.0
- Appreciation +0.0/10.0
$338,990
🖨 Deal sheet (PDF) 📄 Offer letter ✓ Due diligence
Listing remarks
!!RED TAG SALE JANUARY 2ND - 25TH!! D. R. Horton, America’s Builder, presents the Bellhaven. This beautiful open concept 2-story home has 4 large Bedrooms & 2.5 Bathrooms. Upon entering the Bellhaven you’ll find a spacious Study perfect for an office space. As you make your way through the Foyer, you’ll find a spacious and cozy Great Room complete with a fireplace. The Gourmet Kitchen with included Quartz countertops is perfect for entertaining with its Oversized Island overlooking the Dining and Living areas. Heading up to the second level, you’ll find the oversized Primary Bedroom featuring an ensuite bathroom and TWO large walk-in closets. The additional 3 B
Key facts
- Open concept
- Gourmet kitchen
- Cozy great room
Tags
Neighborhood map
What this means for you Summary
Snapshot
- This is a 4-bed/2.5-bath single-family listed at $339k.
Deal economics
- At list price, monthly cash flow is $-392 ($-5k/yr) — negative.
- To cash-flow at today's rent, offer at most $321k (5.4% below list).
- To meet the 1% rule (rent ≥ 1% of price), the offer needs to be $249k (26.6% below list).
- Recommended offer: $249k (26.6% below list) — sets the bar for 1% rule.
- Cap rate 5.1% vs local median 3.6% in Omaha — top-decile yield for the area; either an underpriced asset or a hidden risk that comps aren't pricing in. Stress-test before assuming the spread holds.
Location & tenants
- Location reads 84/100 on livability (#7 in NE, #663 nationally) — a professional / high-income tenant draw. Strengths: amenities A+, commute A+, cost of living A+; Watch: crime F.
- Gretna Public Schools (suburban): math 64% / reading 64% proficiency, ranked #6 of 111 in NE (top 5%) — acceptable for families but not a draw, mixed tenant base, ~2y average lease; only 5% free/reduced lunch — higher-income household profile.
- Zoned schools: Gretna Elementary School (math 63% / reading 70%, grade B+, #74 of 502 statewide, top 15%, 463 students, 13% FRL); Gretna Middle School (math 60% / reading 57%, grade B, #21 of 128 statewide, top 17%, 728 students, 14% FRL); Gretna High School (math 63% / reading 64%, grade B-, #37 of 261 statewide, top 14%, 1,729 students, 11% FRL).
- Market conditions: Rents rising (+1.9%/yr); 534 active listings in the ZIP; 4 comparable units currently listed for rent nearby; rentals at typical pace (median 21d on market — plan ~3-4 weeks tenant-placement turnaround); high-income renter base; 1,612 units permitted in Sarpy County in 2024 (364 in 5+ unit buildings).
Forward outlook
- Local home prices are declining (-3.0%/yr); year-one equity from $3k of loan paydown is wiped out by about $12k of value loss. Plan a longer hold.
- Sarpy County population projected at +41% by 2050 — long-run rental-demand tailwind backs the buy-and-hold thesis.
Negotiation context
- It's been on market 120 days — a 9% lower offer ($308k) is reasonable based on typical stale-listing flexibility.
Questions for the listing agent
- What do current leases actually rent for vs. the listed asking? Can we see a recent rent roll and the last 12 months of T-12 income?
- It's been on market 120 days. Have you received any prior offers? Is the seller open to a 27% concession, seller financing, or rate buy-down credit?
- What does the HOA fee cover, when was the last increase, and are there any pending special assessments or reserve-fund shortfalls?
- Why hasn't it sold? Are there any deal-killer items the seller is aware of (foundation, flood, title, zoning, code violations)?
- Is there a deadline driving the sale (1031 exchange, divorce, estate, relocation)? That informs how much negotiation room exists.
- Crime grade is F in this area — have there been break-ins, vandalism, or insurance claims at this property in the last 3 years? What carrier currently insures it and at what premium?
- The area grade is low — what's the realistic commute time and amenity access for the typical tenant pool here? Any planned neighborhood developments (good or bad) we should know about?
- What's the average days-on-market for RENTAL listings here right now (not sales)? A rising rental-DOM trend means longer vacancies and softer asking-rent achievability than the comps imply.
- What's the recent tenant-quality profile in this submarket — average credit score on applications, eviction rate, late-payment / NSF rate, and stable-employment percentage? A property-management company in the area should have these aggregated.
- How much new for-sale + rental construction is in the pipeline within 1–3 miles? Heavy new supply typically softens prices + rents 12–24 months out; constrained supply supports both.
Investment metrics
- 1% rule
- 0.64% ✗
- Cap rate
- 5.09%
- Cash-on-cash
- -4.31%
- DSCR
- 0.81
- GRM
- 13.1
CMA / ARV
- ARV (on-the-fly)
- $390,070
- Comps found
- 12
Show comp detail 12 sales within ~0.75 mi
| Address | Dist | Beds/Ba | Sqft | Sold | Price | $/sf | Match |
|---|---|---|---|---|---|---|---|
| 7119 S 205th St | 0.00mi | 4/2.5 | 2,053 (0%) | 1mo | $374,990 | $183 | 100 |
| 7116 S 205th St | 0.03mi | 4/2.5 | 2,053 (0%) | 1mo | $360,490 | $176 | 97 |
| 7014 S 205th St | 0.06mi | 4/2.5 | 2,053 (0%) | 1mo | $362,000 | $176 | 96 |
| 7011 S 205th St | 0.06mi | 4/2.5 | 2,053 (0%) | 1mo | $359,990 | $175 | 96 |
| 20466 Emiline St | 0.11mi | 4/3.0 | 2,191 (+7%) | 0mo | $392,990 | $179 | 82 |
| 21116 Monroe St | 0.63mi | 3/2.5 (-1) | 2,036 (-1%) | 1mo | $396,000 | $194 | 63 |
| 8020 S 200 St | 0.69mi | 3/2.5 (-1) | 1,986 (-3%) | 2mo | $378,000 | $190 | 56 |
| 21051 Polk St | 0.47mi | 4/3.0 | 2,333 (+14%) | 1mo | $398,000 | $171 | 52 |
| 8012 S 200th St | 0.67mi | 3/2.5 (-1) | 1,880 (-8%) | 2mo | $389,000 | $207 | 48 |
| 6302 S 200 St | 0.59mi | 3/2.5 (-1) | 1,759 (-14%) | 1mo | $450,000 | $256 | 43 |
| 21059 Jefferson St | 0.66mi | 3/3.0 (-1) | 1,761 (-14%) | 2mo | $351,220 | $199 | 37 |
| 21083 Jefferson St | 0.70mi | 3/3.0 (-1) | 1,761 (-14%) | 2mo | $351,030 | $199 | 35 |
Match score weights: distance 35% · size 25% · config 20% · recency 20%. Top-matched comps best support the ARV.
Projected returns pro-forma
-3.0% appreciation · 1.87% rent growth · sell at horizon
- IRR
- -24.7%
- Equity multiple
- 0.17×
- Total profit
- $-91,169
- Equity at exit
- $58,161
- IRR
- -23.7%
- Equity multiple
- -0.13×
- Total profit
- $-123,481
- Equity at exit
- $33,726
Cash invested: $109,220 (down + closing). Projections, not guarantees.
Landlord ↔ Tenant lean methodology
- Overall (STATE)
- 83 Strongly Landlord-Friendly
- State Nebraska
- 83 Strongly Landlord-Friendly · R+13
- County
- — inherits STATE
- City
- — inherits STATE
ZIP-level market 68028
- Home prices YoY
- -31.0%
- Rents YoY
- 1.9%
- Active inventory
- 534
- Price-to-rent
- 11.4×
Monthly cashflow live
- Estimated rent
- $2,487 medium interval (Pro) →
- Mortgage (P&I)
- −$2,046
- Tax from tax record
- −$126 /mo · $1,515/yr
- Insurance
- −$163
- HOA
- −$23
- Vacancy / Maint / Mgmt
- −$522
- Net cashflow
- $-392
Break-even live
Sensitivity live
| Price | -10% $-172 | -5% $-282 | +0% $-392 | +5% $-503 | +10% $-613 |
|---|---|---|---|---|---|
| Rent | -10% $-589 | -5% $-491 | +0% $-392 | +5% $-294 | +10% $-196 |
| Rate | -1.0pp $-196 | -0.5pp $-293 | base $-392 | +0.5pp $-493 | +1.0pp $-596 |
UW: 25.0% down · 7.5% · 30yr · 1.5% tax · 5.0% vac · 8.0% maint · 8.0% mgmt
Financing live
Cash to close
- Down payment
- $97,518
- Closing costs
- $11,702
- Reserves months
- —
- Total cash needed
- —
Loan-product check · same deal, 3 products live
Conventional
25% down · 7.5% · 30yr
- Down + closing
- —
- Monthly P&I
- —
- Monthly cashflow
- —
- DSCR
- —
- Eligible?
- —
Personal DTI + credit; lowest rate.
DSCR
20% down · 8.5% · 30yr
- Down + closing
- —
- Monthly P&I
- —
- Monthly cashflow
- —
- DSCR
- —
- Eligible?
- —
No personal income docs; deal must DSCR.
Hard money
10% down · 12.0% · 12mo
- Down + closing
- —
- Monthly P&I
- —
- Monthly cashflow
- —
- DSCR
- —
- Eligible?
- —
Short-term bridge; refi at stabilization.
Rent comps 4 comps
| Address | Beds | Baths | Sqft | Rent | $/sqft | DOM | Units | Dist |
|---|---|---|---|---|---|---|---|---|
| 20573 Margo St Gretna, NE | 3.0 | 2.5 | 1500 | $2,500 | $1.67 | 21d | 1 | 0.24mi |
| 6108 Coventry Dr Elkhorn, NE | 1.0–3.0 | 1.0–2.5 | 1220 | $2,395 | $1.96 | 3d | 17 | 0.68mi |
| 8121 S 198th Ave Gretna, NE | 3.0 | 3.0 | 1982 | $2,650 | $1.34 | 45d | 1 | 0.86mi |
| 19714 Laci St Omaha, NE | 3.0 | 2.0 | 1600 | $2,200 | $1.38 | 5d | 1 | 0.98mi |
HOA detail
- Monthly dues
- $23 · $276/yr
Listing history 9 events
-
2026-01-16status Pending
-
2026-01-15price $338,990
-
2026-01-02price $341,990
-
2025-12-20price $346,990
-
2025-12-12price $348,990
-
2025-11-10price $349,990
-
2025-10-27price $355,990
-
2025-10-16price $365,990
-
2025-09-18$381,990 New
ⓘ Source: listings_history table (triggers on properties + properties_extension) + one-shot
backfill from property_details.listing_events for pre-trigger history.
Tax reassessment forecast NE · Resets to sale price
- Current annual tax
- $1,515 · $126/mo
- Projected year-2 tax
- $5,865 · $489/mo
- Expected delta
- +$4,349/yr (+$362/mo · 287.0%)
ⓘ Screening estimate from a state-policy table — verify with the county assessor before closing.
Climate risk First Street
- Flood 1/10 Low FEMA zone X (unshaded) · 0% chance over 30 yrs
- Wildfire 1/10 Low
- Heat 3/10 Moderate 6 d/yr ≥103°F today · 14 d/yr by 30 yrs out
- Wind 2/10 Low
- Air quality 1/10 Low 0 unhealthy d/yr today · 0 by 30 yrs out
Nearby sold comps map
Loading sold comps map…
Walkable amenities ~0.75 mi
Loading nearby amenities…
Taxation est. · year 1
- Rental income
- $29,847
- − Mortgage interest
- −$21,850
- − Property taxes
- −$1,515
- − Insurance
- −$1,950
- − Repairs & maintenance
- −$2,388
- − Management
- −$2,388
- − HOA
- −$276
- − Depreciation
- −$11,347
- Taxable loss
- −$11,867
- Est. tax savings @ 24.0%
- +$2,848
- After-tax cash flow
- $-1,861/yr
For passive investors: Depreciation is non-cash, so a rental often shows a tax loss while cash-flowing — sheltering income. Rental losses are passive: they offset passive income freely, and up to $25,000/yr can offset ordinary (W-2) income if you actively participate and your MAGI is under $100k (phasing out to $0 by $150k); unused losses carry forward. On sale, claimed depreciation is recaptured at up to 25%, and gains may owe capital-gains tax (a 1031 exchange can defer both). Figures are a year-1 estimate at your 24.0% rate — not tax advice; consult a CPA.
Schools (NCES district)
- District
- Gretna Public Schools
- NCES district ID
- 3171220
- Math proficiency
- 64% ▼ -10.00%
- Reading proficiency
- 64% ▼ -4.00%
- Median HH income
- $89,845
- Composite
- 58.21/100
- National rank
- #1023
- State rank
- #6 of 111 in NE
Livability — Omaha
- Score
- 84/100
- State rank
- #7
- US rank
- #663
Category grades
Schools grade is shown separately in the Schools card above.
Census & demographics
- County
- Sarpy County · 161,202 people
- City population
- 552,986
- Metro
- Omaha-Council Bluffs, NE-IA
- Population (ZIP)
- 17,529
- Household income
- $143,604
- Rent vs Own
- Severe rent burden
- 339.0
Population outlook (Sarpy County) Hauer SSP2
- Today (2025)
- 211,769 people
- By 2030
- 229,365 · +8.3%
- By 2040
- 264,122 · +24.7%
- By 2050
- 298,087 · +40.8%
- By 2075
- 381,667 · +80.2%
- By 2100
- 448,180 · +111.6%
Race, ethnicity, and origin ACS 2023
- Neighborhood character
- Predominantly White (93%)
- Race & ethnicity
- White 93% Two or more races 4% Hispanic / Latino 3%
- Common ancestry
- Romanian 4% Iranian 3% Italian 3%
- Foreign-born
- 1% · Canada
- Languages at home
- 98% English-only · Spanish 1%
Political lean MEDSL · Sarpy
- 2024 margin
- R (+11.7) · D 43.5% · R 55.2% · Other 1.3%
- 2008→2024 swing
- +4.2pp toward D · 2008: -15.9pp · 2024: -11.7pp
- All cycles
- 2024: R+11.7 2020: R+11.2 2016: R+21.8 2012: R+23.6 2008: R+15.9
Not yet ingested
- Civics
- —
Market trends
- HPI YoY
- ▼ -108.83%
- Current HPI
- 242.6423
- Rent YoY
- ▲ 1.87%
- Metro
- Omaha-Council Bluffs, NE-IA
- State GDP YoY
- ▲ 0.68%
- F500 in state
- 2
Industry mix (Fortune 500 HQ in NE)
| Industry | F500 HQs | Revenue |
|---|---|---|
| Conglomerate | 1 | $371B |
|
||
Price history
-11.3% since first listed9 events — show timeline
- 2026-01-16 Pending — GPRMLS
- 2026-01-15 Price Changed $338,990 GPRMLS
- 2026-01-02 Price Changed $341,990 GPRMLS
- 2025-12-20 Price Changed $346,990 GPRMLS
- 2025-12-12 Price Changed $348,990 GPRMLS
- 2025-11-10 Price Changed $349,990 GPRMLS
- 2025-10-27 Price Changed $355,990 GPRMLS
- 2025-10-16 Price Changed $365,990 GPRMLS
- 2025-09-18 Listed $381,990 GPRMLS
Property tax history
+179.0%/yrLatest (2025): $1,515 · +68.7% YoY. Source: county tax records.
Cash-flow waterfall
monthlySold comps — $/sqft
last 12 mo · ≤1 miLoading sold comps…