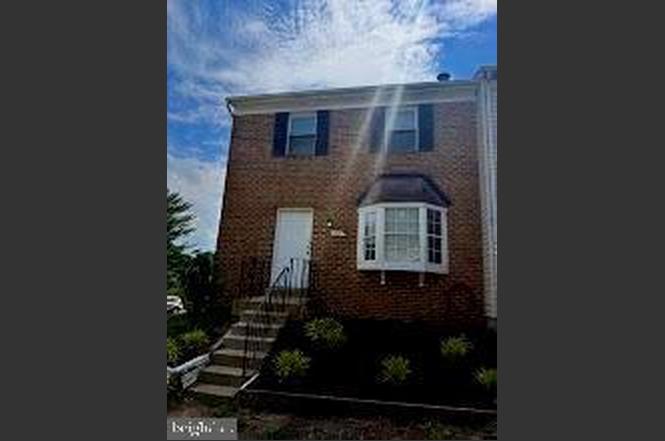
820 Holly Dr · La Plata, MD
Flood risk 1/10 · Minimal
- FEMA flood zone
- X (unshaded)
- Chance of flooding over 30 yrs
- 0.0%
- Est. flood insurance / yr
- $473 – $860
Fire risk 4/10 · Minor
- Est. fire insurance / yr
- $755 – $1,403
Heat risk 8/10 · Major
- Hot days now (above 102°F)
- 7 days/yr
- Hot days in 30 yrs
- 16 days/yr
Wind risk 5/10 · Moderate
- Chance of severe wind over 30 yrs
- 25.0%
Air-quality risk 2/10 · Minimal
- Unhealthy air days now
- 1 days/yr
- Unhealthy air days in 30 yrs
- 1 days/yr
Risk factors via First Street. Map © Google.
Why this score? — see what drove the D+ grade
The composite is a weighted blend of 9 inputs, each scored 0–100. Each bar is that input's sub-score; the figure is the points it added to the 100-point composite (weight × sub-score).
- ARV discount +15.0/15.0
- Cash flow +12.7/30.0
- DSCR +3.8/10.0
- Livability +3.7/5.0
- 1% rule +3.4/10.0
- Rent growth +2.5/5.0
- Condition / age +2.5/5.0
- Schools +2.3/10.0
- Appreciation +0.0/10.0
$315,000
🖨 Deal sheet 📄 Offer letter ✓ Due diligence
Listing remarks MLS
* Standard Sale * No calls to LA. .Active=Available. .showing CSS * Fully renovated, New S S appliances, Granite Tops, New Kitchen , Granite tops. cabinets. New Hardwood Floors Galore. New Doors. Bathrooms Completely Remodeled. Fresh Paint entire house. Fully finished basement. New Tile Floor. Large Deck, and large Fenced Lot. New Carpet. Text and email for best response. DISCLOSURES OFFER DOCS UPLOADED
Key facts
- Breakfast nook
- Updated townhouse
- Spacious kitchen
Tags
Property features AI
Finance
- Other: Above-grade finished area and below-grade finished area reported by assessor; Total below-grade area includes finished and unfinished portions
Exterior
- Parking: On-street parking
- Utilities: Public water; Public sewer; Electric cooling fuel; Natural gas heating and hot water
- Home design: End of row/townhouse; Fee simple ownership
- Construction: Brick and vinyl siding exterior; Permanent foundation
- Exterior features: Finished and unfinished below-grade areas with outside and rear entrances; End unit townhouse; Not on tidal water; In city limits (La Plata); GPS-friendly directions; end unit
Interior
- Bedrooms: Three bedrooms on the first upper level
- Bathrooms: Two full bathrooms (one on first upper level, one on first lower level); One half bathroom on the main level
- Heating & cooling: Forced air heating (natural gas); Central air conditioning (electric); Natural gas hot water
- Interior features: Combination dining and living area; One fireplace (living area)
Neighborhood map
What this means for you Summary
Snapshot
- This is a 3-bed/2.5-bath townhouse listed at $315k.
Deal economics
- At list price, monthly cash flow is $-33 ($-399/yr) — negative.
- To cash-flow at today's rent, offer at most $309k (1.9% below list).
- To meet the 1% rule (rent ≥ 1% of price), the offer needs to be $265k (15.7% below list).
- Recommended offer: $265k (15.7% below list) — sets the bar for 1% rule.
- Cap rate 6.2% vs local median 3.6% in La Plata — top-decile yield for the area; either an underpriced asset or a hidden risk that comps aren't pricing in. Stress-test before assuming the spread holds.
Location & tenants
- Location reads 73/100 on livability (#132 in MD) — a middle-class / working-renter tenant base. Strengths: employment A+, housing A+, commute B; Watch: health & safety C-, amenities F, cost of living F.
- Charles County Public Schools (suburban): math 13% / reading 29% proficiency, ranked #14 of 24 in MD (top 58%) — low school quality limits family demand, transient renter base, plan for 1-2y turnover.
- Zoned schools: La Plata High School (math 51% / reading 74%, grade B-, #62 of 222 statewide, top 29%, 1,222 students, 25% FRL) — zoned schools at 25% FRL track the district average.
- Zoned-school proficiency averages 62% at this address vs 21% district-wide (+42 pts) — the actual schools serving this property are materially stronger than the Charles County Public Schools average implies; a family-tenant draw the district grade alone would hide.
- Market conditions: 213 active listings in the ZIP; 15 comparable units currently listed for rent nearby; rentals lingering (median 44d on market — plan ~5-8 weeks vacancy on turnover, expect pricing pressure); 67% of comp listings sitting > 30 days — soft ceiling on asking rent; 1,542 units permitted in Charles County in 2024 (516 in 5+ unit buildings).
Forward outlook
- Local home prices are declining (-3.0%/yr); year-one equity from $2k of loan paydown is wiped out by about $9k of value loss. Plan a longer hold.
- Charles County population projected at +27% by 2050 — long-run rental-demand tailwind backs the buy-and-hold thesis.
Negotiation context
- Only 4 days on market — expect competitive offers; lowballing is unlikely to land.
- 12 sale attempts since 28y ago; this cycle's ask is 58% above the opening price — seller raised mid-cycle; expect resistance to lowballs.
- Current owner paid $176k; list at $315k implies a 79% gain — meaningful room to come down on a strong offer.
Risks & watch-outs
- Climate carrying-cost: moderate wind risk, 25% chance of damaging wind over 30y; extreme-heat days projected 7→16/yr by 2055 (HVAC capex compounding) — expect insurance premiums to compound above CPI over the hold.
Questions for the listing agent
- What do current leases actually rent for vs. the listed asking? Can we see a recent rent roll and the last 12 months of T-12 income?
- Is there a deadline driving the sale (1031 exchange, divorce, estate, relocation)? That informs how much negotiation room exists.
- The area grade is low — what's the realistic commute time and amenity access for the typical tenant pool here? Any planned neighborhood developments (good or bad) we should know about?
- What's the average days-on-market for RENTAL listings here right now (not sales)? A rising rental-DOM trend means longer vacancies and softer asking-rent achievability than the comps imply.
- What's the recent tenant-quality profile in this submarket — average credit score on applications, eviction rate, late-payment / NSF rate, and stable-employment percentage? A property-management company in the area should have these aggregated.
- How much new for-sale + rental construction is in the pipeline within 1–3 miles? Heavy new supply typically softens prices + rents 12–24 months out; constrained supply supports both.
Investment metrics
- 1% rule
- 0.84% ✗
- Cap rate
- 6.17%
- Cash-on-cash
- -0.45%
- DSCR
- 0.98
- GRM
- 9.9
CMA / ARV
- ARV (on-the-fly)
- $384,345
- Comps found
- 12
Show comp detail 12 sales within ~0.75 mi
| Address | Dist | Beds/Ba | Sqft | Sold | Price | $/sf | Match |
|---|---|---|---|---|---|---|---|
| 837 Laurel Ln | 0.04mi | 3/2.5 | 1,724 (-2%) | 18mo | $285,000 | $165 | 80 |
| 829 Laurel Ln | 0.04mi | 3/1.5 | 1,724 (-2%) | 22mo | $305,000 | $177 | 73 |
| 112 Huckleberry Dr | 0.56mi | 3/2.5 | 1,692 (-4%) | 2mo | $375,000 | $222 | 67 |
| 116 Tall Grass Ln | 0.66mi | 3/3.0 | 1,872 (+7%) | 3mo | $410,000 | $219 | 54 |
| 106 Burning Bush Pl | 0.43mi | 3/2.5 | 1,913 (+9%) | 13mo | $414,000 | $216 | 54 |
| 101 Carols Pl #31 | 0.75mi | 3/3.0 | 1,738 (-1%) | 14mo | $374,999 | $216 | 50 |
| 235 Heather Ct | 0.52mi | 3/2.5 | 1,524 (-13%) | 10mo | $340,000 | $223 | 45 |
| 131 Tall Grass Ln | 0.62mi | 4/3.5 (+1) | 1,836 (+5%) | 12mo | $410,000 | $223 | 44 |
| 302 Edelen Station Pl | 0.64mi | 3/3.5 | 1,938 (+10%) | 6mo | $372,000 | $192 | 44 |
| 600 Edelen Station Pl #7402 | 0.71mi | 3/2.0 | 1,943 (+11%) | 4mo | $382,000 | $197 | 43 |
| 100 Edelen Station Pl #204 | 0.63mi | 2/2.0 (-1) | 1,515 (-14%) | 9mo | $345,000 | $228 | 33 |
| 200 Edelen Station Pl #205 | 0.62mi | 2/2.0 (-1) | 1,525 (-13%) | 21mo | $340,000 | $223 | 25 |
Match score weights: distance 35% · size 25% · config 20% · recency 20%. Top-matched comps best support the ARV.
Projected returns pro-forma
-3.0% appreciation · 3.0% rent growth · sell at horizon
- IRR
- -17.0%
- Equity multiple
- 0.40×
- Total profit
- $-53,149
- Equity at exit
- $46,968
- IRR
- -8.9%
- Equity multiple
- 0.44×
- Total profit
- $-48,960
- Equity at exit
- $27,235
Cash invested: $88,200 (down + closing). Projections, not guarantees.
Landlord ↔ Tenant lean methodology
- Overall (STATE)
- 27 Tenant-Leaning
- State Maryland
- 27 Tenant-Leaning · D+14
- County
- — inherits STATE
- City
- — inherits STATE
ZIP-level market 20646
- Active inventory
- 213
- Price-to-rent
- 9.9×
Monthly cashflow live
- Estimated rent
- $2,654 high interval (Pro) →
- Mortgage (P&I)
- −$1,652
- Tax from tax record
- −$347 /mo · $4,162/yr
- Insurance
- −$131
- HOA
- −$0
- Vacancy / Maint / Mgmt
- −$557
- Net cashflow
- $-33
Break-even live
UW: 25.0% down · 7.5% · 30yr · 1.5% tax · 5.0% vac · 8.0% maint · 8.0% mgmt
Financing live
Cash to close
- Down payment
- $78,750
- Closing costs
- $9,450
- Reserves months
- —
- Total cash needed
- —
Loan-product check · same deal, 3 products live
Conventional
25% down · 7.5% · 30yr
- Down + closing
- —
- Monthly P&I
- —
- Monthly cashflow
- —
- DSCR
- —
- Eligible?
- —
Personal DTI + credit; lowest rate.
DSCR
20% down · 8.5% · 30yr
- Down + closing
- —
- Monthly P&I
- —
- Monthly cashflow
- —
- DSCR
- —
- Eligible?
- —
No personal income docs; deal must DSCR.
Hard money
10% down · 12.0% · 12mo
- Down + closing
- —
- Monthly P&I
- —
- Monthly cashflow
- —
- DSCR
- —
- Eligible?
- —
Short-term bridge; refi at stabilization.
Rent comps 15 comps
| Address | Beds | Baths | Sqft | Rent | $/sqft | DOM | Units | Dist |
|---|---|---|---|---|---|---|---|---|
| 219 Heather Ct La Plata, MD | 2.0 | 2.5 | 1650 | $2,400 | $1.45 | 43d | 1 | 0.54mi |
| 249 Heather Ct La Plata, MD | 2.0 | 2.5 | 1564 | $2,400 | $1.53 | 43d | 1 | 0.57mi |
| 303 Edelen Station Pl La Plata, MD | 4.0 | 3.5 | 2040 | $2,795 | $1.37 | 20d | 1 | 0.65mi |
| 109 Shallow Brook Way La Plata, MD | 4.0 | 2.5 | 2340 | $3,700 | $1.58 | 43d | 1 | 0.73mi |
| 201 Carol's Pl La Plata, MD | 2.0 | 2.0 | 1229 | $1,925 | $1.57 | 3d | 1 | 0.76mi |
| 327 Saint Marys Ave Unit 7K La Plata, MD | 2.0 | 2.0 | 1243 | $2,000 | $1.61 | 43d | 1 | 0.81mi |
| 103 Hibiscus Ct La Plata, MD | 2.0 | 2.5 | 1368 | $2,100 | $1.54 | 24d | 1 | 0.82mi |
| 9642 Charles St La Plata, MD | 3.0 | 1.0 | 1904 | $2,400 | $1.26 | 43d | 1 | 0.82mi |
| 14 Chesapeake St La Plata, MD | 3.0 | 2.5 | 1732 | $3,000 | $1.73 | 43d | 1 | 1.02mi |
| 128 Wood Duck Cir La Plata, MD | 3.0 | 2.5 | 1680 | $2,350 | $1.40 | 3d | 1 | 1.07mi |
| 1200 E Patuxent Dr La Plata, MD | 3.0 | 2.0 | 1962 | $3,500 | $1.78 | 43d | 1 | 1.17mi |
| 1056 Rye Dr La Plata, MD | 4.0 | 3.5 | 2336 | $3,000 | $1.28 | 43d | 1 | 1.24mi |
| 981 Rye Dr La Plata, MD | 3.0 | 3.5 | 2380 | $3,000 | $1.26 | 24d | 1 | 1.28mi |
| 509 Dogwood Ct La Plata, MD | 3.0 | 2.5 | 2268 | $3,700 | $1.63 | 43d | 1 | 1.34mi |
| 124 Madison St La Plata, MD | 2.0 | 2.0 | 1268 | $2,500 | $1.97 | 43d | 1 | 1.36mi |
Listing history 5 events
-
2026-06-18days on market $315,000 Coming Soon 4 DOM
-
2026-06-17days on market $315,000 Coming Soon 3 DOM
-
2026-06-16days on market $315,000 Coming Soon 2 DOM
-
2026-06-15remarks 699-char remark
-
2026-06-15$315,000 Coming Soon 1 DOM
ⓘ Source: listings_history table (triggers on properties + properties_extension) + one-shot
backfill from property_details.listing_events for pre-trigger history.
Tax reassessment forecast MD · Partial reset (capped growth)
- Current annual tax
- $4,162 · $347/mo
- Projected year-2 tax
- $4,162 · $347/mo
- Expected delta
- $0/yr ($0/mo · 0.0%)
ⓘ Screening estimate from a state-policy table — verify with the county assessor before closing.
Climate risk First Street
- Flood 1/10 Low FEMA zone X (unshaded) · 0% chance over 30 yrs
- Wildfire 4/10 Moderate
- Heat 8/10 Severe 7 d/yr ≥102°F today · 16 d/yr by 30 yrs out
- Wind 5/10 Major 25% chance of damaging wind over 30 yrs
- Air quality 2/10 Low 1 unhealthy d/yr today · 1 by 30 yrs out
Nearby sold comps map
Loading sold comps map…
Walkable amenities ~0.75 mi
Loading nearby amenities…
Taxation est. · year 1
- Rental income
- $31,850
- − Mortgage interest
- −$17,645
- − Property taxes
- −$4,162
- − Insurance
- −$1,575
- − Repairs & maintenance
- −$2,548
- − Management
- −$2,548
- − Depreciation
- −$9,164
- Taxable loss
- −$5,792
- Est. tax savings @ 24.0%
- +$1,390
- After-tax cash flow
- $991/yr
For passive investors: Depreciation is non-cash, so a rental often shows a tax loss while cash-flowing — sheltering income. Rental losses are passive: they offset passive income freely, and up to $25,000/yr can offset ordinary (W-2) income if you actively participate and your MAGI is under $100k (phasing out to $0 by $150k); unused losses carry forward. On sale, claimed depreciation is recaptured at up to 25%, and gains may owe capital-gains tax (a 1031 exchange can defer both). Figures are a year-1 estimate at your 24.0% rate — not tax advice; consult a CPA.
Schools (NCES district)
- District
- Charles County Public Schools
- NCES district ID
- 2400270
- Math proficiency
- 13% ▼ -19.00%
- Reading proficiency
- 29% ▼ -13.00%
- Median HH income
- $90,389
- Composite
- 22.54/100
- National rank
- #8087
- State rank
- #14 of 24 in MD
Livability — La Plata
- Score
- 73/100
- State rank
- #132
- US rank
- #5547
Category grades
Schools grade is shown separately in the Schools card above.
Census & demographics
- Census place
- La Plata, MD
- Population (ZIP)
- 21,601
Population outlook (Charles County) Hauer SSP2
- Today (2025)
- 176,616 people
- By 2030
- 186,471 · +5.6%
- By 2040
- 206,472 · +16.9%
- By 2050
- 224,883 · +27.3%
- By 2075
- 272,101 · +54.1%
- By 2100
- 303,564 · +71.9%
Race, ethnicity, and origin ACS 2023
- Neighborhood character
- Diverse neighborhood (Simpson 0.56)
- Race & ethnicity
- White 62% Black 24% Two or more races 8% Hispanic / Latino 4% Asian 3%
- Common ancestry
- Italian 3% Romanian 2% Iranian 2%
- Foreign-born
- 7% · Canada, China
- Languages at home
- 93% English-only · Spanish 2% Other Indo-European 2% Tagalog/Filipino 1%
Political lean MEDSL · Charles
- 2024 margin
- Solid D (+40.7) · D 69.2% · R 28.5% · Other 2.2%
- 2008→2024 swing
- +15.2pp toward D · 2008: 25.5pp · 2024: 40.7pp
- All cycles
- 2024: D+40.7 2020: D+40.9 2016: D+30.2 2012: D+31.3 2008: D+25.5
Not yet ingested
- Civics
- —
Market trends
- HPI YoY
- ▼ -150.48%
- Current HPI
- 238.0634
- Rent YoY
- —
- Metro
- —
- State GDP YoY
- ▲ 2.97%
- F500 in state
- 12
Industry mix (Fortune 500 HQ in MD)
| Industry | F500 HQs | Revenue |
|---|---|---|
| Aerospace / Defense | 1 | $71B |
|
||
| Utilities | 1 | $25B |
|
||
| Hotels | 1 | $24B |
|
||
| Consumer Goods | 1 | $7B |
|
||
| Real Estate | 1 | $6B |
|
||
| Chemicals | 1 | $2B |
|
||
Price history
+350.0% since first listed46 events — show timeline
- 2026-06-14 Coming Soon $315,000 BRIGHT MLS
- 2017-10-27 Sold (Public Records) $176,000 Public Records
- 2017-10-19 Delisted — MRIS
- 2017-10-19 Listing Removed — BRIGHT MLS
- 2017-10-12 Sold (MLS) $176,000 BRIGHT MLS
- 2017-10-12 Sold (MLS) $176,000 MRIS
- 2017-09-08 Pending — MRIS
- 2017-08-25 Price Changed $179,875 MRIS
- 2017-08-18 Price Changed $184,875 MRIS
- 2017-07-17 Relisted — MRIS
- 2017-05-26 Pending — MRIS
- 2017-04-22 Price Changed $189,875 MRIS
- 2017-04-01 Relisted — MRIS
- 2017-03-23 Pending — MRIS
- 2017-02-04 Listed $199,875 MRIS
- 2017-02-04 Listed $179,875 BRIGHT MLS
- 2016-12-17 Delisted — MRIS
- 2016-12-17 Listing Removed — BRIGHT MLS
- 2016-10-23 Listed — MRIS
- 2016-10-23 Listed $199,875 BRIGHT MLS
- 2016-04-13 Listing Removed — BRIGHT MLS
- 2016-04-08 Sold (MLS) $90,169 MRIS
- 2016-04-08 Sold (MLS) $90,169 BRIGHT MLS
- 2016-02-02 Pending — MRIS
- 2016-01-26 Price Changed $92,800 MRIS
- 2016-01-20 Price Changed $97,800 MRIS
- 2015-12-28 Price Changed $102,800 MRIS
- 2015-12-07 Price Changed $107,600 MRIS
- 2015-11-21 Price Changed $112,500 MRIS
- 2015-11-12 Price Changed $121,000 MRIS
- 2015-10-19 Listed $128,260 MRIS
- 2015-10-19 Listed $92,800 BRIGHT MLS
- 2008-05-18 Delisted — MRIS
- 2008-03-23 Listed — MRIS
- 2007-01-21 Delisted — MRIS
- 2006-12-10 Listed — MRIS
- 2005-12-21 Sold (Public Records) $191,500 Public Records
- 2005-12-15 Sold (MLS) $191,500 MRIS
- 2005-10-27 Delisted — MRIS
- 2005-10-24 Listed $200,000 MRIS
- 1998-10-13 Sold (Public Records) $101,400 Public Records
- 1998-09-18 Sold (MLS) $101,400 MRIS
- 1998-06-07 Delisted — MRIS
- 1998-02-24 Listed $101,400 MRIS
- 1995-12-08 Sold (Public Records) $95,000 Public Records
- 1992-03-17 Sold (Public Records) $70,000 Public Records
Property tax history
+3.3%/yrLatest (2025): $4,162 · +15.2% YoY. Source: county tax records.
Cash-flow waterfall
monthlySold comps — $/sqft
last 12 mo · ≤1 miLoading sold comps…