629 N 4th St · Garland, TX
Flood risk 1/10 · Minimal
- FEMA flood zone
- X (unshaded)
- Chance of flooding over 30 yrs
- 0.0%
- Est. flood insurance / yr
- $507 – $1,088
Fire risk 1/10 · Minimal
- Est. fire insurance / yr
- $1,222 – $2,270
Heat risk 7/10 · Major
- Hot days now (above 109°F)
- 7 days/yr
- Hot days in 30 yrs
- 22 days/yr
Wind risk 6/10 · Moderate
- Chance of severe wind over 30 yrs
- 27.0%
Air-quality risk 2/10 · Minimal
- Unhealthy air days now
- 2 days/yr
- Unhealthy air days in 30 yrs
- 2 days/yr
Risk factors via First Street. Map © Google.
Why this score? — see what drove the F grade
The composite is a weighted blend of 9 inputs, each scored 0–100. Each bar is that input's sub-score; the figure is the points it added to the 100-point composite (weight × sub-score).
- Cash flow +6.5/30.0
- Livability +3.7/5.0
- Schools +2.9/10.0
- Rent growth +2.6/5.0
- Condition / age +2.5/5.0
- 1% rule +1.8/10.0
- DSCR +0.8/10.0
- ARV discount +0.0/15.0
- Appreciation +0.0/10.0
$215,000
🖨 Deal sheet 📄 Offer letter ✓ Due diligence
Listing remarks
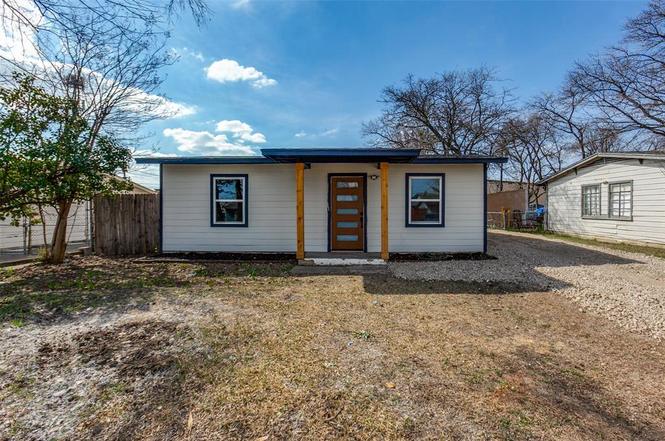
Fully Upgraded & Move-In Ready 3- bedroom, 2-bath home features new flooring, new roof and updated plumbing throughout the house. Conveniently located near I-635 making commuting, shopping, and drinking quick and easy. Comfort, style and location all in one- don't miss out!
Key facts
- New flooring
- New roof
- Conveniently located
Tags
Property features AI
Finance
- HOA & community: No association
Exterior
- Parking: Driveway parking
- Utilities: City water; City sewer; Not in a municipal utility district
- Home design: Single family residence; One-story; Residential property
- Construction: Built in 1955; Siding exterior; Shingle roof
- Exterior features: Covered patio/porch; Wire fencing; Lot under 0.5 acre
Interior
- Kitchen: Dishwasher; Disposal; Gas range; Microwave
- Bedrooms: 3 bedrooms (primary bedroom on main level)
- Flooring: Vinyl flooring
- Bathrooms: 2 full bathrooms
- Heating & cooling: Central heating; Central air conditioning
- Interior features: Kitchen island; Pantry; One living area; One dining area; Room count: 2
- Laundry & utility: Washer hookup
Neighborhood map
What this means for you Summary
Snapshot
- This is a 2-bed/1.0-bath single-family listed at $215k.
Deal economics
- At list price, monthly cash flow is $-359 ($-4k/yr) — negative.
- To cash-flow at today's rent, offer at most $152k (29.5% below list).
- To meet the 1% rule (rent ≥ 1% of price), the offer needs to be $147k (31.6% below list).
- Recommended offer: $147k (31.6% below list) — sets the bar for 1% rule.
- Cap rate 4.3% vs local median 3.5% in Garland — meaningfully above typical; check what's discounted (condition, days-on-market, listing class) to confirm the premium yield is real.
Location & tenants
- Location reads 74/100 on livability (#165 in TX, #4,447 nationally) — a middle-class / working-renter tenant base. Strengths: commute A+, housing A+, cost of living A-; Watch: amenities C-, schools D+, health & safety F.
- Garland ISD (suburban): math 27% / reading 37% proficiency, ranked #553 of 826 in TX (top 67%) — families likely to look elsewhere, expect single-tenant / working-renter base with shorter leases.
- Market conditions: Rents flat; 230 active listings in the ZIP; 12,577 units permitted in Dallas County in 2024 (6,829 in 5+ unit buildings).
Forward outlook
- Local home prices are declining (-3.0%/yr); year-one equity from $1k of loan paydown is wiped out by about $6k of value loss. Plan a longer hold.
- Dallas County population projected at +35% by 2050 — long-run rental-demand tailwind backs the buy-and-hold thesis.
Negotiation context
- It's been on market 56 days — a 3% lower offer ($209k) is reasonable based on typical stale-listing flexibility.
Risks & watch-outs
- Watch-outs: built in 1955 — expect roof / HVAC / electrical / plumbing capex.
- Climate carrying-cost: major wind risk, 27% chance of damaging wind over 30y; extreme-heat days projected 7→22/yr by 2055 (HVAC capex compounding) — expect insurance premiums to compound above CPI over the hold.
Questions for the listing agent
- What do current leases actually rent for vs. the listed asking? Can we see a recent rent roll and the last 12 months of T-12 income?
- It's been on market 56 days. Have you received any prior offers? Is the seller open to a 32% concession, seller financing, or rate buy-down credit?
- Built in 1955 — when were the roof, HVAC, electrical panel, plumbing, and water heater last replaced?
- Is there a deadline driving the sale (1031 exchange, divorce, estate, relocation)? That informs how much negotiation room exists.
- Schools are D-rated, which usually means shorter tenancies and higher turnover. Who's the typical renter profile here, and what's been the actual vacancy rate?
- The area grade is low — what's the realistic commute time and amenity access for the typical tenant pool here? Any planned neighborhood developments (good or bad) we should know about?
- What's the average days-on-market for RENTAL listings here right now (not sales)? A rising rental-DOM trend means longer vacancies and softer asking-rent achievability than the comps imply.
- What's the recent tenant-quality profile in this submarket — average credit score on applications, eviction rate, late-payment / NSF rate, and stable-employment percentage? A property-management company in the area should have these aggregated.
- How much new for-sale + rental construction is in the pipeline within 1–3 miles? Heavy new supply typically softens prices + rents 12–24 months out; constrained supply supports both.
Investment metrics
- 1% rule
- 0.68% ✗
- Cap rate
- 4.29%
- Cash-on-cash
- -7.16%
- DSCR
- 0.68
- GRM
- 12.2
CMA / ARV
- ARV (on-the-fly)
- $173,520
- Comps found
- 7
Show comp detail 7 sales within ~0.75 mi
| Address | Dist | Beds/Ba | Sqft | Sold | Price | $/sf | Match |
|---|---|---|---|---|---|---|---|
| 811 Magnolia Dr | 0.37mi | 2/1.0 | 776 (+8%) | 0mo | $149,900 | $193 | 70 |
| 836 Travis St | 0.47mi | 2/1.0 | 792 (+10%) | 7mo | $198,000 | $250 | 56 |
| 813 Bowie St | 0.48mi | 3/1.0 (+1) | 792 (+10%) | 12mo | $165,000 | $208 | 46 |
| 828 Crockett St | 0.54mi | 2/1.0 | 810 (+12%) | 13mo | $195,000 | $241 | 43 |
| 1233 Nash St | 0.66mi | 2/1.0 | 793 (+10%) | 15mo | $182,000 | $230 | 40 |
| 825 Magnolia Dr | 0.45mi | 2/1.0 | 808 (+12%) | 23mo | $225,000 | $278 | 40 |
| 1213 Nash St | 0.61mi | 2/1.0 | 793 (+10%) | 19mo | $204,999 | $259 | 39 |
Match score weights: distance 35% · size 25% · config 20% · recency 20%. Top-matched comps best support the ARV.
Projected returns pro-forma
-3.0% appreciation · 0.43% rent growth · sell at horizon
- IRR
- -31.7%
- Equity multiple
- -0.02×
- Total profit
- $-61,384
- Equity at exit
- $32,057
- IRR
- -53.8%
- Equity multiple
- -0.61×
- Total profit
- $-97,182
- Equity at exit
- $18,589
Cash invested: $60,200 (down + closing). Projections, not guarantees.
Landlord ↔ Tenant lean methodology
- Overall (STATE)
- 87 Strongly Landlord-Friendly
- State Texas
- 87 Strongly Landlord-Friendly · R+5
- County
- — inherits STATE
- City
- — inherits STATE
ZIP-level market 75040
- Rents YoY
- 0.4%
- Active inventory
- 230
- Price-to-rent
- 12.2×
Monthly cashflow live
- Estimated rent
- $1,470 medium interval (Pro) →
- Mortgage (P&I)
- −$1,127
- Tax from tax record
- −$303 /mo · $3,638/yr
- Insurance
- −$90
- HOA
- −$0
- Vacancy / Maint / Mgmt
- −$309
- Net cashflow
- $-359
Break-even live
UW: 25.0% down · 7.5% · 30yr · 1.5% tax · 5.0% vac · 8.0% maint · 8.0% mgmt
Financing live
Cash to close
- Down payment
- $53,750
- Closing costs
- $6,450
- Reserves months
- —
- Total cash needed
- —
Loan-product check · same deal, 3 products live
Conventional
25% down · 7.5% · 30yr
- Down + closing
- —
- Monthly P&I
- —
- Monthly cashflow
- —
- DSCR
- —
- Eligible?
- —
Personal DTI + credit; lowest rate.
DSCR
20% down · 8.5% · 30yr
- Down + closing
- —
- Monthly P&I
- —
- Monthly cashflow
- —
- DSCR
- —
- Eligible?
- —
No personal income docs; deal must DSCR.
Hard money
10% down · 12.0% · 12mo
- Down + closing
- —
- Monthly P&I
- —
- Monthly cashflow
- —
- DSCR
- —
- Eligible?
- —
Short-term bridge; refi at stabilization.
Listing history 9 events
-
2026-05-01status Pending
-
2026-04-24historical Active Option Contract
-
2026-04-21price $215,000
-
2026-04-11price $235,000
-
2026-03-31price $245,000
-
2026-03-19price $259,900
-
2026-03-06$285,000 Active
-
2025-11-10soldstatus
-
2025-11-10soldstatus
ⓘ Source: listings_history table (triggers on properties + properties_extension) + one-shot
backfill from property_details.listing_events for pre-trigger history.
Tax reassessment forecast TX · Resets to sale price
- Current annual tax
- $3,638 · $303/mo
- Projected year-2 tax
- $3,934 · $328/mo
- Expected delta
- +$297/yr (+$25/mo · 8.2%)
ⓘ Screening estimate from a state-policy table — verify with the county assessor before closing.
Climate risk First Street
- Flood 1/10 Low FEMA zone X (unshaded) · 0% chance over 30 yrs
- Wildfire 1/10 Low
- Heat 7/10 Severe 7 d/yr ≥109°F today · 22 d/yr by 30 yrs out
- Wind 6/10 Major 27% chance of damaging wind over 30 yrs
- Air quality 2/10 Low 2 unhealthy d/yr today · 2 by 30 yrs out
Nearby sold comps map
Loading sold comps map…
Walkable amenities ~0.75 mi
Loading nearby amenities…
Taxation est. · year 1
- Rental income
- $17,634
- − Mortgage interest
- −$12,043
- − Property taxes
- −$3,638
- − Insurance
- −$1,075
- − Repairs & maintenance
- −$1,411
- − Management
- −$1,411
- − Depreciation
- −$6,255
- Taxable loss
- −$8,198
- Est. tax savings @ 24.0%
- +$1,967
- After-tax cash flow
- $-2,344/yr
For passive investors: Depreciation is non-cash, so a rental often shows a tax loss while cash-flowing — sheltering income. Rental losses are passive: they offset passive income freely, and up to $25,000/yr can offset ordinary (W-2) income if you actively participate and your MAGI is under $100k (phasing out to $0 by $150k); unused losses carry forward. On sale, claimed depreciation is recaptured at up to 25%, and gains may owe capital-gains tax (a 1031 exchange can defer both). Figures are a year-1 estimate at your 24.0% rate — not tax advice; consult a CPA.
Schools (NCES district)
- District
- Garland ISD
- NCES district ID
- 4820340
- Math proficiency
- 27% ▼ -23.00%
- Reading proficiency
- 37% ▼ -10.00%
- Median HH income
- $58,392
- Composite
- 28.63/100
- National rank
- #6706
- State rank
- #553 of 826 in TX
Livability — Garland
- Score
- 74/100
- State rank
- #165
- US rank
- #4447
Category grades
Schools grade is shown separately in the Schools card above.
Census & demographics
- Census place
- Garland, TX
- County
- Dallas County · 2,612,404 people
- City population
- 246,342
- Metro
- Dallas-Fort Worth-Arlington, TX
- Population (ZIP)
- 64,606
- Household income
- $74,519
- Rent vs Own
- Severe rent burden
- 1746.0
Population outlook (Dallas County) Hauer SSP2
- Today (2025)
- 2,979,839 people
- By 2030
- 3,191,823 · +7.1%
- By 2040
- 3,619,611 · +21.5%
- By 2050
- 4,026,915 · +35.1%
- By 2075
- 4,957,073 · +66.4%
- By 2100
- 5,508,725 · +84.9%
Race, ethnicity, and origin ACS 2023
- Neighborhood character
- Diverse neighborhood (Simpson 0.69)
- Race & ethnicity
- Hispanic / Latino 48% Two or more races 29% White 21% Black 15% Asian 11%
- Hispanic origin (detail)
- Mexican 38% Puerto Rican 1%
- Common ancestry
- Lithuanian 1% Romanian 1%
- Foreign-born
- 33% · Canada, Vietnam, China
- Languages at home
- 45% English-only · Spanish 40% Vietnamese 7% Other Indo-European 1%
Political lean MEDSL · Dallas
- 2024 margin
- Strong D (+22.2) · D 60.2% · R 38.0% · Other 1.8%
- 2008→2024 swing
- +6.9pp toward D · 2008: 15.3pp · 2024: 22.2pp
- All cycles
- 2024: D+22.2 2020: D+31.6 2016: D+26.2 2012: D+15.4 2008: D+15.3
Not yet ingested
- Civics
- —
Market trends
- HPI YoY
- ▼ -203.91%
- Current HPI
- 325.6966
- Rent YoY
- ▲ 0.43%
- Metro
- Dallas-Fort Worth-Arlington, TX
- State GDP YoY
- ▲ 3.95%
- F500 in state
- 110
Industry mix (Fortune 500 HQ in TX)
| Industry | F500 HQs | Revenue |
|---|---|---|
| Energy | 16 | $1,198B |
|
||
| Technology | 5 | $198B |
|
||
| Engineering / Construction | 4 | $72B |
|
||
| Energy Services | 3 | $60B |
|
||
| Utilities | 3 | $41B |
|
||
| Healthcare | 2 | $330B |
|
||
Price history
-24.6% since first listed9 events — show timeline
- 2026-05-01 Pending — NTREIS
- 2026-04-24 Contingent — NTREIS
- 2026-04-21 Price Changed $215,000 NTREIS
- 2026-04-11 Price Changed $235,000 NTREIS
- 2026-03-31 Price Changed $245,000 NTREIS
- 2026-03-19 Price Changed $259,900 NTREIS
- 2026-03-06 Listed $285,000 NTREIS
- 2025-11-10 Sold (Public Records) — Public Records
- 2025-11-10 Sold (Public Records) — Public Records
Property tax history
+5.3%/yrLatest (2025): $3,638 · +7.8% YoY. Source: county tax records.
Cash-flow waterfall
monthlySold comps — $/sqft
last 12 mo · ≤1 miLoading sold comps…