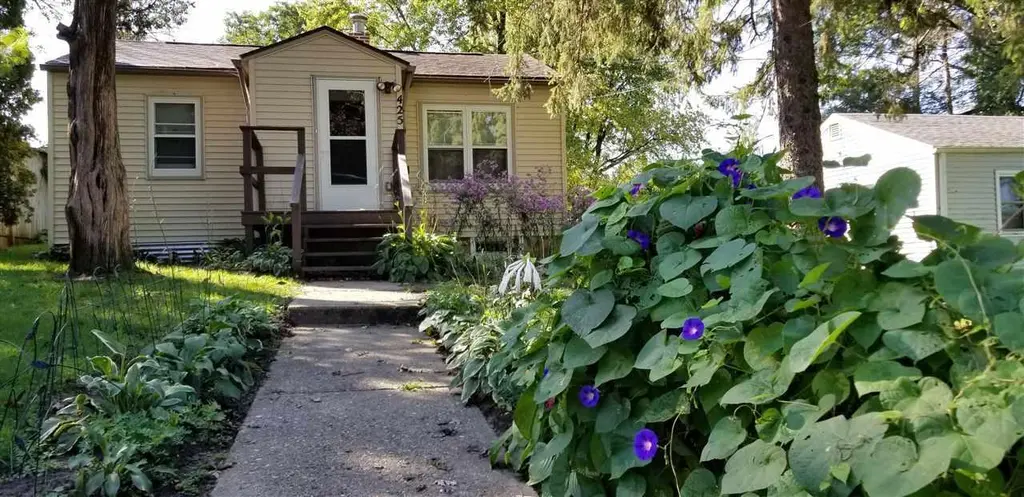
425 Linde St · DeForest, WI
Flood risk 1/10 · Minimal
- FEMA flood zone
- X (unshaded)
- Chance of flooding over 30 yrs
- 0.0%
- Est. flood insurance / yr
- $473 – $860
Fire risk 1/10 · Minimal
- Est. fire insurance / yr
- $636 – $1,182
Heat risk 2/10 · Minimal
- Hot days now (above 99°F)
- 7 days/yr
- Hot days in 30 yrs
- 14 days/yr
Wind risk 2/10 · Minimal
- Chance of severe wind over 30 yrs
- —
Air-quality risk 3/10 · Minor
- Unhealthy air days now
- 2 days/yr
- Unhealthy air days in 30 yrs
- 3 days/yr
Risk factors via First Street. Map © Google.
Why this score? — see what drove the C grade
The composite is a weighted blend of 9 inputs, each scored 0–100. Each bar is that input's sub-score; the figure is the points it added to the 100-point composite (weight × sub-score).
- Cash flow +18.0/30.0
- ARV discount +15.0/15.0
- DSCR +5.6/10.0
- 1% rule +4.9/10.0
- Rent growth +3.9/5.0
- Schools +3.6/10.0
- Livability +3.6/5.0
- Condition / age +2.5/5.0
- Appreciation +0.0/10.0
$245,000
🖨 Deal sheet (PDF) 📄 Offer letter ✓ Due diligence
Listing remarks
Three bedrooms, two on the main level and one on the lower level with an egress window. Also on the lower level is a rec room and laundry. There is a newer detached 2 car garage with access from the alleyway in the back yard. All appliances included but not warranted by the seller. House sold "AS-IS"
Key facts
- Rec room
- Access from alleyway
- Laundry
Tags
Property features AI
Exterior
- Parking: Detached 2-car garage with opener included
- Utilities: Municipal water; Municipal sewer
- Home design: Single-family home; One story
- Construction: Finished above grade area (approx. 668); Finished below grade area (approx. 520)
- Exterior features: Vinyl exterior; Full, partially finished block basement; Additional lower-level room (approx. 18 x 7)
Interior
- Kitchen: Range/Oven; Refrigerator
- Bedrooms: Master bedroom on main level (approx. 10 x 10); Second bedroom on main level (approx. 9 x 10); Third bedroom on lower level (approx. 17 x 9)
- Bathrooms: One full bathroom; No master bedroom bath
- Heating & cooling: Forced air heat; Central air; Natural gas
- Interior features: Cable/satellite available; High-speed internet
- Laundry & utility: Washer; Dryer
Neighborhood map
What this means for you Summary
Snapshot
- This is a 3-bed/1.0-bath single-family listed at $245k.
Deal economics
- At list price, monthly cash flow is $209 ($3k/yr) — positive.
- The deal already cash-flows at list — no discount required.
- To meet the 1% rule (rent ≥ 1% of price), the offer needs to be $242k (1.3% below list).
- Recommended offer: $238k (3.0% below list) — sets the bar for market timing.
- Cap rate 7.3% vs local median 2.1% in DeForest — top-decile yield for the area; either an underpriced asset or a hidden risk that comps aren't pricing in. Stress-test before assuming the spread holds.
Location & tenants
- Location reads 72/100 on livability (#244 in WI) — a middle-class / working-renter tenant base. Strengths: crime A+, employment A+, housing A+; Watch: amenities F, commute F, health & safety F.
- De Forest Area School District (suburban): math 39% / reading 39% proficiency, ranked #133 of 342 in WI (top 39%) — families likely to look elsewhere, expect single-tenant / working-renter base with shorter leases; only 17% free/reduced lunch — higher-income household profile.
- Zoned schools: Eagle Point Elementary (math 42% / reading 32%, grade F, #562 of 1,041 statewide, top 58%, 376 students, 16% FRL); De Forest Middle (math 39% / reading 40%, grade F, #153 of 383 statewide, top 42%, 561 students, 17% FRL); De Forest High (math 31% / reading 38%, grade F, #144 of 483 statewide, top 36%, 1,099 students, 18% FRL) — zoned schools at 17% FRL track the district average.
- Market conditions: Rents rising fast (+5.5%/yr); 114 active listings in the ZIP; 4 comparable units currently listed for rent nearby; rentals at typical pace (median 16d on market — plan ~3-4 weeks tenant-placement turnaround); high-income renter base; 5,519 units permitted in Dane County in 2024 (3,978 in 5+ unit buildings).
Forward outlook
- Local home prices are declining (-3.0%/yr); year-one equity from $2k of loan paydown is wiped out by about $7k of value loss. Plan a longer hold.
- Dane County population projected at +35% by 2050 — long-run rental-demand tailwind backs the buy-and-hold thesis.
Negotiation context
- It's been on market 42 days — a 3% lower offer ($238k) is reasonable based on typical stale-listing flexibility.
- Current owner paid $185k; 32% above their basis — modest negotiation headroom, anchor on the comps not their cost.
Risks & watch-outs
- Watch-outs: built in 1959 — expect roof / HVAC / electrical / plumbing capex.
Questions for the listing agent
- It's been on market 42 days. Have you received any prior offers? Is the seller open to a 3% concession, seller financing, or rate buy-down credit?
- Built in 1959 — when were the roof, HVAC, electrical panel, plumbing, and water heater last replaced?
- Is there a deadline driving the sale (1031 exchange, divorce, estate, relocation)? That informs how much negotiation room exists.
- What's the average days-on-market for RENTAL listings here right now (not sales)? A rising rental-DOM trend means longer vacancies and softer asking-rent achievability than the comps imply.
- What's the recent tenant-quality profile in this submarket — average credit score on applications, eviction rate, late-payment / NSF rate, and stable-employment percentage? A property-management company in the area should have these aggregated.
- How much new for-sale + rental construction is in the pipeline within 1–3 miles? Heavy new supply typically softens prices + rents 12–24 months out; constrained supply supports both.
Investment metrics
- 1% rule
- 0.99% ✗
- Cap rate
- 7.31%
- Cash-on-cash
- 3.65%
- DSCR
- 1.16
- GRM
- 8.4
CMA / ARV
- ARV (on-the-fly)
- $330,264
- Comps found
- 10
Show comp detail 10 sales within ~0.75 mi
| Address | Dist | Beds/Ba | Sqft | Sold | Price | $/sf | Match |
|---|---|---|---|---|---|---|---|
| 408 Anderson St | 0.13mi | 3/1.0 | 1,176 (-1%) | 21mo | $327,000 | $278 | 75 |
| 404 Anderson St | 0.11mi | 4/2.0 (+1) | 1,113 (-6%) | 2mo | $360,000 | $323 | 74 |
| 121 E North St | 0.34mi | 3/1.0 | 1,144 (-4%) | 12mo | $343,000 | $300 | 68 |
| 301 Acker Pkwy | 0.53mi | 3/1.5 | 1,189 (+0%) | 7mo | $330,000 | $278 | 68 |
| 433 E Lincoln Dr | 0.21mi | 3/1.5 | 1,126 (-5%) | 20mo | $315,000 | $280 | 63 |
| 441 Yahara St | 0.07mi | 3/2.0 | 1,092 (-8%) | 22mo | $265,000 | $243 | 61 |
| 125 Commerce St | 0.35mi | 2/1.5 (-1) | 1,232 (+4%) | 15mo | $310,000 | $252 | 58 |
| 464 Dahl Dr | 0.32mi | 3/2.0 | 1,339 (+13%) | 6mo | $322,000 | $240 | 54 |
| 409 Rosemal Ln | 0.42mi | 3/2.0 | 1,364 (+15%) | 8mo | $461,000 | $338 | 45 |
| 414 Cherokee Ct | 0.72mi | 3/1.5 | 1,255 (+6%) | 19mo | $268,000 | $214 | 39 |
Match score weights: distance 35% · size 25% · config 20% · recency 20%. Top-matched comps best support the ARV.
Projected returns pro-forma
-3.0% appreciation · 5.49% rent growth · sell at horizon
- IRR
- -7.8%
- Equity multiple
- 0.71×
- Total profit
- $-20,162
- Equity at exit
- $36,530
- IRR
- 4.7%
- Equity multiple
- 1.39×
- Total profit
- $26,534
- Equity at exit
- $21,183
Cash invested: $68,600 (down + closing). Projections, not guarantees.
Landlord ↔ Tenant lean methodology
- Overall (STATE)
- 73 Landlord-Friendly
- State Wisconsin
- 73 Landlord-Friendly · R+2
- County
- — inherits STATE
- City
- — inherits STATE
ZIP-level market 53532
- Rents YoY
- 5.5%
- Active inventory
- 114
- Price-to-rent
- 8.4×
Monthly cashflow live
- Estimated rent
- $2,418 medium interval (Pro) →
- Mortgage (P&I)
- −$1,285
- Tax from tax record
- −$315 /mo · $3,776/yr
- Insurance
- −$102
- HOA
- −$0
- Vacancy / Maint / Mgmt
- −$508
- Net cashflow
- $209
Break-even live
Sensitivity live
| Price | -10% $347 | -5% $278 | +0% $209 | +5% $139 | +10% $70 |
|---|---|---|---|---|---|
| Rent | -10% $18 | -5% $113 | +0% $209 | +5% $304 | +10% $400 |
| Rate | -1.0pp $332 | -0.5pp $271 | base $209 | +0.5pp $145 | +1.0pp $81 |
UW: 25.0% down · 7.5% · 30yr · 1.5% tax · 5.0% vac · 8.0% maint · 8.0% mgmt
Financing live
Cash to close
- Down payment
- $61,250
- Closing costs
- $7,350
- Reserves months
- —
- Total cash needed
- —
Loan-product check · same deal, 3 products live
Conventional
25% down · 7.5% · 30yr
- Down + closing
- —
- Monthly P&I
- —
- Monthly cashflow
- —
- DSCR
- —
- Eligible?
- —
Personal DTI + credit; lowest rate.
DSCR
20% down · 8.5% · 30yr
- Down + closing
- —
- Monthly P&I
- —
- Monthly cashflow
- —
- DSCR
- —
- Eligible?
- —
No personal income docs; deal must DSCR.
Hard money
10% down · 12.0% · 12mo
- Down + closing
- —
- Monthly P&I
- —
- Monthly cashflow
- —
- DSCR
- —
- Eligible?
- —
Short-term bridge; refi at stabilization.
Rent comps 4 comps
| Address | Beds | Baths | Sqft | Rent | $/sqft | DOM | Units | Dist |
|---|---|---|---|---|---|---|---|---|
| 4140 Silo View Dr De Forest, WI | 1.0–3.0 | 1.0–2.0 | 1090 | $2,605 | $2.39 | 16d | 6 | 0.25mi |
| 4664 Arden Ln De Forest, WI | 3.0 | 1.0–2.0 | 1023 | $2,830 | $2.77 | 16d | 39 | 0.37mi |
| 116 Renata Ct Deforest, WI | 3.0 | 2.0 | 1400 | $2,400 | $1.71 | 25d | 1 | 0.64mi |
| 335 Blackberry Ln DeForest, WI | 2.0 | 1.0–2.0 | 939 | $1,795 | $1.91 | 16d | 11 | 0.79mi |
Listing history 15 events
-
2026-06-10days on market $245,000 Active 42 DOM
-
2026-06-09days on market $245,000 Active 41 DOM
-
2026-06-08days on market $245,000 Active 40 DOM
-
2026-06-07days on market $245,000 Active 39 DOM
-
2026-06-05days on market $245,000 Active 36 DOM
-
2026-06-03days on market $245,000 Active 35 DOM
-
2026-06-02days on market $245,000 Active 34 DOM
-
2026-06-01days on market $245,000 Active 33 DOM
-
2026-05-31days on market $245,000 Active 32 DOM
-
2026-05-31days on market $245,000 Active 31 DOM
-
2026-04-28$245,000 Active
-
2019-11-13soldstatus $185,000
-
2017-08-28soldstatus $159,900
-
2004-08-09soldstatus $123,000
-
2000-04-21soldstatus $89,000
ⓘ Source: listings_history table (triggers on properties + properties_extension) + one-shot
backfill from property_details.listing_events for pre-trigger history.
Tax reassessment forecast WI · Partial reset (capped growth)
- Current annual tax
- $3,776 · $315/mo
- Projected year-2 tax
- $4,154 · $346/mo
- Expected delta
- +$378/yr (+$32/mo · 10.0%)
ⓘ Screening estimate from a state-policy table — verify with the county assessor before closing.
Climate risk First Street
- Flood 1/10 Low FEMA zone X (unshaded) · 0% chance over 30 yrs
- Wildfire 1/10 Low
- Heat 2/10 Low 7 d/yr ≥99°F today · 14 d/yr by 30 yrs out
- Wind 2/10 Low
- Air quality 3/10 Moderate 2 unhealthy d/yr today · 3 by 30 yrs out
Nearby sold comps map
Loading sold comps map…
Walkable amenities ~0.75 mi
Loading nearby amenities…
Taxation est. · year 1
- Rental income
- $29,015
- − Mortgage interest
- −$13,724
- − Property taxes
- −$3,776
- − Insurance
- −$1,225
- − Repairs & maintenance
- −$2,321
- − Management
- −$2,321
- − Depreciation
- −$7,127
- Taxable loss
- −$1,479
- Est. tax savings @ 24.0%
- +$355
- After-tax cash flow
- $2,859/yr
For passive investors: Depreciation is non-cash, so a rental often shows a tax loss while cash-flowing — sheltering income. Rental losses are passive: they offset passive income freely, and up to $25,000/yr can offset ordinary (W-2) income if you actively participate and your MAGI is under $100k (phasing out to $0 by $150k); unused losses carry forward. On sale, claimed depreciation is recaptured at up to 25%, and gains may owe capital-gains tax (a 1031 exchange can defer both). Figures are a year-1 estimate at your 24.0% rate — not tax advice; consult a CPA.
Schools (NCES district)
- District
- De Forest Area School District
- NCES district ID
- 5503180
- Math proficiency
- 39% ▼ -3.00%
- Reading proficiency
- 39% ▼ -7.00%
- Median HH income
- $76,811
- Composite
- 36.23/100
- National rank
- #4722
- State rank
- #133 of 342 in WI
Livability — DeForest
- Score
- 72/100
- State rank
- #244
- US rank
- #6371
Category grades
Schools grade is shown separately in the Schools card above.
Census & demographics
- Census place
- DeForest, WI
- County
- Dane County · 506,461 people
- City population
- 16,286
- Metro
- Madison, WI
- Population (ZIP)
- 16,514
- Household income
- $110,022
- Rent vs Own
- Severe rent burden
- 191.0
Population outlook (Dane County) Hauer SSP2
- Today (2025)
- 610,707 people
- By 2030
- 654,875 · +7.2%
- By 2040
- 740,480 · +21.2%
- By 2050
- 826,188 · +35.3%
- By 2075
- 1,040,574 · +70.4%
- By 2100
- 1,168,084 · +91.3%
Race, ethnicity, and origin ACS 2023
- Neighborhood character
- Predominantly White (85%)
- Race & ethnicity
- White 85% Two or more races 10% Hispanic / Latino 7% Asian 2% Black 2%
- Hispanic origin (detail)
- Mexican 4% Puerto Rican 2%
- Common ancestry
- Portuguese 11% Romanian 5% Lithuanian 3%
- Foreign-born
- 3% · Canada
- Languages at home
- 96% English-only · Spanish 2% Other Indo-European 1% Other Asian/Pacific 1%
Political lean MEDSL · Dane
- 2024 margin
- Solid D (+51.7) · D 75.1% · R 23.4% · Other 1.5%
- 2008→2024 swing
- +4.7pp toward D · 2008: 47.0pp · 2024: 51.7pp
- All cycles
- 2024: D+51.7 2020: D+52.6 2016: D+48.0 2012: D+43.6 2008: D+47.0
Not yet ingested
- Civics
- —
Market trends
- HPI YoY
- ▼ -269.12%
- Current HPI
- 278.6937
- Rent YoY
- ▲ 5.49%
- Metro
- Madison, WI
- State GDP YoY
- ▲ 2.10%
- F500 in state
- 20
Industry mix (Fortune 500 HQ in WI)
| Industry | F500 HQs | Revenue |
|---|---|---|
| Industrial Machinery | 4 | $23B |
|
||
| Industrial Technology | 2 | $36B |
|
||
| Insurance | 1 | $36B |
|
||
| Professional Services | 1 | $19B |
|
||
| Utilities | 1 | $9B |
|
||
| Consumer Goods | 1 | $3B |
|
||
Price history
+175.3% since first listed5 events — show timeline
- 2026-04-28 Listed $245,000 SCWMLS
- 2019-11-13 Sold (Public Records) $185,000 Public Records
- 2017-08-28 Sold (Public Records) $159,900 Public Records
- 2004-08-09 Sold (Public Records) $123,000 Public Records
- 2000-04-21 Sold (Public Records) $89,000 Public Records
Property tax history
+6.4%/yrLatest (2025): $3,776 · +6.8% YoY. Source: county tax records.
Cash-flow waterfall
monthlySold comps — $/sqft
last 12 mo · ≤1 miLoading sold comps…