613 Bourdois Ave · North Bellport, NY
Flood risk 1/10 · Minimal
- FEMA flood zone
- X (unshaded)
- Chance of flooding over 30 yrs
- 0.0%
- Est. flood insurance / yr
- $507 – $1,088
Fire risk 3/10 · Minor
- Est. fire insurance / yr
- $691 – $1,283
Heat risk 4/10 · Minor
- Hot days now (above 93°F)
- 6 days/yr
- Hot days in 30 yrs
- 16 days/yr
Wind risk 8/10 · Major
- Chance of severe wind over 30 yrs
- 80.0%
Air-quality risk 3/10 · Minor
- Unhealthy air days now
- 3 days/yr
- Unhealthy air days in 30 yrs
- 4 days/yr
Risk factors via First Street. Map © Google.
Why this score? — see what drove the F grade
The composite is a weighted blend of 9 inputs, each scored 0–100. Each bar is that input's sub-score; the figure is the points it added to the 100-point composite (weight × sub-score).
- Cash flow +4.9/30.0
- Schools +4.5/10.0
- ARV discount +3.4/15.0
- Livability +3.1/5.0
- Rent growth +2.5/5.0
- Condition / age +2.5/5.0
- 1% rule +0.8/10.0
- DSCR +0.0/10.0
- Appreciation +0.0/10.0
$649,999
🖨 Deal sheet 📄 Offer letter ✓ Due diligence
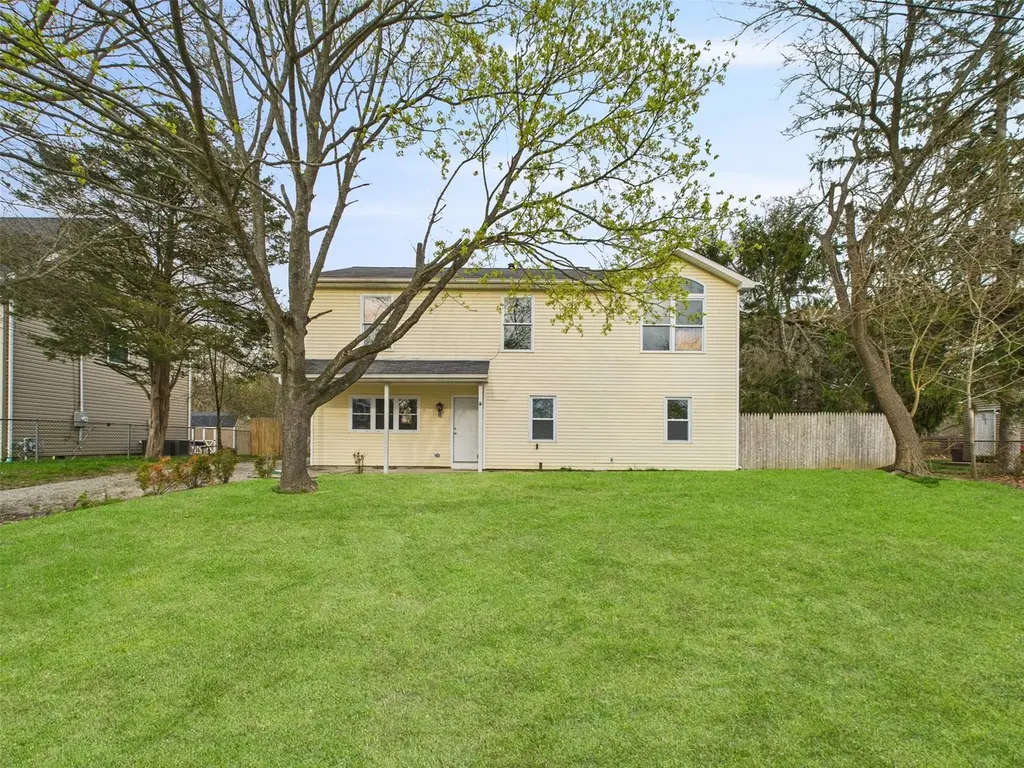
Listing remarks
Incredible opportunity to own this newly renovated oversized 4-bedroom, (could be a six bedroom-seller took wall down on the first floor) 3-bath colonial situated mid-block on a perfect flat lot with brand new vinyl siding and undeniable curb appeal! Step inside to an open floor plan drenched in natural light, with recessed lighting and a fresh coat of paint throughout. The kitchen, dining, and living areas are finished in sleek tile flooring, creating a seamless flow for entertaining. The chef’s kitchen boasts crisp white cabinets, luxurious quartz countertops, stainless steel appliances, and tons of cabinet and counter space. The first floor offers a stunning spa-like full bath, rec
Key facts
- Open floor plan
- Chef's kitchen
- 7,841 sq ft lot
Tags
Neighborhood map
What this means for you Summary
Snapshot
- This is a 4-bed/3.0-bath single-family listed at $650k.
Deal economics
- At list price, monthly cash flow is $-2k ($-19k/yr) — negative.
- To cash-flow at today's rent, offer at most $374k (42.4% below list).
- To meet the 1% rule (rent ≥ 1% of price), the offer needs to be $379k (41.7% below list).
- Recommended offer: $374k (42.4% below list) — sets the bar for cash-flow.
- Cap rate 3.4% vs local median 4.9% in North Bellport — below-typical yield; the buyer is paying a premium for something (appreciation thesis, condition, location) that the cap rate doesn't capture.
Location & tenants
- Location reads 62/100 on livability (#842 in NY) — a middle-class / working-renter tenant base. Strengths: employment A+, housing A+; Watch: crime C-, schools F, amenities F.
- South Country Central School District (suburban): math 50% / reading 44% proficiency, ranked #460 of 755 in NY (top 61%) — families likely to look elsewhere, expect single-tenant / working-renter base with shorter leases.
- Market conditions: 57 active listings in the ZIP; 6 comparable units currently listed for rent nearby; rentals at typical pace (median 19d on market — plan ~3-4 weeks tenant-placement turnaround); 1,366 units permitted in Suffolk County in 2024 (216 in 5+ unit buildings).
Forward outlook
- Local home prices are declining (-3.0%/yr); year-one equity from $4k of loan paydown is wiped out by about $20k of value loss. Plan a longer hold.
- Suffolk County population projected to shrink 5% by 2050 — rents likely to lag national; underwrite the cash flow, not the appreciation.
Negotiation context
- It's been on market 17 days — a 2% lower offer ($640k) is reasonable based on typical stale-listing flexibility.
- 4 sale attempts since 2y ago; this cycle's ask is 8% above the opening price — seller raised mid-cycle; expect resistance to lowballs.
Risks & watch-outs
- Climate carrying-cost: severe wind risk, 80% chance of damaging wind over 30y — expect insurance premiums to compound above CPI over the hold.
Questions for the listing agent
- What do current leases actually rent for vs. the listed asking? Can we see a recent rent roll and the last 12 months of T-12 income?
- Built in 1979 — when were the roof, HVAC, electrical panel, plumbing, and water heater last replaced?
- Is there a deadline driving the sale (1031 exchange, divorce, estate, relocation)? That informs how much negotiation room exists.
- Schools are F-rated, which usually means shorter tenancies and higher turnover. Who's the typical renter profile here, and what's been the actual vacancy rate?
- The area grade is low — what's the realistic commute time and amenity access for the typical tenant pool here? Any planned neighborhood developments (good or bad) we should know about?
- What's the average days-on-market for RENTAL listings here right now (not sales)? A rising rental-DOM trend means longer vacancies and softer asking-rent achievability than the comps imply.
- What's the recent tenant-quality profile in this submarket — average credit score on applications, eviction rate, late-payment / NSF rate, and stable-employment percentage? A property-management company in the area should have these aggregated.
- How much new for-sale + rental construction is in the pipeline within 1–3 miles? Heavy new supply typically softens prices + rents 12–24 months out; constrained supply supports both.
Investment metrics
- 1% rule
- 0.58% ✗
- Cap rate
- 3.41%
- Cash-on-cash
- -10.29%
- DSCR
- 0.54
- GRM
- 14.3
CMA / ARV
- ARV (median comp)
- $595,876
- List price
- $649,999
- Delta
- 0.69%
- Verdict
- FAIR
- Comps
- 20 within 1.0 mi
Show comp detail 12 sales within ~0.75 mi
| Address | Dist | Beds/Ba | Sqft | Sold | Price | $/sf | Match |
|---|---|---|---|---|---|---|---|
| 608 Bayview Ave | 0.28mi | 4/2.5 | 1,080 (-0%) | 3mo | $620,000 | $574 | 82 |
| 635 Provost Ave | 0.11mi | 4/1.0 | 1,045 (-3%) | 3mo | $447,000 | $428 | 78 |
| 425 Macdonald Ave | 0.28mi | 3/1.5 (-1) | 1,140 (+5%) | 0mo | $579,000 | $508 | 67 |
| 509 Hampton Ave | 0.44mi | 3/2.0 (-1) | 1,104 (+2%) | 6mo | $575,000 | $521 | 62 |
| 825 Doane Ave | 0.43mi | 4/1.0 | 1,112 (+3%) | 11mo | $505,000 | $454 | 58 |
| 270 Louise Ave | 0.61mi | 4/2.0 | 1,100 (+2%) | 11mo | $505,000 | $459 | 56 |
| 718 Taylor Ave | 0.28mi | 4/2.0 | 1,224 (+13%) | 8mo | $580,000 | $474 | 54 |
| 625 Scherger Ave | 0.26mi | 3/1.0 (-1) | 1,000 (-8%) | 10mo | $399,000 | $399 | 54 |
| 609 Michigan Ave | 0.36mi | 3/1.0 (-1) | 968 (-10%) | 7mo | $419,000 | $433 | 47 |
| 62 Beaver Dam Rd | 0.73mi | 3/2.5 (-1) | 1,140 (+5%) | 12mo | $560,000 | $491 | 41 |
| 833 Doane Ave | 0.44mi | 3/1.0 (-1) | 950 (-12%) | 9mo | $415,000 | $437 | 38 |
| 941 Provost Ave | 0.55mi | 3/1.0 (-1) | 964 (-11%) | 9mo | $400,000 | $415 | 36 |
Match score weights: distance 35% · size 25% · config 20% · recency 20%. Top-matched comps best support the ARV.
Projected returns pro-forma
-3.0% appreciation · 3.0% rent growth · sell at horizon
- IRR
- -34.8%
- Equity multiple
- -0.12×
- Total profit
- $-204,642
- Equity at exit
- $96,917
- IRR
- -45.4%
- Equity multiple
- -0.68×
- Total profit
- $-305,815
- Equity at exit
- $56,200
Cash invested: $182,000 (down + closing). Projections, not guarantees.
Landlord ↔ Tenant lean methodology
- Overall (STATE)
- 15 Strongly Tenant-Friendly
- State New York
- 15 Strongly Tenant-Friendly · D+10
- County
- — inherits STATE
- City
- — inherits STATE
ZIP-level market 11713
- Home prices YoY
- -26.0%
- Active inventory
- 57
- Price-to-rent
- 14.3×
Monthly cashflow live
- Estimated rent
- $3,791 high interval (Pro) →
- Mortgage (P&I)
- −$3,409
- Tax from tax record
- −$876 /mo · $10,517/yr
- Insurance
- −$271
- HOA
- −$0
- Vacancy / Maint / Mgmt
- −$796
- Net cashflow
- $-1,561
Break-even live
UW: 25.0% down · 7.5% · 30yr · 1.5% tax · 5.0% vac · 8.0% maint · 8.0% mgmt
Financing live
Cash to close
- Down payment
- $162,500
- Closing costs
- $19,500
- Reserves months
- —
- Total cash needed
- —
Loan-product check · same deal, 3 products live
Conventional
25% down · 7.5% · 30yr
- Down + closing
- —
- Monthly P&I
- —
- Monthly cashflow
- —
- DSCR
- —
- Eligible?
- —
Personal DTI + credit; lowest rate.
DSCR
20% down · 8.5% · 30yr
- Down + closing
- —
- Monthly P&I
- —
- Monthly cashflow
- —
- DSCR
- —
- Eligible?
- —
No personal income docs; deal must DSCR.
Hard money
10% down · 12.0% · 12mo
- Down + closing
- —
- Monthly P&I
- —
- Monthly cashflow
- —
- DSCR
- —
- Eligible?
- —
Short-term bridge; refi at stabilization.
Rent comps 6 comps
| Address | Beds | Baths | Sqft | Rent | $/sqft | DOM | Units | Dist |
|---|---|---|---|---|---|---|---|---|
| 718 Provost Ave Bellport, NY | 4.0 | 1.0 | 1100 | $4,000 | $3.64 | 44d | 1 | 0.21mi |
| 640 Post Ave Bellport, NY | 3.0 | 1.0 | 1024 | $3,600 | $3.52 | 10d | 1 | 0.40mi |
| 655 Post Ave Bellport, NY | 3.0 | 1.0 | 1008 | $3,350 | $3.32 | 10d | 1 | 0.44mi |
| 849 Walker Ave Bellport, NY | 3.0 | 1.0 | 884 | $3,500 | $3.96 | 4d | 1 | 0.67mi |
| 91 Circuit Rd Bellport, NY | 3.0 | 1.5 | 1154 | $4,500 | $3.90 | 24d | 1 | 0.90mi |
| 58 N Howells Point Rd Bellport, NY | 3.0 | 2.0 | 1404 | $15,000 | $10.68 | 19d | 1 | 1.18mi |
Listing history 23 events
-
2026-06-18days on market $649,999 Active 17 DOM
-
2026-06-17days on market $649,999 Active 16 DOM
-
2026-06-16days on market $649,999 Active 15 DOM
-
2026-06-15days on market $649,999 Active 14 DOM
-
2026-06-13days on market $649,999 Active 12 DOM
-
2026-06-13days on market $649,999 Active 11 DOM
-
2026-06-09days on market $649,999 Active 8 DOM
-
2026-06-08days on market $649,999 Active 7 DOM
-
2026-06-07days on market $649,999 Active 6 DOM
-
2026-06-04days on market $649,999 Active 3 DOM
-
2026-06-03days on market $649,999 Active 2 DOM
-
2026-06-02remarks 693-char remark
-
2026-06-02pricestatusdays on market $649,999 Active 1 DOM
-
2026-04-06status Active
-
2026-04-05historical
-
2025-04-29$599,999 Active
-
2024-10-18status Active
-
2024-10-18historical
-
2024-10-11status Pending
-
2024-09-25historical
-
2024-07-09price $599,999
-
2024-06-29$629,000 Active
-
2024-06-28historical
ⓘ Source: listings_history table (triggers on properties + properties_extension) + one-shot
backfill from property_details.listing_events for pre-trigger history.
Tax reassessment forecast NY · Partial reset (capped growth)
- Current annual tax
- $10,517 · $876/mo
- Projected year-2 tax
- $10,751 · $896/mo
- Expected delta
- +$234/yr (+$19/mo · 2.2%)
ⓘ Screening estimate from a state-policy table — verify with the county assessor before closing.
Climate risk First Street
- Flood 1/10 Low FEMA zone X (unshaded) · 0% chance over 30 yrs
- Wildfire 3/10 Moderate
- Heat 4/10 Moderate 6 d/yr ≥93°F today · 16 d/yr by 30 yrs out
- Wind 8/10 Severe 80% chance of damaging wind over 30 yrs
- Air quality 3/10 Moderate 3 unhealthy d/yr today · 4 by 30 yrs out
Nearby sold comps map
Loading sold comps map…
Walkable amenities ~0.75 mi
Loading nearby amenities…
Taxation est. · year 1
- Rental income
- $45,495
- − Mortgage interest
- −$36,410
- − Property taxes
- −$10,517
- − Insurance
- −$3,250
- − Repairs & maintenance
- −$3,640
- − Management
- −$3,640
- − Depreciation
- −$18,909
- Taxable loss
- −$30,871
- Est. tax savings @ 24.0%
- +$7,409
- After-tax cash flow
- $-11,321/yr
For passive investors: Depreciation is non-cash, so a rental often shows a tax loss while cash-flowing — sheltering income. Rental losses are passive: they offset passive income freely, and up to $25,000/yr can offset ordinary (W-2) income if you actively participate and your MAGI is under $100k (phasing out to $0 by $150k); unused losses carry forward. On sale, claimed depreciation is recaptured at up to 25%, and gains may owe capital-gains tax (a 1031 exchange can defer both). Figures are a year-1 estimate at your 24.0% rate — not tax advice; consult a CPA.
Schools (NCES district)
- District
- South Country Central School District
- NCES district ID
- 3600008
- Math proficiency
- 50% ▲ 4.00%
- Reading proficiency
- 44% ▲ 4.00%
- Median HH income
- $74,049
- Composite
- 44.75/100
- National rank
- #5960
- State rank
- #460 of 755 in NY
Livability — North Bellport
- Score
- 62/100
- State rank
- #842
- US rank
- #16345
Category grades
Schools grade is shown separately in the Schools card above.
Census & demographics
- Census place
- North Bellport, NY
- City population
- 9,236
- Population (ZIP)
- 9,236
Population outlook (Suffolk County) Hauer SSP2
- Today (2025)
- 1,505,262 people
- By 2030
- 1,498,318 · -0.5%
- By 2040
- 1,471,101 · -2.3%
- By 2050
- 1,424,848 · -5.3%
- By 2075
- 1,337,157 · -11.2%
- By 2100
- 1,217,720 · -19.1%
Race, ethnicity, and origin ACS 2023
- Neighborhood character
- Diverse neighborhood (Simpson 0.64)
- Race & ethnicity
- White 50% Hispanic / Latino 30% Black 14% Two or more races 10% Asian 2%
- Hispanic origin (detail)
- Mexican 2% Puerto Rican 3% Dominican 1%
- Common ancestry
- Romanian 4% Italian 1% Lithuanian 1%
- Foreign-born
- 23% · Canada, Jamaica, China
- Languages at home
- 72% English-only · Spanish 23% Other Indo-European 3%
Political lean MEDSL · Suffolk
- 2024 margin
- Lean R (+10.0) · D 45.0% · R 55.0%
- 2008→2024 swing
- -16.0pp toward R · 2008: 6.0pp · 2024: -10.0pp
- All cycles
- 2024: R+10.0 2020: R+0.0 2016: R+8.2 2012: D+2.9 2008: D+6.0
Not yet ingested
- Civics
- —
Market trends
- HPI YoY
- ▼ -148.23%
- Current HPI
- 421.2165
- Rent YoY
- —
- Metro
- —
- State GDP YoY
- ▲ 2.60%
- F500 in state
- 92
Industry mix (Fortune 500 HQ in NY)
| Industry | F500 HQs | Revenue |
|---|---|---|
| Financial Services | 10 | $950B |
|
||
| Consumer Goods | 9 | $162B |
|
||
| Insurance | 4 | $225B |
|
||
| Telecommunications | 2 | $144B |
|
||
| Pharmaceuticals | 2 | $112B |
|
||
| Media / Entertainment | 2 | $69B |
|
||
Price history
-4.6% since first listed10 events — show timeline
- 2026-04-06 Relisted — OneKey® MLS as Distributed by MLS Grid
- 2026-04-05 Listing Removed — OneKey® MLS as Distributed by MLS Grid
- 2025-04-29 Listed $599,999 OneKey® MLS as Distributed by MLS Grid
- 2024-10-18 Relisted — OneKey® MLS as Distributed by MLS Grid
- 2024-10-18 Listing Removed — OneKey® MLS as Distributed by MLS Grid
- 2024-10-11 Pending — OneKey® MLS as Distributed by MLS Grid
- 2024-09-25 Listing Removed — OneKey® MLS as Distributed by MLS Grid
- 2024-07-09 Price Changed $599,999 OneKey® MLS as Distributed by MLS Grid
- 2024-06-29 Listed $629,000 OneKey® MLS as Distributed by MLS Grid
- 2024-06-28 Coming Soon — OneKey® MLS as Distributed by MLS Grid
Property tax history
+4.6%/yrLatest (2025): $10,517 · +0.0% YoY. Source: county tax records.
Cash-flow waterfall
monthlySold comps — $/sqft
last 12 mo · ≤1 miLoading sold comps…