 Multi-family
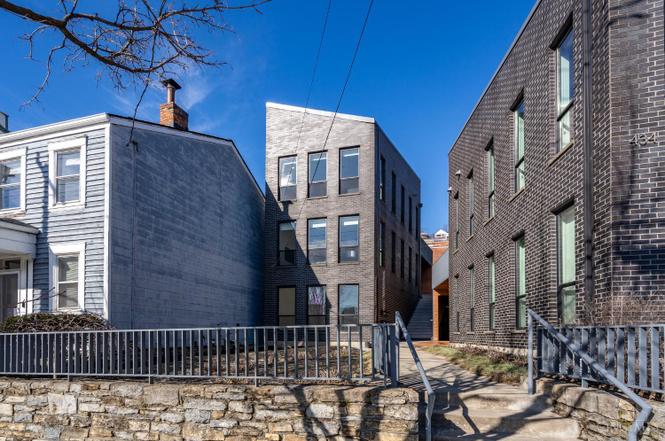
432 Liberty Hl · Cincinnati, OH
Flood risk 1/10 · Minimal
- FEMA flood zone
- X (unshaded)
- Chance of flooding over 30 yrs
- 0.0%
- Est. flood insurance / yr
- $473 – $860
Fire risk 1/10 · Minimal
- Est. fire insurance / yr
- $713 – $1,323
Heat risk 5/10 · Moderate
- Hot days now (above 103°F)
- 7 days/yr
- Hot days in 30 yrs
- 19 days/yr
Wind risk 2/10 · Minimal
- Chance of severe wind over 30 yrs
- 1.0%
Air-quality risk 3/10 · Minor
- Unhealthy air days now
- 2 days/yr
- Unhealthy air days in 30 yrs
- 3 days/yr
Risk factors via First Street. Map © Google.
Why this score? — see what drove the D grade
The composite is a weighted blend of 9 inputs, each scored 0–100. Each bar is that input's sub-score; the figure is the points it added to the 100-point composite (weight × sub-score).
- Cash flow +14.4/30.0
- ARV discount +7.5/15.0
- DSCR +4.4/10.0
- Livability +4.0/5.0
- Rent growth +3.2/5.0
- 1% rule +3.0/10.0
- Schools +2.5/10.0
- Condition / age +2.5/5.0
- Appreciation +0.0/10.0
$784,000
🖨 Deal sheet (PDF) 📄 Offer letter ✓ Due diligence
Multi-family units
County records classify this as Multi-Family (2-4 Unit). Listing-text estimate: 1 unit. estimate disagrees with records
Listing remarks MLS
Incredible Opportunity to own one of the most impressive duplexes in Cincinnati! LEED Gold Certified for huge tax savings until 2032 plus added income from the lower level unit. Only 7 years old, this 2-bedroom, 2 full bath unit with amazing city views is the perfect combination of low maintenance & affordable living just steps from OTR. High end finishes and fixtures throughout. 2017 CRAN Awards Best Overall Project winner by Cincinnati AIA. Unit A currently leased (under market) for $1850/mo.
Key facts
- Low maintenance
- Steps from otr
- 3,324 sq ft lot
Tags
Property features AI
Finance
- Other: Total buildings: 1
Exterior
- Parking: 2-car garage; 2 off-street open parking spaces; Off-street parking
- Utilities: Public water; Public sewer; Natural gas
- Home design: Duplex; Three or more levels; Poured foundation
- Construction: Brick construction; Metal roof
- Exterior features: Deck; Metal fence; Busline nearby
Interior
- Bedrooms: Two 2-bedroom units
- Bathrooms: Each unit has 2 full bathrooms
- Heating & cooling: Heat pump heating; Central air conditioning
- Interior features: Partial basement; Individual laundry
- Laundry & utility: Individual laundry in units
Neighborhood map
What this means for you Summary
Snapshot
- This is a 4-bed/4.0-bath multifamily listed at $784k.
Deal economics
- At list price, monthly cash flow is $154 ($2k/yr) — positive.
- The deal already cash-flows at list — no discount required.
- To meet the 1% rule (rent ≥ 1% of price), the offer needs to be $625k (20.3% below list).
- Recommended offer: $625k (20.3% below list) — sets the bar for 1% rule.
- Cap rate 6.5% vs local median 3.9% in Cincinnati — top-decile yield for the area; either an underpriced asset or a hidden risk that comps aren't pricing in. Stress-test before assuming the spread holds.
Location & tenants
- Location reads 80/100 on livability (#130 in OH, #1,856 nationally) — a professional / high-income tenant draw. Strengths: amenities A+, commute A+, cost of living A+; Watch: employment D, crime F.
- Cincinnati Public Schools (urban): math 25% / reading 36% proficiency, ranked #581 of 656 in OH (top 89%) — families likely to look elsewhere, expect single-tenant / working-renter base with shorter leases; 70% free/reduced lunch — lower-income household profile, screen leases tightly.
- Zoned schools: Sands Montessori School (math 70% / reading 77%, grade A, #311 of 1,584 statewide, top 20%, 683 students, 22% FRL); Hartwell School (math 17% / reading 31%, grade F, #593 of 654 statewide, top 91%, 447 students, 0% FRL); Walnut Hills High School (math 79% / reading 89%, grade A, #17 of 781 statewide, top 2%, 2,582 students, 14% FRL) — zoned schools average 12% FRL vs 70% district-wide (59 pts lower); this property's tenant base skews higher-income than the district average.
- Zoned-school proficiency averages 60% at this address vs 30% district-wide (+30 pts) — the actual schools serving this property are materially stronger than the Cincinnati Public Schools average implies; a family-tenant draw the district grade alone would hide.
- Market conditions: Rents rising (+2.7%/yr); 154 active listings in the ZIP; 26 comparable units currently listed for rent nearby; rentals at typical pace (median 17d on market — plan ~3-4 weeks tenant-placement turnaround); solid renter incomes; 801 units permitted in Hamilton County in 2024 (190 in 5+ unit buildings).
- At $6,252/mo this rent would consume 78% of the median local household income ($96k/yr) (locally 1514% of renters already pay >50% of income on rent) — very limited rent-growth headroom before tenants either downsize or default.
Forward outlook
- Local home prices are declining (-3.0%/yr); year-one equity from $5k of loan paydown is wiped out by about $24k of value loss. Plan a longer hold.
Negotiation context
- It's been on market 125 days — a 12% lower offer ($690k) is reasonable based on typical stale-listing flexibility.
- 4 sale attempts since 20y ago with the ask held roughly flat each time — persistent listings suggest the price (not the market) is what's stuck; bring a comps-based counter.
Risks & watch-outs
- Climate carrying-cost: extreme-heat days projected 7→19/yr by 2055 (HVAC capex compounding) — expect insurance premiums to compound above CPI over the hold.
Questions for the listing agent
- It's been on market 125 days. Have you received any prior offers? Is the seller open to a 20% concession, seller financing, or rate buy-down credit?
- Why hasn't it sold? Are there any deal-killer items the seller is aware of (foundation, flood, title, zoning, code violations)?
- Is there a deadline driving the sale (1031 exchange, divorce, estate, relocation)? That informs how much negotiation room exists.
- Schools are B-rated — typically a magnet for longer-tenancy family renters. What's the average tenant stay here, and is there a school-zone premium baked into asking?
- Crime grade is F in this area — have there been break-ins, vandalism, or insurance claims at this property in the last 3 years? What carrier currently insures it and at what premium?
- The area grade is low — what's the realistic commute time and amenity access for the typical tenant pool here? Any planned neighborhood developments (good or bad) we should know about?
- What's the average days-on-market for RENTAL listings here right now (not sales)? A rising rental-DOM trend means longer vacancies and softer asking-rent achievability than the comps imply.
- What's the recent tenant-quality profile in this submarket — average credit score on applications, eviction rate, late-payment / NSF rate, and stable-employment percentage? A property-management company in the area should have these aggregated.
- How much new apartment / multifamily construction is in the pipeline within 1–3 miles? Heavy new supply (>2% of stock underway) typically softens rents 12–24 months out; light construction supports rent growth.
Investment metrics
- 1% rule
- 0.80% ✗
- Cap rate
- 6.53%
- Cash-on-cash
- 0.84%
- DSCR
- 1.04
- GRM
- 10.5
CMA / ARV
- ARV (on-the-fly)
- $434,946
- Comps found
- 4
Show comp detail 4 sales within ~0.75 mi
| Address | Dist | Beds/Ba | Sqft | Sold | Price | $/sf | Match |
|---|---|---|---|---|---|---|---|
| 2207 Burnet Ave | 0.65mi | 5/3.0 (+1) | 3,180 (+4%) | 3mo | $400,000 | $126 | 52 |
| 151 Goethe St | 0.37mi | 3/2.5 (-1) | 2,907 (-5%) | 14mo | $400,000 | $138 | 51 |
| 2111 Burnet Ave | 0.54mi | 5/3.0 (+1) | 2,643 (-14%) | 11mo | $375,000 | $142 | 34 |
| 1622 Pleasant St | 0.60mi | 5/3.0 (+1) | 2,644 (-14%) | 19mo | $621,000 | $235 | 24 |
Match score weights: distance 35% · size 25% · config 20% · recency 20%. Top-matched comps best support the ARV.
Projected returns pro-forma
-3.0% appreciation · 2.7% rent growth · sell at horizon
- IRR
- -15.3%
- Equity multiple
- 0.46×
- Total profit
- $-119,394
- Equity at exit
- $116,897
- IRR
- -7.3%
- Equity multiple
- 0.54×
- Total profit
- $-100,187
- Equity at exit
- $67,786
Cash invested: $219,520 (down + closing). Projections, not guarantees.
Landlord ↔ Tenant lean methodology
- Overall (STATE)
- 73 Landlord-Friendly
- State Ohio
- 73 Landlord-Friendly · R+6
- County
- — inherits STATE
- City
- — inherits STATE
ZIP-level market 45202
- Rents YoY
- 2.7%
- Active inventory
- 154
- Price-to-rent
- 10.5×
Monthly cashflow live
- Estimated rent
- $6,252 high interval (Pro) →
- Mortgage (P&I)
- −$4,111
- Tax from tax record
- −$347 /mo · $4,161/yr
- Insurance
- −$327
- HOA
- −$0
- Vacancy / Maint / Mgmt
- −$1,313
- Net cashflow
- $154
Break-even live
Sensitivity live
| Price | -10% $598 | -5% $376 | +0% $154 | +5% $-68 | +10% $-290 |
|---|---|---|---|---|---|
| Rent | -10% $-340 | -5% $-93 | +0% $154 | +5% $401 | +10% $648 |
| Rate | -1.0pp $549 | -0.5pp $354 | base $154 | +0.5pp $-49 | +1.0pp $-256 |
UW: 25.0% down · 7.5% · 30yr · 1.5% tax · 5.0% vac · 8.0% maint · 8.0% mgmt
Financing live
Cash to close
- Down payment
- $196,000
- Closing costs
- $23,520
- Reserves months
- —
- Total cash needed
- —
Loan-product check · same deal, 3 products live
Conventional
25% down · 7.5% · 30yr
- Down + closing
- —
- Monthly P&I
- —
- Monthly cashflow
- —
- DSCR
- —
- Eligible?
- —
Personal DTI + credit; lowest rate.
DSCR
20% down · 8.5% · 30yr
- Down + closing
- —
- Monthly P&I
- —
- Monthly cashflow
- —
- DSCR
- —
- Eligible?
- —
No personal income docs; deal must DSCR.
Hard money
10% down · 12.0% · 12mo
- Down + closing
- —
- Monthly P&I
- —
- Monthly cashflow
- —
- DSCR
- —
- Eligible?
- —
Short-term bridge; refi at stabilization.
Rent comps 26 comps
| Address | Beds | Baths | Sqft | Rent | $/sqft | DOM | Units | Dist |
|---|---|---|---|---|---|---|---|---|
| 1354 Broadway Unit 1056136P Cincinnati, OH | 4.0 | 3.0 | 2529 | $7,307 | $2.89 | 4d | 1 | 0.06mi |
| 1304 Broadway Unit 1056130P Cincinnati, OH | 1.0–5.0 | 1.0–4.0 | 2072 | $7,152 | $3.45 | 12d | 2 | 0.17mi |
| 328 Mulberry St Cincinnati, OH | 3.0 | 3.5 | 2640 | $5,500 | $2.08 | 25d | 1 | 0.22mi |
| 328 Mulberry St Cincinnati, OH | 3.0 | 3.5 | 2640 | $5,500 | $2.08 | 16d | 1 | 0.22mi |
| 126 E 13th St Unit 1056025P Cincinnati, OH | 5.0 | 4.0 | 2960 | $5,339 | $1.80 | 4d | 1 | 0.30mi |
| 120 E 13th St Unit 1056091P Cincinnati, OH | 4.0 | 2.0 | 3229 | $10,667 | $3.30 | 23d | 1 | 0.32mi |
| 21 E 15th St Unit 1512946P Cincinnati, OH | 3.0 | 2.0 | 2852 | $12,830 | $4.50 | 25d | 1 | 0.37mi |
| 1537 Republic St Unit 1058850P Cincinnati, OH | 4.0 | 3.0 | 2421 | $10,677 | $4.41 | 23d | 1 | 0.48mi |
| 1287 Ida St Cincinnati, OH | 3.0 | 2.5 | 2494 | $4,700 | $1.88 | 19d | 1 | 0.49mi |
| 2105 Burnet Ave Unit 1056017P Cincinnati, OH | 4.0 | 2.0 | 2960 | $7,384 | $2.49 | 3d | 1 | 0.51mi |
| 1424 Pleasant St Unit 1056038P Cincinnati, OH | 4.0 | 3.0 | 2960 | $7,167 | $2.42 | 16d | 1 | 0.54mi |
| 55 Mulberry St Cincinnati, OH | 3.0 | 3.0 | 2500 | $3,500 | $1.40 | 25d | 1 | 0.55mi |
| 1610 Pleasant St Unit 1056041P Cincinnati, OH | 3.0–4.0 | 2.0–3.0 | 2960 | $7,037 | $2.38 | 12d | 2 | 0.56mi |
| 111 W Elder St Unit 1056044P Cincinnati, OH | 1.0–4.0 | 1.0–4.0 | 1835 | $7,140 | $3.89 | 12d | 2 | 0.59mi |
| 122 W Elder St Unit 1056110P Cincinnati, OH | 5.0 | 3.0 | 3444 | $7,875 | $2.29 | 3d | 1 | 0.64mi |
| 107 E Clifton Ave Unit 1234537P Cincinnati, OH | 2.0–3.0 | 1.0–2.0 | 2260 | $6,619 | $2.93 | 16d | 2 | 0.71mi |
| 2017 Elm St Unit 1056145P Cincinnati, OH | 5.0 | 2.0 | 3939 | $7,694 | $1.95 | 14d | 1 | 0.77mi |
| 2271 Vine St Cincinnati, OH | 4.0 | 2.0 | 2268 | $1,525 | $0.67 | 6d | 1 | 0.78mi |
| 987 Hill St Cincinnati, OH | 3.0 | 3.0 | 2878 | $7,000 | $2.43 | 3d | 1 | 0.81mi |
| 1 W 4th St Cincinnati, OH | 3.0 | 1.0–3.5 | 1675 | $9,200 | $5.49 | 4d | 96 | 0.96mi |
| 918 Windsor St Cincinnati, OH | 3.0 | 1.0 | 2583 | $1,675 | $0.65 | 25d | 1 | 1.12mi |
| 2317 Chickasaw St Cincinnati, OH | 5.0 | 2.0 | 2826 | $2,750 | $0.97 | 16d | 1 | 1.16mi |
| 2813 Gerard St Unit 1540075P Cincinnati, OH | 4.0 | 3.0 | 2152 | $6,281 | $2.92 | 22d | 1 | 1.30mi |
| 2800 Jefferson Ave Cincinnati, OH | 4.0 | 2.0 | 2500 | $625 | $0.25 | 21d | 1 | 1.31mi |
| 2331 Park Ave Unit 1 Cincinnati, OH | 3.0 | 2.5 | 2200 | $2,350 | $1.07 | 3d | 1 | 1.34mi |
| 2421 Fairview Ave Cincinnati, OH | 5.0 | 2.0 | 2400 | $3,300 | $1.38 | 25d | 1 | 1.48mi |
Listing history 26 events
-
2026-06-21days on market $784,000 Active 125 DOM
-
2026-06-18days on market $784,000 Active 122 DOM
-
2026-06-17days on market $784,000 Active 121 DOM
-
2026-06-16days on market $784,000 Active 120 DOM
-
2026-06-15days on market $784,000 Active 119 DOM
-
2026-06-13days on market $784,000 Active 117 DOM
-
2026-06-13days on market $784,000 Active 116 DOM
-
2026-06-09days on market $784,000 Active 113 DOM
-
2026-06-08days on market $784,000 Active 112 DOM
-
2026-06-07days on market $784,000 Active 111 DOM
-
2026-06-03days on market $784,000 Active 107 DOM
-
2026-06-02days on market $784,000 Active 106 DOM
-
2026-06-01days on market $784,000 Active 105 DOM
-
2026-05-31days on market $784,000 Active 104 DOM
-
2026-04-14price $784,000
-
2026-02-15$799,000 Active
-
2023-09-08price $744,000 503-char remark
Show marketing remark (503 chars)
Incredible Opportunity to own one of the most impressive duplexes in Cincinnati! LEED Gold Certified for huge tax savings until 2032 plus added income from the lower level unit. Only 7 years old, this 2-bedroom, 2 full bath unit with amazing city views is the perfect combination of low maintenance & affordable living just steps from OTR. High end finishes and fixtures throughout. 2017 CRAN Awards Best Overall Project winner by Cincinnati AIA. Unit A currently leased (under market) for $1850/mo.
-
2023-09-08soldstatus $744,000
Show marketing remark (503 chars)
Incredible Opportunity to own one of the most impressive duplexes in Cincinnati! LEED Gold Certified for huge tax savings until 2032 plus added income from the lower level unit. Only 7 years old, this 2-bedroom, 2 full bath unit with amazing city views is the perfect combination of low maintenance & affordable living just steps from OTR. High end finishes and fixtures throughout. 2017 CRAN Awards Best Overall Project winner by Cincinnati AIA. Unit A currently leased (under market) for $1850/mo.
-
2023-09-07soldstatus $744,000 Closed 503-char remark
Show marketing remark (503 chars)
Incredible Opportunity to own one of the most impressive duplexes in Cincinnati! LEED Gold Certified for huge tax savings until 2032 plus added income from the lower level unit. Only 7 years old, this 2-bedroom, 2 full bath unit with amazing city views is the perfect combination of low maintenance & affordable living just steps from OTR. High end finishes and fixtures throughout. 2017 CRAN Awards Best Overall Project winner by Cincinnati AIA. Unit A currently leased (under market) for $1850/mo.
-
2023-08-08status Pending 503-char remark
Show marketing remark (503 chars)
Incredible Opportunity to own one of the most impressive duplexes in Cincinnati! LEED Gold Certified for huge tax savings until 2032 plus added income from the lower level unit. Only 7 years old, this 2-bedroom, 2 full bath unit with amazing city views is the perfect combination of low maintenance & affordable living just steps from OTR. High end finishes and fixtures throughout. 2017 CRAN Awards Best Overall Project winner by Cincinnati AIA. Unit A currently leased (under market) for $1850/mo.
-
2023-08-07price $789,900 503-char remark
Show marketing remark (503 chars)
Incredible Opportunity to own one of the most impressive duplexes in Cincinnati! LEED Gold Certified for huge tax savings until 2032 plus added income from the lower level unit. Only 7 years old, this 2-bedroom, 2 full bath unit with amazing city views is the perfect combination of low maintenance & affordable living just steps from OTR. High end finishes and fixtures throughout. 2017 CRAN Awards Best Overall Project winner by Cincinnati AIA. Unit A currently leased (under market) for $1850/mo.
-
2023-07-31$789,900 Active 503-char remark
Show marketing remark (503 chars)
Incredible Opportunity to own one of the most impressive duplexes in Cincinnati! LEED Gold Certified for huge tax savings until 2032 plus added income from the lower level unit. Only 7 years old, this 2-bedroom, 2 full bath unit with amazing city views is the perfect combination of low maintenance & affordable living just steps from OTR. High end finishes and fixtures throughout. 2017 CRAN Awards Best Overall Project winner by Cincinnati AIA. Unit A currently leased (under market) for $1850/mo.
-
2013-08-15soldstatus $67,500 199-char remark
Show marketing remark (199 chars)
Great city views from historic Prospect Hill in Mt. Auburn. This parcel runs the length from Liberty Hill to Cooperation Alley, 23 x 126.50. Near to bus transportation, easy access to I-71 and I-471.
-
2012-12-17$35,000 199-char remark
Show marketing remark (199 chars)
Great city views from historic Prospect Hill in Mt. Auburn. This parcel runs the length from Liberty Hill to Cooperation Alley, 23 x 126.50. Near to bus transportation, easy access to I-71 and I-471.
-
2006-08-04soldstatus $42,500
-
2006-05-05$48,000
ⓘ Source: listings_history table (triggers on properties + properties_extension) + one-shot
backfill from property_details.listing_events for pre-trigger history.
Tax reassessment forecast OH · Partial reset (capped growth)
- Current annual tax
- $4,161 · $347/mo
- Projected year-2 tax
- $8,195 · $683/mo
- Expected delta
- +$4,035/yr (+$336/mo · 97.0%)
ⓘ Screening estimate from a state-policy table — verify with the county assessor before closing.
Climate risk First Street
- Flood 1/10 Low FEMA zone X (unshaded) · 0% chance over 30 yrs
- Wildfire 1/10 Low
- Heat 5/10 Major 7 d/yr ≥103°F today · 19 d/yr by 30 yrs out
- Wind 2/10 Low 100% chance of damaging wind over 30 yrs
- Air quality 3/10 Moderate 2 unhealthy d/yr today · 3 by 30 yrs out
Nearby sold comps map
Loading sold comps map…
Walkable amenities ~0.75 mi
Loading nearby amenities…
Taxation est. · year 1
- Rental income
- $75,023
- − Mortgage interest
- −$43,916
- − Property taxes
- −$4,161
- − Insurance
- −$3,920
- − Repairs & maintenance
- −$6,002
- − Management
- −$6,002
- − Depreciation
- −$22,807
- Taxable loss
- −$11,785
- Est. tax savings @ 24.0%
- +$2,828
- After-tax cash flow
- $4,679/yr
For passive investors: Depreciation is non-cash, so a rental often shows a tax loss while cash-flowing — sheltering income. Rental losses are passive: they offset passive income freely, and up to $25,000/yr can offset ordinary (W-2) income if you actively participate and your MAGI is under $100k (phasing out to $0 by $150k); unused losses carry forward. On sale, claimed depreciation is recaptured at up to 25%, and gains may owe capital-gains tax (a 1031 exchange can defer both). Figures are a year-1 estimate at your 24.0% rate — not tax advice; consult a CPA.
Schools (NCES district)
- District
- Cincinnati Public Schools
- NCES district ID
- 3904375
- Math proficiency
- 25% ▼ -19.00%
- Reading proficiency
- 36% ▼ -14.00%
- Median HH income
- $35,743
- Composite
- 25.21/100
- National rank
- #7508
- State rank
- #581 of 656 in OH
Livability — Cincinnati
- Score
- 80/100
- State rank
- #130
- US rank
- #1856
Category grades
Schools grade is shown separately in the Schools card above.
Census & demographics
- Census place
- Cincinnati, OH
- County
- Hamilton County · 701,295 people
- City population
- 505,555
- Metro
- Cincinnati, OH-KY-IN
- Population (ZIP)
- 17,869
- Household income
- $95,633
- Rent vs Own
- Severe rent burden
- 1514.0
Population outlook (Hamilton County) Hauer SSP2
- Today (2025)
- 826,054 people
- By 2030
- 830,947 · +0.6%
- By 2040
- 832,319 · +0.8%
- By 2050
- 822,428 · -0.4%
- By 2075
- 788,688 · -4.5%
- By 2100
- 710,674 · -14.0%
Race, ethnicity, and origin ACS 2023
- Neighborhood character
- Majority White (64%)
- Race & ethnicity
- White 64% Black 23% Two or more races 6% Asian 4% Hispanic / Latino 2%
- Common ancestry
- Italian 2% Lithuanian 2% Romanian 2%
- Foreign-born
- 7% · Canada, China, South Korea
- Languages at home
- 91% English-only · Other Indo-European 2% Spanish 2% Other Asian/Pacific 1%
Political lean MEDSL · Hamilton
- 2024 margin
- D (+14.9) · D 57.0% · R 42.1%
- 2008→2024 swing
- +7.9pp toward D · 2008: 7.0pp · 2024: 14.9pp
- All cycles
- 2024: D+14.9 2020: D+15.9 2016: D+9.5 2012: D+4.9 2008: D+7.0
Not yet ingested
- Civics
- —
Market trends
- HPI YoY
- ▼ -219.24%
- Current HPI
- 233.4526
- Rent YoY
- ▲ 2.70%
- Metro
- Cincinnati, OH-KY-IN
- State GDP YoY
- ▲ 1.98%
- F500 in state
- 48
Industry mix (Fortune 500 HQ in OH)
| Industry | F500 HQs | Revenue |
|---|---|---|
| Insurance | 3 | $145B |
|
||
| Industrial Machinery | 3 | $49B |
|
||
| Financial Services | 3 | $24B |
|
||
| Consumer Goods | 2 | $93B |
|
||
| Aerospace / Defense | 2 | $47B |
|
||
| Utilities | 2 | $33B |
|
||
Price history
+1533.3% since first listed12 events — show timeline
- 2026-04-14 Price Changed $784,000 Cincy MLS
- 2026-02-15 Listed $799,000 Cincy MLS
- 2023-09-08 Price Changed $744,000 Cincy MLS
- 2023-09-08 Sold (Public Records) $744,000 Public Records
- 2023-09-07 Sold (MLS) $744,000 Cincy MLS
- 2023-08-08 Pending — Cincy MLS
- 2023-08-07 Price Changed $789,900 Cincy MLS
- 2023-07-31 Listed $789,900 Cincy MLS
- 2013-08-15 Sold (MLS) $67,500 Cincy MLS
- 2012-12-17 Listed $35,000 Cincy MLS
- 2006-08-04 Sold (MLS) $42,500 Cincy MLS
- 2006-05-05 Listed $48,000 Cincy MLS
Property tax history
-8.9%/yrLatest (2025): $4,161 · +3.1% YoY. Source: county tax records.
Cash-flow waterfall
monthlySold comps — $/sqft
last 12 mo · ≤1 miLoading sold comps…