8520 Lake Dr · Cedar Hill Lakes, MO
Flood risk 1/10 · Minimal
- FEMA flood zone
- X (unshaded)
- Chance of flooding over 30 yrs
- 0.0%
- Est. flood insurance / yr
- $507 – $1,088
Fire risk 3/10 · Minor
- Est. fire insurance / yr
- $1,054 – $1,958
Heat risk 4/10 · Minor
- Hot days now (above 107°F)
- 7 days/yr
- Hot days in 30 yrs
- 20 days/yr
Wind risk 2/10 · Minimal
- Chance of severe wind over 30 yrs
- 1.0%
Air-quality risk 1/10 · Minimal
- Unhealthy air days now
- 0 days/yr
- Unhealthy air days in 30 yrs
- 0 days/yr
Risk factors via First Street. Map © Google.
Why this score? — see what drove the D grade
The composite is a weighted blend of 9 inputs, each scored 0–100. Each bar is that input's sub-score; the figure is the points it added to the 100-point composite (weight × sub-score).
- Cash flow +15.9/30.0
- ARV discount +7.5/15.0
- DSCR +4.9/10.0
- 1% rule +3.7/10.0
- Schools +3.0/10.0
- Livability +2.7/5.0
- Rent growth +2.5/5.0
- Condition / age +2.5/5.0
- Appreciation +0.0/10.0
$149,000
🖨 Deal sheet (PDF) 📄 Offer letter ✓ Due diligence
Listing remarks MLS
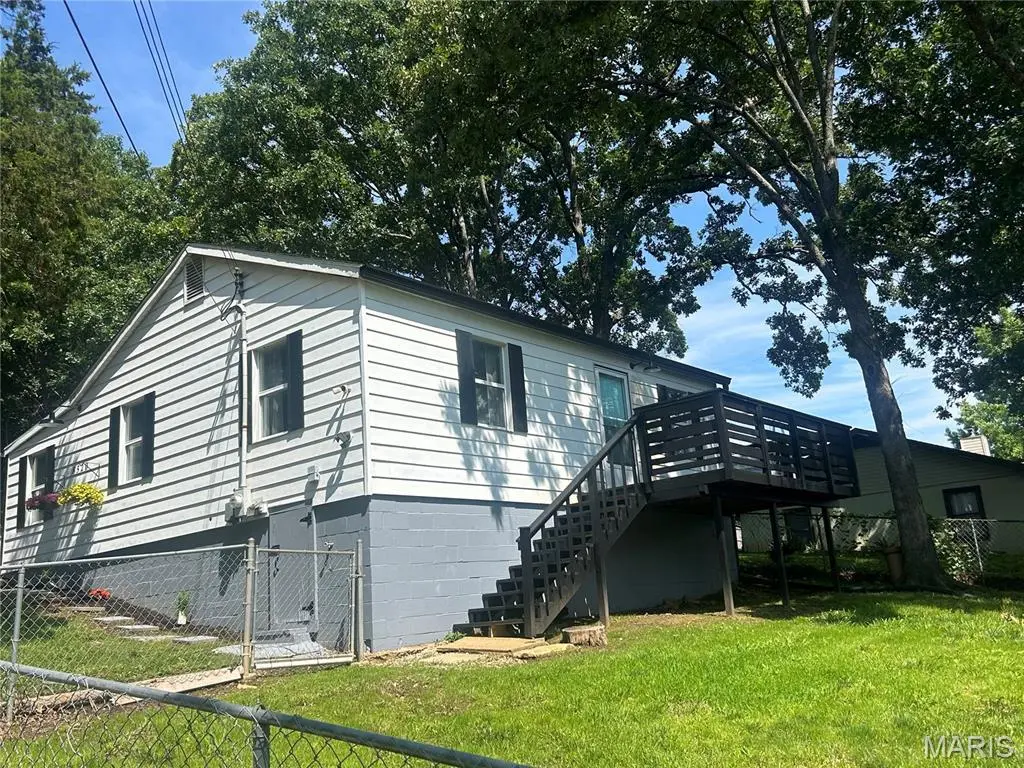
Calling all investors and visionaries! This lake view property offers endless potential for renovation. Bring your tools and creativity to transform this diamond in the rough into your dream home or next profitable project. This home is being sold "as is" seller to do no repairs/replacements of any kind. Pictures coming!
Key facts
- New mini split hvac
- New plumbing
- Deck off the front
Tags
Property features AI
Finance
- Other: Home warranty available; Seller may consider concessions
- HOA & community: Member of Lake Adelle Property Owners, Inc.; Community amenities include common ground and lake access; Annual association fee of $271 covering road/parking maintenance and common area maintenance
Exterior
- Parking: Space for 4 vehicles; Additional parking with concrete and gravel surfaces
- Utilities: Community water; Public sewer; Electricity with 220 volts; Electricity connected, sewer connected, water connected
- Home design: Attached single-family residence; One level
- Construction: Aluminum siding and Masonite exterior; Shingle roof; Block basement
- Exterior features: Private yard; Chain link fence; Adjoins wooded area; Lake access / lake privileges
Interior
- Kitchen: Electric range; Refrigerator
- Bedrooms: Three bedrooms on the main level
- Bathrooms: One full bathroom on the main level
- Heating & cooling: Ductless electric heating; Multiple cooling units
- Interior features: Electric range; Refrigerator; Ductless electric heating; Multi-unit cooling; Basement with block construction and storage space
- Laundry & utility: Basement storage space (utility access)
Neighborhood map
What this means for you Summary
Snapshot
- This is a 3-bed/1.0-bath other listed at $149k.
Deal economics
- At list price, monthly cash flow is $71 ($858/yr) — positive.
- The deal already cash-flows at list — no discount required.
- To meet the 1% rule (rent ≥ 1% of price), the offer needs to be $130k (12.7% below list).
- Recommended offer: $130k (12.7% below list) — sets the bar for 1% rule.
Location & tenants
- Location reads 54/100 on livability (#778 in MO) — a working-class tenant base; expect higher turnover. Strengths: cost of living A+, housing A+; Watch: crime F, amenities F, commute F.
- Grandview R-II (rural): math 27% / reading 43% proficiency, ranked #205 of 324 in MO (top 63%) — families likely to look elsewhere, expect single-tenant / working-renter base with shorter leases.
- Zoned schools: Grandview Elem. (math 37% / reading 52%, grade F, #413 of 1,115 statewide, top 42%, 230 students, 51% FRL); Grandview Middle (math 27% / reading 32%, grade F, #291 of 391 statewide, top 76%, 158 students, 41% FRL); Grandview High (math 17% / reading 52%, grade F, #321 of 521 statewide, top 67%, 261 students, 37% FRL) — zoned schools at 43% FRL track the district average.
- Market conditions: 47 active listings in the ZIP; 807 units permitted in Jefferson County in 2024 (104 in 5+ unit buildings).
Forward outlook
- Local home prices are declining (-3.0%/yr); year-one equity from $1k of loan paydown is wiped out by about $4k of value loss. Plan a longer hold.
Negotiation context
- It's been on market 18 days — a 2% lower offer ($147k) is reasonable based on typical stale-listing flexibility.
- 2 sale attempts with the ask held roughly flat each time — persistent listings suggest the price (not the market) is what's stuck; bring a comps-based counter.
Risks & watch-outs
- Watch-outs: built in 1949 — expect roof / HVAC / electrical / plumbing capex.
Questions for the listing agent
- Built in 1949 — when were the roof, HVAC, electrical panel, plumbing, and water heater last replaced?
- What does the HOA fee cover, when was the last increase, and are there any pending special assessments or reserve-fund shortfalls?
- Is there a deadline driving the sale (1031 exchange, divorce, estate, relocation)? That informs how much negotiation room exists.
- Schools are F-rated, which usually means shorter tenancies and higher turnover. Who's the typical renter profile here, and what's been the actual vacancy rate?
- Crime grade is F in this area — have there been break-ins, vandalism, or insurance claims at this property in the last 3 years? What carrier currently insures it and at what premium?
- The area grade is low — what's the realistic commute time and amenity access for the typical tenant pool here? Any planned neighborhood developments (good or bad) we should know about?
- What's the average days-on-market for RENTAL listings here right now (not sales)? A rising rental-DOM trend means longer vacancies and softer asking-rent achievability than the comps imply.
- What's the recent tenant-quality profile in this submarket — average credit score on applications, eviction rate, late-payment / NSF rate, and stable-employment percentage? A property-management company in the area should have these aggregated.
- How much new for-sale + rental construction is in the pipeline within 1–3 miles? Heavy new supply typically softens prices + rents 12–24 months out; constrained supply supports both.
Investment metrics
- 1% rule
- 0.87% ✗
- Cap rate
- 6.87%
- Cash-on-cash
- 2.06%
- DSCR
- 1.09
- GRM
- 9.5
CMA / ARV
No comps found within radius.
Projected returns pro-forma
-3.0% appreciation · 3.0% rent growth · sell at horizon
- IRR
- -13.1%
- Equity multiple
- 0.53×
- Total profit
- $-19,617
- Equity at exit
- $22,216
- IRR
- -4.1%
- Equity multiple
- 0.73×
- Total profit
- $-11,324
- Equity at exit
- $12,883
Cash invested: $41,720 (down + closing). Projections, not guarantees.
Landlord ↔ Tenant lean methodology
- Overall (STATE)
- 81 Strongly Landlord-Friendly
- State Missouri
- 81 Strongly Landlord-Friendly · R+10
- County
- — inherits STATE
- City
- — inherits STATE
ZIP-level market 63016
- Home prices YoY
- -21.7%
- Active inventory
- 47
- Price-to-rent
- 9.5×
Monthly cashflow live
- Estimated rent
- $1,300 medium interval (Pro) →
- Mortgage (P&I)
- −$781
- Tax from tax record
- −$89 /mo · $1,073/yr
- Insurance
- −$62
- HOA
- −$23
- Vacancy / Maint / Mgmt
- −$273
- Net cashflow
- $71
Break-even live
Sensitivity live
| Price | -10% $156 | -5% $114 | +0% $71 | +5% $29 | +10% $-13 |
|---|---|---|---|---|---|
| Rent | -10% $-31 | -5% $20 | +0% $71 | +5% $123 | +10% $174 |
| Rate | -1.0pp $147 | -0.5pp $109 | base $71 | +0.5pp $33 | +1.0pp $-6 |
UW: 25.0% down · 7.5% · 30yr · 1.5% tax · 5.0% vac · 8.0% maint · 8.0% mgmt
Financing live
Cash to close
- Down payment
- $37,250
- Closing costs
- $4,470
- Reserves months
- —
- Total cash needed
- —
Loan-product check · same deal, 3 products live
Conventional
25% down · 7.5% · 30yr
- Down + closing
- —
- Monthly P&I
- —
- Monthly cashflow
- —
- DSCR
- —
- Eligible?
- —
Personal DTI + credit; lowest rate.
DSCR
20% down · 8.5% · 30yr
- Down + closing
- —
- Monthly P&I
- —
- Monthly cashflow
- —
- DSCR
- —
- Eligible?
- —
No personal income docs; deal must DSCR.
Hard money
10% down · 12.0% · 12mo
- Down + closing
- —
- Monthly P&I
- —
- Monthly cashflow
- —
- DSCR
- —
- Eligible?
- —
Short-term bridge; refi at stabilization.
HOA detail
- Monthly dues
- $23 · $276/yr
Listing history 15 events
-
2026-06-21status $149,000 Pending 18 DOM
-
2026-06-18days on market $149,000 Active Under Contract 18 DOM
-
2026-06-17days on market $149,000 Active Under Contract 17 DOM
-
2026-06-16days on market $149,000 Active Under Contract 16 DOM
-
2026-06-15days on market $149,000 Active Under Contract 15 DOM
-
2026-06-14days on market $149,000 Active Under Contract 13 DOM
-
2026-06-12days on market $149,000 Active Under Contract 12 DOM
-
2026-06-09days on market $149,000 Active Under Contract 9 DOM
-
2026-06-08days on market $149,000 Active Under Contract 8 DOM
-
2026-06-07days on market $149,000 Active Under Contract 7 DOM
-
2026-06-05statusdays on market $149,000 Active Under Contract 5 DOM
-
2026-06-04days on market $149,000 Active 3 DOM
-
2026-06-02days on market $149,000 Active 2 DOM
-
2026-06-01remarks 699-char remark
-
2026-06-01$149,000 Active 1 DOM
ⓘ Source: listings_history table (triggers on properties + properties_extension) + one-shot
backfill from property_details.listing_events for pre-trigger history.
Tax reassessment forecast MO · Resets to sale price
- Current annual tax
- $1,073 · $89/mo
- Projected year-2 tax
- $1,445 · $120/mo
- Expected delta
- +$372/yr (+$31/mo · 34.7%)
ⓘ Screening estimate from a state-policy table — verify with the county assessor before closing.
Climate risk First Street
- Flood 1/10 Low FEMA zone X (unshaded) · 0% chance over 30 yrs
- Wildfire 3/10 Moderate
- Heat 4/10 Moderate 7 d/yr ≥107°F today · 20 d/yr by 30 yrs out
- Wind 2/10 Low 100% chance of damaging wind over 30 yrs
- Air quality 1/10 Low 0 unhealthy d/yr today · 0 by 30 yrs out
Nearby sold comps map
Loading sold comps map…
Walkable amenities ~0.75 mi
Loading nearby amenities…
Taxation est. · year 1
- Rental income
- $15,606
- − Mortgage interest
- −$8,346
- − Property taxes
- −$1,073
- − Insurance
- −$745
- − Repairs & maintenance
- −$1,248
- − Management
- −$1,248
- − HOA
- −$276
- − Depreciation
- −$4,335
- Taxable loss
- −$1,666
- Est. tax savings @ 24.0%
- +$400
- After-tax cash flow
- $1,258/yr
For passive investors: Depreciation is non-cash, so a rental often shows a tax loss while cash-flowing — sheltering income. Rental losses are passive: they offset passive income freely, and up to $25,000/yr can offset ordinary (W-2) income if you actively participate and your MAGI is under $100k (phasing out to $0 by $150k); unused losses carry forward. On sale, claimed depreciation is recaptured at up to 25%, and gains may owe capital-gains tax (a 1031 exchange can defer both). Figures are a year-1 estimate at your 24.0% rate — not tax advice; consult a CPA.
Schools (NCES district)
- District
- Grandview R-II
- NCES district ID
- 2913170
- Math proficiency
- 27% ▼ -14.00%
- Reading proficiency
- 43% ▼ -4.00%
- Median HH income
- $50,090
- Composite
- 30.3/100
- National rank
- #6277
- State rank
- #205 of 324 in MO
Livability — Cedar Hill Lakes
- Score
- 54/100
- State rank
- #778
- US rank
- #23862
Category grades
Schools grade is shown separately in the Schools card above.
Census & demographics
- Population (ZIP)
- 6,291
Population outlook (Jefferson County) Hauer SSP2
- Today (2025)
- 235,088 people
- By 2030
- 238,365 · +1.4%
- By 2040
- 240,156 · +2.2%
- By 2050
- 234,651 · -0.2%
- By 2075
- 214,569 · -8.7%
- By 2100
- 179,697 · -23.6%
Race, ethnicity, and origin ACS 2023
- Neighborhood character
- Predominantly White (93%)
- Race & ethnicity
- White 93% Two or more races 6%
- Common ancestry
- Lithuanian 4% Slovak 3% Romanian 3%
- Foreign-born
- 1% · Canada
- Languages at home
- 98% English-only · Spanish 1%
Political lean MEDSL · Jefferson
- 2024 margin
- Solid R (+36.7) · D 31.0% · R 67.7% · Other 1.3%
- 2008→2024 swing
- -39.3pp toward R · 2008: 2.5pp · 2024: -36.7pp
- All cycles
- 2024: R+36.7 2020: R+33.9 2016: R+35.3 2012: R+12.7 2008: D+2.5
Not yet ingested
- Civics
- —
Market trends
- HPI YoY
- ▼ -62.62%
- Current HPI
- 225.3731
- Rent YoY
- —
- Metro
- —
- State GDP YoY
- ▲ 1.84%
- F500 in state
- 20
Industry mix (Fortune 500 HQ in MO)
| Industry | F500 HQs | Revenue |
|---|---|---|
| Healthcare | 1 | $163B |
|
||
| Insurance | 1 | $21B |
|
||
| Industrial Technology | 1 | $17B |
|
||
| Retail | 1 | $16B |
|
||
| Industrial Distribution | 1 | $10B |
|
||
| Utilities | 1 | $9B |
|
||
Price history
+98.7% since first listed6 events — show timeline
- 2026-06-01 Listed $149,000 MARIS as Distributed by MLS Grid
- 2026-06-01 Coming Soon $149,000 MARIS as Distributed by MLS Grid
- 2026-04-10 Sold (MLS) — MARIS as Distributed by MLS Grid
- 2026-03-18 Contingent — MARIS as Distributed by MLS Grid
- 2026-02-06 Price Changed $70,000 MARIS as Distributed by MLS Grid
- 2026-01-21 Listed $75,000 MARIS as Distributed by MLS Grid
Property tax history
+4.0%/yrLatest (2025): $1,073 · +6.7% YoY. Source: county tax records.
Cash-flow waterfall
monthlySold comps — $/sqft
last 12 mo · ≤1 miLoading sold comps…