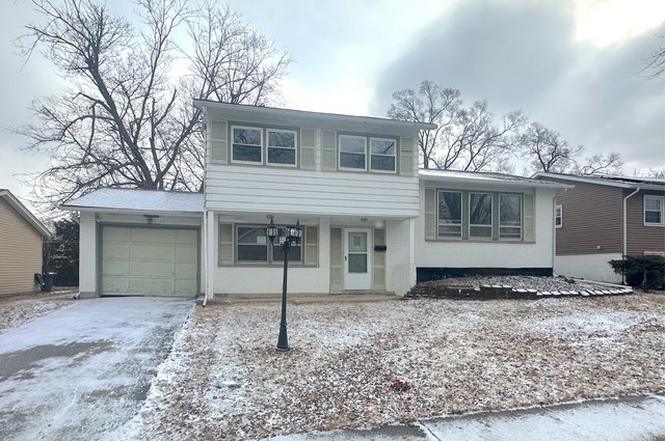
17807 Grandview Dr · Hazel Crest, IL
Flood risk 1/10 · Minimal
- FEMA flood zone
- X (unshaded)
- Chance of flooding over 30 yrs
- 0.0%
- Est. flood insurance / yr
- $473 – $860
Fire risk 1/10 · Minimal
- Est. fire insurance / yr
- $804 – $1,492
Heat risk 3/10 · Minor
- Hot days now (above 101°F)
- 7 days/yr
- Hot days in 30 yrs
- 15 days/yr
Wind risk 2/10 · Minimal
- Chance of severe wind over 30 yrs
- —
Air-quality risk 3/10 · Minor
- Unhealthy air days now
- 4 days/yr
- Unhealthy air days in 30 yrs
- 4 days/yr
Risk factors via First Street. Map © Google.
Why this score? — see what drove the C grade
The composite is a weighted blend of 9 inputs, each scored 0–100. Each bar is that input's sub-score; the figure is the points it added to the 100-point composite (weight × sub-score).
- Cash flow +21.7/30.0
- ARV discount +10.2/15.0
- 1% rule +8.4/10.0
- DSCR +6.9/10.0
- Livability +3.8/5.0
- Rent growth +2.5/5.0
- Condition / age +2.5/5.0
- Schools +2.4/10.0
- Appreciation +0.0/10.0
$184,900
🖨 Deal sheet (PDF) 📄 Offer letter ✓ Due diligence
Listing remarks
3 bedroom, 2.5 bath split-level home with a 1 car attached garage. SELLER DOES NOT PROVIDE SURVEY, TAXES PRORATED AT 100. SOLD AS-IS.
Key facts
- 6,480 sq ft lot
- Garage
- Built 1962
Property features AI
Finance
- Other: Directions: Kedzie to 175th, east to Oakwood, south to Grandview
- HOA & community: No master association fee required
Exterior
- Parking: Attached garage (1 garage space; 1 total parking space)
- Utilities: Public water; Public sewer
- Home design: Detached single-family home; Split-level design; Fee simple ownership; Built before 1978 (61-70 years old)
- Construction: Brick and frame construction
- Exterior features: Lot dimensions approximately 60 x 108; Lot smaller than 0.25 acre
Interior
- Kitchen: Kitchen on main level (11 x 15)
- Bedrooms: 3 bedrooms (master bedroom on second level, two additional bedrooms on second level)
- Bathrooms: 2 full bathrooms, 1 half bathroom; Basement includes a bathroom
- Heating & cooling: Natural gas heating; Central air conditioning
- Interior features: Finished full basement; 7 total rooms
- Laundry & utility: Laundry room on lower level (7 x 11)
Neighborhood map
What this means for you Summary
Snapshot
- This is a 3-bed/1.0-bath single-family listed at $185k.
Deal economics
- At list price, monthly cash flow is $285 ($3k/yr) — positive.
- The deal already cash-flows at list — no discount required.
- Meets the 1% rule at list price ($2k rent vs $185k).
- Recommended offer: $168k (9.0% below list) — sets the bar for market timing.
Location & tenants
- Location reads 75/100 on livability (#229 in IL, #4,242 nationally) — a middle-class / working-renter tenant base. Strengths: commute A+, cost of living A+, housing A+; Watch: health & safety C-, schools D-, crime F.
- Homewood Flossmoor Chsd 233 (suburban): math 21% / reading 27% proficiency, ranked #272 of 620 in IL (top 44%) — low school quality limits family demand, transient renter base, plan for 1-2y turnover.
- Market conditions: 80 active listings in the ZIP; 12 comparable units currently listed for rent nearby; rentals leasing fast (median 2d on market — plan ~1-2 weeks tenant-placement turnaround); 6,272 units permitted in Cook County in 2024 (4,658 in 5+ unit buildings).
Forward outlook
- Local home prices are declining (-3.0%/yr); year-one equity from $1k of loan paydown is wiped out by about $6k of value loss. Plan a longer hold.
Negotiation context
- It's been on market 99 days — a 9% lower offer ($168k) is reasonable based on typical stale-listing flexibility.
- 10 sale attempts since 19y ago; this cycle's ask is 23% above the opening price — seller raised mid-cycle; expect resistance to lowballs.
- Current owner paid $147k; 26% above their basis — modest negotiation headroom, anchor on the comps not their cost.
Risks & watch-outs
- Watch-outs: property tax is 4.1% of price.
Questions for the listing agent
- It's been on market 99 days. Have you received any prior offers? Is the seller open to a 9% concession, seller financing, or rate buy-down credit?
- Built in 1962 — when were the roof, HVAC, electrical panel, plumbing, and water heater last replaced?
- Property tax is high relative to price — has the assessment been appealed recently, and will the sale trigger a re-assessment?
- Why hasn't it sold? Are there any deal-killer items the seller is aware of (foundation, flood, title, zoning, code violations)?
- Is there a deadline driving the sale (1031 exchange, divorce, estate, relocation)? That informs how much negotiation room exists.
- Schools are D-rated, which usually means shorter tenancies and higher turnover. Who's the typical renter profile here, and what's been the actual vacancy rate?
- Crime grade is F in this area — have there been break-ins, vandalism, or insurance claims at this property in the last 3 years? What carrier currently insures it and at what premium?
- What's the average days-on-market for RENTAL listings here right now (not sales)? A rising rental-DOM trend means longer vacancies and softer asking-rent achievability than the comps imply.
- What's the recent tenant-quality profile in this submarket — average credit score on applications, eviction rate, late-payment / NSF rate, and stable-employment percentage? A property-management company in the area should have these aggregated.
- How much new for-sale + rental construction is in the pipeline within 1–3 miles? Heavy new supply typically softens prices + rents 12–24 months out; constrained supply supports both.
Investment metrics
- 1% rule
- 1.34% ✓
- Cap rate
- 8.14%
- Cash-on-cash
- 6.60%
- DSCR
- 1.29
- GRM
- 6.2
CMA / ARV
- ARV (on-the-fly)
- $196,896
- Comps found
- 12
Show comp detail 12 sales within ~0.75 mi
| Address | Dist | Beds/Ba | Sqft | Sold | Price | $/sf | Match |
|---|---|---|---|---|---|---|---|
| 17622 Oakwood Dr | 0.23mi | 3/1.5 | 1,257 (+7%) | 3mo | $115,000 | $91 | 72 |
| 2722 Cherrywood Pl | 0.26mi | 3/1.5 | 1,258 (+7%) | 3mo | $260,000 | $207 | 71 |
| 2810 Lexington Dr | 0.50mi | 3/1.0 | 1,243 (+6%) | 5mo | $123,000 | $99 | 63 |
| 17312 Poe Ave | 0.73mi | 4/1.0 (+1) | 1,187 (+1%) | 0mo | $199,000 | $168 | 59 |
| 2800 Lexington Dr | 0.50mi | 3/2.0 | 1,073 (-8%) | 0mo | $180,000 | $168 | 58 |
| 2912 175th St | 0.47mi | 3/1.0 | 1,044 (-11%) | 3mo | $209,500 | $201 | 57 |
| 2612 175th St | 0.50mi | 3/1.0 | 1,280 (+9%) | 6mo | $98,200 | $77 | 57 |
| 17510 Western Ave | 0.63mi | 2/1.0 (-1) | 1,215 (+4%) | 5mo | $130,000 | $107 | 55 |
| 17417 Kedzie Ave | 0.68mi | 3/2.0 | 1,100 (-6%) | 0mo | $200,000 | $182 | 54 |
| 2818 Tennyson Pl | 0.63mi | 3/1.0 | 1,085 (-7%) | 6mo | $130,000 | $120 | 53 |
| 2933 183rd St | 0.63mi | 3/2.0 | 1,027 (-12%) | 5mo | $255,000 | $248 | 42 |
| 3003 Longfellow Ave | 0.66mi | 3/2.0 | 1,326 (+13%) | 5mo | $178,000 | $134 | 39 |
Match score weights: distance 35% · size 25% · config 20% · recency 20%. Top-matched comps best support the ARV.
Projected returns pro-forma
-3.0% appreciation · 3.0% rent growth · sell at horizon
- IRR
- -6.0%
- Equity multiple
- 0.78×
- Total profit
- $-11,554
- Equity at exit
- $27,569
- IRR
- 3.8%
- Equity multiple
- 1.28×
- Total profit
- $14,421
- Equity at exit
- $15,987
Cash invested: $51,772 (down + closing). Projections, not guarantees.
Landlord ↔ Tenant lean methodology
- Overall (STATE)
- 43 Moderately Tenant-Leaning
- State Illinois
- 43 Moderately Tenant-Leaning · D+7
- County
- — inherits STATE
- City
- — inherits STATE
ZIP-level market 60429
- Home prices YoY
- -14.0%
- Active inventory
- 80
- Price-to-rent
- 6.2×
Monthly cashflow live
- Estimated rent
- $2,479 high interval (Pro) →
- Mortgage (P&I)
- −$970
- Tax from tax record
- −$627 /mo · $7,522/yr
- Insurance
- −$77
- HOA
- −$0
- Vacancy / Maint / Mgmt
- −$521
- Net cashflow
- $285
Break-even live
Sensitivity live
| Price | -10% $389 | -5% $337 | +0% $285 | +5% $232 | +10% $180 |
|---|---|---|---|---|---|
| Rent | -10% $89 | -5% $187 | +0% $285 | +5% $383 | +10% $480 |
| Rate | -1.0pp $378 | -0.5pp $332 | base $285 | +0.5pp $237 | +1.0pp $188 |
UW: 25.0% down · 7.5% · 30yr · 1.5% tax · 5.0% vac · 8.0% maint · 8.0% mgmt
Financing live
Cash to close
- Down payment
- $46,225
- Closing costs
- $5,547
- Reserves months
- —
- Total cash needed
- —
Loan-product check · same deal, 3 products live
Conventional
25% down · 7.5% · 30yr
- Down + closing
- —
- Monthly P&I
- —
- Monthly cashflow
- —
- DSCR
- —
- Eligible?
- —
Personal DTI + credit; lowest rate.
DSCR
20% down · 8.5% · 30yr
- Down + closing
- —
- Monthly P&I
- —
- Monthly cashflow
- —
- DSCR
- —
- Eligible?
- —
No personal income docs; deal must DSCR.
Hard money
10% down · 12.0% · 12mo
- Down + closing
- —
- Monthly P&I
- —
- Monthly cashflow
- —
- DSCR
- —
- Eligible?
- —
Short-term bridge; refi at stabilization.
Rent comps 12 comps
| Address | Beds | Baths | Sqft | Rent | $/sqft | DOM | Units | Dist |
|---|---|---|---|---|---|---|---|---|
| 2722 Larkspur Ln Hazel Crest, IL | 3.0 | 1.5 | 1441 | $2,650 | $1.84 | 13d | 1 | 0.29mi |
| 2420 183rd St Homewood, IL | 2.0 | 1.0 | 1100 | $1,750 | $1.59 | 11d | 1 | 0.75mi |
| 17561 Hillside Ave Homewood, IL | 3.0 | 1.0 | 1174 | $2,300 | $1.96 | 2d | 1 | 0.76mi |
| 17561 Hillside Ave Homewood, IL | 3.0 | 1.0 | 1174 | $2,500 | $2.13 | 17d | 1 | 0.76mi |
| 3501 177th St Country Club Hills, IL | 2.0 | 2.0 | 839 | $2,850 | $3.40 | 0d | 1 | 0.89mi |
| 3515 Bordeaux Ct Hazel Crest, IL | 4.0 | 2.0 | 1486 | $2,900 | $1.95 | 2d | 1 | 0.94mi |
| 2173 171st St Hazel Crest, IL | 3.0 | 1.5 | 1159 | $2,350 | $2.03 | 2d | 1 | 1.18mi |
| 2308 170th St Hazel Crest, IL | 3.0 | 2.0 | 1020 | $2,400 | $2.35 | 2d | 1 | 1.21mi |
| 2107 171st St Unit 2107 Hazel Crest, IL | 3.0 | 1.5 | 1158 | $2,300 | $1.99 | 2d | 1 | 1.24mi |
| 16901 Orchard Ridge Ave Hazel Crest, IL | 4.0 | 2.0 | 1406 | $2,700 | $1.92 | 2d | 1 | 1.28mi |
| 16752 Artesian Ave Hazel Crest, IL | 3.0 | 1.0 | 867 | $2,500 | $2.88 | 2d | 1 | 1.39mi |
| 17306 Peach Grove Ln Hazel Crest, IL | 4.0 | 1.0 | 1034 | $2,700 | $2.61 | 2d | 1 | 1.40mi |
Listing history 43 events
-
2026-06-18days on market $184,900 Active 99 DOM
-
2026-06-17days on market $184,900 Active 98 DOM
-
2026-06-16days on market $184,900 Active 97 DOM
-
2026-06-15days on market $184,900 Active 96 DOM
-
2026-06-13days on market $184,900 Active 94 DOM
-
2026-06-09days on market $184,900 Active 90 DOM
-
2026-06-08days on market $184,900 Active 89 DOM
-
2026-06-07days on market $184,900 Active 88 DOM
-
2026-06-04days on market $184,900 Active 85 DOM
-
2026-06-03days on market $184,900 Active 84 DOM
-
2026-06-02days on market $184,900 Active 83 DOM
-
2026-06-01days on market $184,900 Active 82 DOM
-
2026-05-31days on market $184,900 Active 81 DOM
-
2026-04-09historical
-
2025-07-01status Pending
-
2025-07-01price
-
2025-07-01historical
-
2025-06-03Auction
-
2024-01-24historical
-
2023-11-27status Active
-
2023-11-27price
-
2023-11-13historical
-
2023-11-13status Temporarily No Showings
-
2023-08-05status Pending
-
2023-07-19status Active
-
2023-07-06historical
-
2023-07-06status Temporarily No Showings
-
2023-05-30historical Contingent - No Showings
-
2023-05-26status Active
-
2023-05-26price
-
2023-03-20status Pending
-
2023-03-01Active
-
2013-03-01historical
-
2012-12-08price Price Change
-
2012-08-17price Price Change
-
2012-06-10New
-
2007-12-27soldstatus $147,000
-
2007-12-21soldstatus $147,000
-
2007-11-16historical
-
2007-10-22$149,900
-
2007-10-21historical
-
2007-07-21
-
1985-01-01soldstatus $62,000
ⓘ Source: listings_history table (triggers on properties + properties_extension) + one-shot
backfill from property_details.listing_events for pre-trigger history.
Tax reassessment forecast IL · Partial reset (capped growth)
- Current annual tax
- $7,522 · $627/mo
- Projected year-2 tax
- $7,522 · $627/mo
- Expected delta
- $0/yr ($0/mo · 0.0%)
ⓘ Screening estimate from a state-policy table — verify with the county assessor before closing.
Climate risk First Street
- Flood 1/10 Low FEMA zone X (unshaded) · 0% chance over 30 yrs
- Wildfire 1/10 Low
- Heat 3/10 Moderate 7 d/yr ≥101°F today · 15 d/yr by 30 yrs out
- Wind 2/10 Low
- Air quality 3/10 Moderate 4 unhealthy d/yr today · 4 by 30 yrs out
Nearby sold comps map
Loading sold comps map…
Walkable amenities ~0.75 mi
Loading nearby amenities…
Taxation est. · year 1
- Rental income
- $29,744
- − Mortgage interest
- −$10,357
- − Property taxes
- −$7,522
- − Insurance
- −$924
- − Repairs & maintenance
- −$2,380
- − Management
- −$2,380
- − Depreciation
- −$5,379
- Taxable income
- $802
- Est. tax owed @ 24.0%
- −$192
- After-tax cash flow
- $3,223/yr
For passive investors: Depreciation is non-cash, so a rental often shows a tax loss while cash-flowing — sheltering income. Rental losses are passive: they offset passive income freely, and up to $25,000/yr can offset ordinary (W-2) income if you actively participate and your MAGI is under $100k (phasing out to $0 by $150k); unused losses carry forward. On sale, claimed depreciation is recaptured at up to 25%, and gains may owe capital-gains tax (a 1031 exchange can defer both). Figures are a year-1 estimate at your 24.0% rate — not tax advice; consult a CPA.
Schools (NCES district)
- District
- Homewood Flossmoor Chsd 233
- NCES district ID
- 1719560
- Math proficiency
- 21% ▼ -15.00%
- Reading proficiency
- 27% ▼ -13.00%
- Median HH income
- $83,564
- Composite
- 24.42/100
- National rank
- #7681
- State rank
- #272 of 620 in IL
Livability — Hazel Crest
- Score
- 75/100
- State rank
- #229
- US rank
- #4242
Category grades
Schools grade is shown separately in the Schools card above.
Census & demographics
- Census place
- Hazel Crest, IL
- City population
- 14,602
- Population (ZIP)
- 14,602
Population outlook (Cook County) Hauer SSP2
- Today (2025)
- 5,347,519 people
- By 2030
- 5,357,703 · +0.2%
- By 2040
- 5,324,924 · -0.4%
- By 2050
- 5,230,762 · -2.2%
- By 2075
- 4,785,735 · -10.5%
- By 2100
- 4,188,836 · -21.7%
Race, ethnicity, and origin ACS 2023
- Neighborhood character
- Predominantly Black (83%)
- Race & ethnicity
- Black 83% White 7% Hispanic / Latino 7% Two or more races 4%
- Hispanic origin (detail)
- Mexican 6%
- Common ancestry
- Romanian 1% Iranian 1%
- Foreign-born
- 5% · Canada
- Languages at home
- 93% English-only · Spanish 6%
Political lean MEDSL · Cook
- 2024 margin
- Solid D (+42.0) · D 70.4% · R 28.4% · Other 1.2%
- 2008→2024 swing
- -11.4pp toward R · 2008: 53.4pp · 2024: 42.0pp
- All cycles
- 2024: D+42.0 2020: D+50.3 2016: D+53.0 2012: D+49.4 2008: D+53.4
Not yet ingested
- Civics
- —
Market trends
- HPI YoY
- ▼ -46.04%
- Current HPI
- 282.3552
- Rent YoY
- —
- Metro
- —
- State GDP YoY
- ▲ 1.59%
- F500 in state
- 60
Industry mix (Fortune 500 HQ in IL)
| Industry | F500 HQs | Revenue |
|---|---|---|
| Insurance | 4 | $201B |
|
||
| Consumer Goods | 4 | $87B |
|
||
| Industrial Machinery | 3 | $64B |
|
||
| Healthcare | 2 | $55B |
|
||
| Retail / Pharmacy | 1 | $148B |
|
||
| Agriculture / Food | 1 | $86B |
|
||
Price history
+137.1% since first listed30 events — show timeline
- 2026-04-09 Listing Removed — MRED as Distributed by MLS Grid
- 2025-07-01 Pending — MRED as Distributed by MLS Grid
- 2025-07-01 Price Changed — MRED as Distributed by MLS Grid
- 2025-07-01 Listing Removed — MRED as Distributed by MLS Grid
- 2025-06-03 Listed — MRED as Distributed by MLS Grid
- 2024-01-24 Listing Removed — MRED as Distributed by MLS Grid
- 2023-11-27 Relisted — MRED as Distributed by MLS Grid
- 2023-11-27 Price Changed — MRED as Distributed by MLS Grid
- 2023-11-13 Listing Removed — MRED as Distributed by MLS Grid
- 2023-11-13 Relisted — MRED as Distributed by MLS Grid
- 2023-08-05 Pending — MRED as Distributed by MLS Grid
- 2023-07-19 Relisted — MRED as Distributed by MLS Grid
- 2023-07-06 Listing Removed — MRED as Distributed by MLS Grid
- 2023-07-06 Relisted — MRED as Distributed by MLS Grid
- 2023-05-30 Contingent — MRED as Distributed by MLS Grid
- 2023-05-26 Relisted — MRED as Distributed by MLS Grid
- 2023-05-26 Price Changed — MRED as Distributed by MLS Grid
- 2023-03-20 Pending — MRED as Distributed by MLS Grid
- 2023-03-01 Listed — MRED as Distributed by MLS Grid
- 2013-03-01 Listing Removed — MRED as Distributed by MLS Grid
- 2012-12-08 Price Changed — MRED as Distributed by MLS Grid
- 2012-08-17 Price Changed — MRED as Distributed by MLS Grid
- 2012-06-10 Listed — MRED as Distributed by MLS Grid
- 2007-12-27 Sold (Public Records) $147,000 Public Records
- 2007-12-21 Sold (MLS) $147,000 MRED as Distributed by MLS Grid
- 2007-11-16 Listing Removed — MRED as Distributed by MLS Grid
- 2007-10-22 Listed $149,900 MRED as Distributed by MLS Grid
- 2007-10-21 Listing Removed — MRED as Distributed by MLS Grid
- 2007-07-21 Listed — MRED as Distributed by MLS Grid
- 1985-01-01 Sold (Public Records) $62,000 Public Records
Property tax history
+14.1%/yrLatest (2023): $7,522 · +49.7% YoY. Source: county tax records.
Cash-flow waterfall
monthlySold comps — $/sqft
last 12 mo · ≤1 miLoading sold comps…