2939 Squaw Valley Rd · McCloud, CA
Flood risk 1/10 · Minimal
- FEMA flood zone
- X (unshaded)
- Chance of flooding over 30 yrs
- 0.0%
- Est. flood insurance / yr
- $507 – $1,088
Fire risk 7/10 · Major
- Est. fire insurance / yr
- $659 – $1,223
Heat risk 4/10 · Minor
- Hot days now (above 95°F)
- 8 days/yr
- Hot days in 30 yrs
- 20 days/yr
Wind risk 1/10 · Minimal
- Chance of severe wind over 30 yrs
- —
Air-quality risk 10/10 · Severe
- Unhealthy air days now
- 42 days/yr
- Unhealthy air days in 30 yrs
- 43 days/yr
Risk factors via First Street. Map © Google.
Why this score? — see what drove the D+ grade
The composite is a weighted blend of 9 inputs, each scored 0–100. Each bar is that input's sub-score; the figure is the points it added to the 100-point composite (weight × sub-score).
- ARV discount +15.0/15.0
- Appreciation +10.0/10.0
- Cash flow +8.8/30.0
- Schools +3.6/10.0
- Livability +3.0/5.0
- Rent growth +2.5/5.0
- Condition / age +2.5/5.0
- DSCR +2.4/10.0
- 1% rule +2.2/10.0
$425,000
🖨 Deal sheet (PDF) 📄 Offer letter ✓ Due diligence
Listing remarks MLS
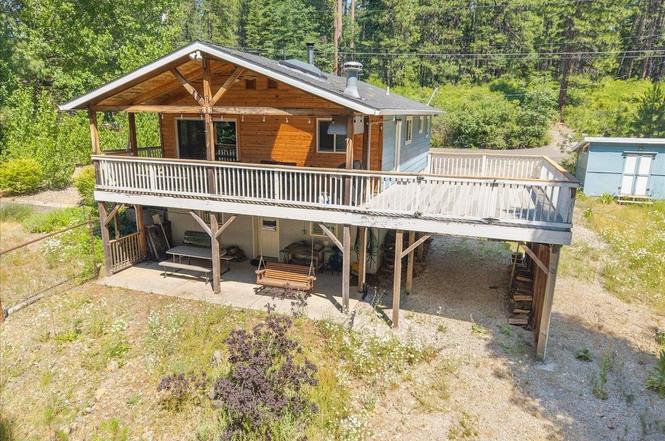
Find serenity at this lovely custom home set on over an acre just outside of the town of historic mill town of McCloud. With 4 bedrooms and 2 full bathrooms, this home has plenty of room to host families and friends in this peaceful mountain locale. This two-story home offers a full basement, currently set up as a game room with pool/ping pong table (included in the sale!). One large bedroom, a full bathroom, a laundry/utility room and large storage closet round out the basement level. Upstairs, you’ll find a cozy living room complete with wood stove, dining area that offers a large sliding glass door with access to the covered deck, and a well appointed kitchen, plus 3 bedrooms and another full bathroom. Outside, you’ll be delighted by the expansive deck space, covered patio, garden area, lawn, landscaping, storage shed and more. Located close to the recreational opportunities at the McCloud Reservoir, Golf Course, McCloud River, Mt Shasta Ski Park plus nearby dining and shopping in Downtown McCloud, this is the perfect mountain getaway or family home!
Key facts
- Bonus room
- Large covered deck
- Over an acre
Tags
Property features AI
Exterior
- Parking: Gravel parking
- Utilities: Private well water; Septic tank sewer
- Home design: Residential single-family home; 2 stories
- Construction: Composition roof
- Exterior features: Sloped lot; Lot dimensions approximately 145 x 362 x 157 x 360; Approximately 1.1 acres; Zoned RRB
Interior
- Kitchen: Dishwasher; Microwave; Electric range; Refrigerator
- Flooring: Carpet; Tile
- Heating & cooling: Wood stove heating
- Interior features: Dishwasher; Dryer; Microwave; Electric range; Refrigerator; Washer; Carpet and tile flooring; Partial basement
- Laundry & utility: Washer; Dryer
Neighborhood map
What this means for you Summary
Snapshot
- This is a 4-bed/2.0-bath single-family listed at $425k.
Deal economics
- At list price, monthly cash flow is $-352 ($-4k/yr) — negative.
- To cash-flow at today's rent, offer at most $363k (14.6% below list).
- To meet the 1% rule (rent ≥ 1% of price), the offer needs to be $305k (28.3% below list).
- Recommended offer: $305k (28.3% below list) — sets the bar for 1% rule.
Location & tenants
- Location reads 59/100 on livability (#636 in CA) — a working-class tenant base; expect higher turnover. Strengths: health & safety A+, housing B+; Watch: crime F, amenities F, commute F.
- Siskiyou Union High (rural): math 25% / reading 55% proficiency, ranked #763 of 1,400 in CA (top 54%) — families likely to look elsewhere, expect single-tenant / working-renter base with shorter leases; only 12% free/reduced lunch — higher-income household profile.
- Zoned schools: Mccloud Elementary (math 24% / reading 34%, grade F, #856 of 1,571 statewide, top 57%, 48 students, 79% FRL); Mccloud High (10 students, 50% FRL) — zoned schools average 65% FRL vs 12% district-wide (53 pts higher); higher-poverty schools than district average — tighter screening recommended.
- Market conditions: 135 active listings in the ZIP; 50 units permitted in Siskiyou County in 2024 (0 in 5+ unit buildings).
Forward outlook
- In year one you build about $45k of equity ($3k loan paydown + $42k appreciation (10.0% local appreciation)).
- Siskiyou County population projected at -26% by 2050 — secular population decline; favor cash flow + early exit over multi-decade hold.
- By year 2, paydown + projected appreciation supports a ~$73k cash-out refi (75% LTV) — recoverable capital for the next deal without selling this one.
Negotiation context
- Only 4 days on market — expect competitive offers; lowballing is unlikely to land.
- 3 sale attempts since 10y ago with the ask held roughly flat each time — persistent listings suggest the price (not the market) is what's stuck; bring a comps-based counter.
- Current owner paid $352k; 21% above their basis — modest negotiation headroom, anchor on the comps not their cost.
Risks & watch-outs
- Climate carrying-cost: major wildfire risk — expect insurance premiums to compound above CPI over the hold.
Questions for the listing agent
- What do current leases actually rent for vs. the listed asking? Can we see a recent rent roll and the last 12 months of T-12 income?
- Built in 1964 — when were the roof, HVAC, electrical panel, plumbing, and water heater last replaced?
- Is there a deadline driving the sale (1031 exchange, divorce, estate, relocation)? That informs how much negotiation room exists.
- Crime grade is F in this area — have there been break-ins, vandalism, or insurance claims at this property in the last 3 years? What carrier currently insures it and at what premium?
- The area grade is low — what's the realistic commute time and amenity access for the typical tenant pool here? Any planned neighborhood developments (good or bad) we should know about?
- What's the average days-on-market for RENTAL listings here right now (not sales)? A rising rental-DOM trend means longer vacancies and softer asking-rent achievability than the comps imply.
- What's the recent tenant-quality profile in this submarket — average credit score on applications, eviction rate, late-payment / NSF rate, and stable-employment percentage? A property-management company in the area should have these aggregated.
- How much new for-sale + rental construction is in the pipeline within 1–3 miles? Heavy new supply typically softens prices + rents 12–24 months out; constrained supply supports both.
Investment metrics
- 1% rule
- 0.72% ✗
- Cap rate
- 5.30%
- Cash-on-cash
- -3.55%
- DSCR
- 0.84
- GRM
- 11.6
CMA / ARV
- ARV (on-the-fly)
- $618,488
- Comps found
- 1
Show comp detail 1 sale within ~0.75 mi
| Address | Dist | Beds/Ba | Sqft | Sold | Price | $/sf | Match |
|---|---|---|---|---|---|---|---|
| #9 Spring Meadows Rd | 0.14mi | 3/2.0 (-1) | 1,872 (-5%) | 3mo | $585,000 | $313 | 77 |
Match score weights: distance 35% · size 25% · config 20% · recency 20%. Top-matched comps best support the ARV.
Projected returns pro-forma
10.0% appreciation · 3.0% rent growth · sell at horizon
- IRR
- 21.7%
- Equity multiple
- 2.76×
- Total profit
- $208,992
- Equity at exit
- $382,874
- IRR
- 19.6%
- Equity multiple
- 6.32×
- Total profit
- $632,942
- Equity at exit
- $825,682
Cash invested: $119,000 (down + closing). Projections, not guarantees.
Landlord ↔ Tenant lean methodology
- Overall (STATE)
- 18 Strongly Tenant-Friendly
- State California
- 18 Strongly Tenant-Friendly · D+13
- County
- — inherits STATE
- City
- — inherits STATE
ZIP-level market 96057
- Active inventory
- 135
- Price-to-rent
- 11.6×
Monthly cashflow live
- Estimated rent
- $3,046 medium interval (Pro) →
- Mortgage (P&I)
- −$2,229
- Tax from tax record
- −$352 /mo · $4,228/yr
- Insurance
- −$177
- HOA
- −$0
- Vacancy / Maint / Mgmt
- −$640
- Net cashflow
- $-352
Break-even live
Sensitivity live
| Price | -10% $-111 | -5% $-232 | +0% $-352 | +5% $-472 | +10% $-592 |
|---|---|---|---|---|---|
| Rent | -10% $-593 | -5% $-472 | +0% $-352 | +5% $-232 | +10% $-111 |
| Rate | -1.0pp $-138 | -0.5pp $-244 | base $-352 | +0.5pp $-462 | +1.0pp $-574 |
UW: 25.0% down · 7.5% · 30yr · 1.5% tax · 5.0% vac · 8.0% maint · 8.0% mgmt
Financing live
Cash to close
- Down payment
- $106,250
- Closing costs
- $12,750
- Reserves months
- —
- Total cash needed
- —
Loan-product check · same deal, 3 products live
Conventional
25% down · 7.5% · 30yr
- Down + closing
- —
- Monthly P&I
- —
- Monthly cashflow
- —
- DSCR
- —
- Eligible?
- —
Personal DTI + credit; lowest rate.
DSCR
20% down · 8.5% · 30yr
- Down + closing
- —
- Monthly P&I
- —
- Monthly cashflow
- —
- DSCR
- —
- Eligible?
- —
No personal income docs; deal must DSCR.
Hard money
10% down · 12.0% · 12mo
- Down + closing
- —
- Monthly P&I
- —
- Monthly cashflow
- —
- DSCR
- —
- Eligible?
- —
Short-term bridge; refi at stabilization.
Listing history 4 events
-
2026-06-21days on market $425,000 Active 4 DOM
-
2026-06-19days on market $425,000 Active 2 DOM
-
2026-06-17remarks 671-char remark
-
2026-06-17$425,000 Active 1 DOM
ⓘ Source: listings_history table (triggers on properties + properties_extension) + one-shot
backfill from property_details.listing_events for pre-trigger history.
Tax reassessment forecast CA · Resets to sale price
- Current annual tax
- $4,228 · $352/mo
- Projected year-2 tax
- $4,228 · $352/mo
- Expected delta
- $0/yr ($0/mo · 0.0%)
ⓘ Screening estimate from a state-policy table — verify with the county assessor before closing.
Climate risk First Street
- Flood 1/10 Low FEMA zone X (unshaded) · 0% chance over 30 yrs
- Wildfire 7/10 Severe
- Heat 4/10 Moderate 8 d/yr ≥95°F today · 20 d/yr by 30 yrs out
- Wind 1/10 Low
- Air quality 10/10 Extreme 42 unhealthy d/yr today · 43 by 30 yrs out
Nearby sold comps map
Loading sold comps map…
Walkable amenities ~0.75 mi
Loading nearby amenities…
Taxation est. · year 1
- Rental income
- $36,552
- − Mortgage interest
- −$23,807
- − Property taxes
- −$4,228
- − Insurance
- −$2,125
- − Repairs & maintenance
- −$2,924
- − Management
- −$2,924
- − Depreciation
- −$12,364
- Taxable loss
- −$11,820
- Est. tax savings @ 24.0%
- +$2,837
- After-tax cash flow
- $-1,386/yr
For passive investors: Depreciation is non-cash, so a rental often shows a tax loss while cash-flowing — sheltering income. Rental losses are passive: they offset passive income freely, and up to $25,000/yr can offset ordinary (W-2) income if you actively participate and your MAGI is under $100k (phasing out to $0 by $150k); unused losses carry forward. On sale, claimed depreciation is recaptured at up to 25%, and gains may owe capital-gains tax (a 1031 exchange can defer both). Figures are a year-1 estimate at your 24.0% rate — not tax advice; consult a CPA.
Schools (NCES district)
- District
- Siskiyou Union High
- NCES district ID
- 0636940
- Math proficiency
- 25% ▲ 5.00%
- Reading proficiency
- 55% ▲ 5.00%
- Median HH income
- $39,293
- Composite
- 35.84/100
- National rank
- #9605
- State rank
- #763 of 1400 in CA
Livability — McCloud
- Score
- 59/100
- State rank
- #636
- US rank
- #20040
Category grades
Schools grade is shown separately in the Schools card above.
Census & demographics
- Population (ZIP)
- 1,076
Population outlook (Siskiyou County) Hauer SSP2
- Today (2025)
- 39,337 people
- By 2030
- 36,930 · -6.1%
- By 2040
- 32,367 · -17.7%
- By 2050
- 29,030 · -26.2%
- By 2075
- 23,534 · -40.2%
- By 2100
- 19,312 · -50.9%
Race, ethnicity, and origin ACS 2023
- Neighborhood character
- Predominantly White (79%)
- Race & ethnicity
- White 79% Two or more races 13% Hispanic / Latino 6% Native American 3% Asian 1%
- Hispanic origin (detail)
- Mexican 5%
- Common ancestry
- Russian 6% Slovak 5% Lithuanian 3%
- Foreign-born
- 5% · Canada
- Languages at home
- 96% English-only · German/W. Germanic 1% Other Asian/Pacific 1% Spanish 1%
Political lean MEDSL · Siskiyou
- 2024 margin
- R (+19.2) · D 38.8% · R 58.0% · Other 3.2%
- 2008→2024 swing
- -8.8pp toward R · 2008: -10.4pp · 2024: -19.2pp
- All cycles
- 2024: R+19.2 2020: R+15.8 2016: R+20.7 2012: R+15.6 2008: R+10.4
Not yet ingested
- Civics
- —
Market trends
- HPI YoY
- ▲ 147.64%
- Current HPI
- 490.68
- Rent YoY
- —
- Metro
- —
- State GDP YoY
- ▲ 3.21%
- F500 in state
- 116
Industry mix (Fortune 500 HQ in CA)
| Industry | F500 HQs | Revenue |
|---|---|---|
| Technology | 27 | $1,492B |
|
||
| Financial Services | 3 | $174B |
|
||
| Retail | 3 | $44B |
|
||
| Insurance | 3 | $26B |
|
||
| Media / Entertainment | 2 | $115B |
|
||
| Pharmaceuticals / Biotech | 2 | $62B |
|
||
Price history
+47.1% since first listed7 events — show timeline
- 2026-06-17 Listed $425,000 SMLS
- 2021-03-10 Sold (Public Records) $352,500 Public Records
- 2021-03-10 Sold (MLS) $352,500 SMLS
- 2020-10-19 Listed $379,500 SMLS
- 2017-05-04 Sold (Public Records) $275,000 Public Records
- 2017-05-04 Sold (MLS) $275,000 SMLS
- 2016-09-21 Listed $289,000 SMLS
Property tax history
+7.0%/yrLatest (2025): $4,228 · +3.0% YoY. Source: county tax records.
Cash-flow waterfall
monthlySold comps — $/sqft
last 12 mo · ≤1 miLoading sold comps…