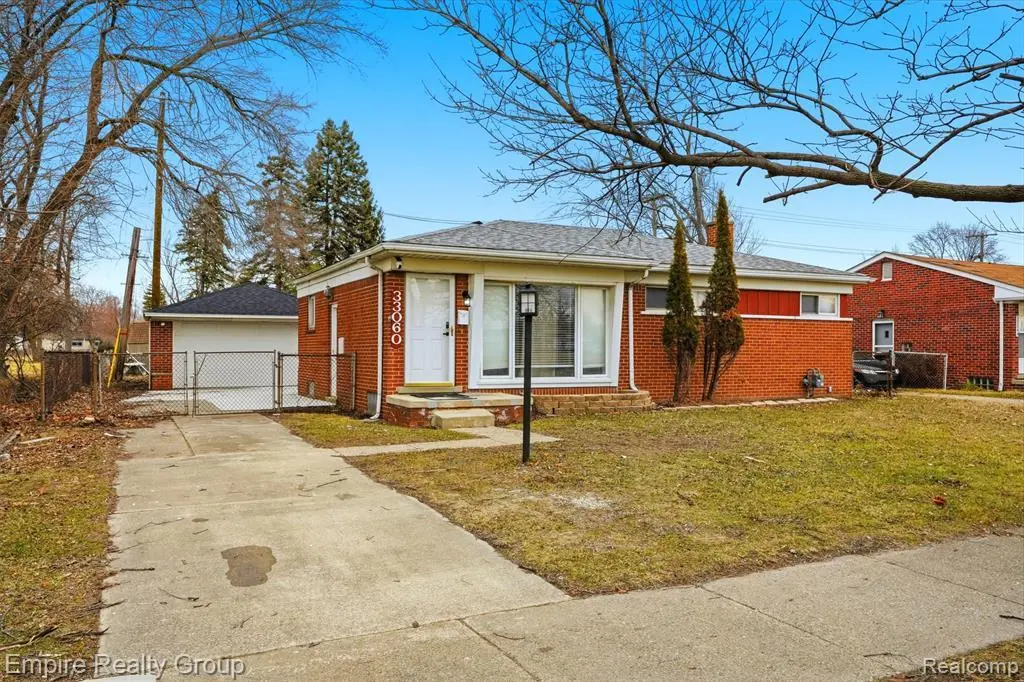
33060 Cherry Hill Rd · Garden City, MI
Flood risk 4/10 · Minor
- FEMA flood zone
- X (unshaded)
- Chance of flooding over 30 yrs
- 0.22%
- Est. flood insurance / yr
- $473 – $860
Fire risk 1/10 · Minimal
- Est. fire insurance / yr
- $784 – $1,456
Heat risk 3/10 · Minor
- Hot days now (above 97°F)
- 7 days/yr
- Hot days in 30 yrs
- 15 days/yr
Wind risk 2/10 · Minimal
- Chance of severe wind over 30 yrs
- —
Air-quality risk 2/10 · Minimal
- Unhealthy air days now
- 1 days/yr
- Unhealthy air days in 30 yrs
- 3 days/yr
Risk factors via First Street. Map © Google.
Why this score? — see what drove the F grade
The composite is a weighted blend of 9 inputs, each scored 0–100. Each bar is that input's sub-score; the figure is the points it added to the 100-point composite (weight × sub-score).
- Cash flow +7.2/30.0
- Livability +4.1/5.0
- Rent growth +3.4/5.0
- Schools +2.6/10.0
- Condition / age +2.5/5.0
- 1% rule +1.5/10.0
- DSCR +1.3/10.0
- ARV discount +0.0/15.0
- Appreciation +0.0/10.0
$244,900
🖨 Deal sheet 📄 Offer letter ✓ Due diligence
Listing remarks MLS
Welcome home to this beautifully renovated and move-in-ready 3-bedroom, 2-bath home that perfectly blends comfort, style, and functionality. Inside, you'll find tasteful updates throughout, offering modern finishes and a low-maintenance lifestyle for the next owner. The fully finished basement provides additional living space ideal for a family room, home office, gym, or entertainment area. Step outside and enjoy the spacious 30x10 deck - perfect for relaxing, hosting gatherings, or enjoying summer barbecues. A 2-car detached garage offers plenty of parking and extra storage space. With the Certificate of Occupancy already completed, this home is truly turnkey and ready for immediate move-in. Conveniently located in a desirable area, this property reflects pride of ownership throughout and offers both comfort and peace of mind. Don't miss your opportunity to own this must-see home - schedule your showing today! Buyer or Buyer's Agent to verify all information. BATVAI
Key facts
- Spacious deck
- 6,098 sq ft lot
- 2 garage spots
Tags
Property features AI
Exterior
- Parking: Detached 2-car garage
- Utilities: Public water; Public sewer
- Home design: Single-family residence; One level; Ground-level entry
- Construction: Brick exterior; Block foundation
- Exterior features: Patio; Paved road access
Interior
- Bathrooms: 2 full bathrooms
- Heating & cooling: Central air conditioning; Forced air heating (natural gas)
- Interior features: Finished basement; Total of 6 rooms
Neighborhood map
What this means for you Summary
Snapshot
- This is a 3-bed/1.0-bath single-family listed at $245k.
Deal economics
- At list price, monthly cash flow is $-341 ($-4k/yr) — negative.
- To cash-flow at today's rent, offer at most $185k (24.6% below list).
- To meet the 1% rule (rent ≥ 1% of price), the offer needs to be $159k (35.0% below list).
- Recommended offer: $159k (35.0% below list) — sets the bar for 1% rule.
- Cap rate 4.6% vs local median 5.8% in Garden City — below-typical yield; the buyer is paying a premium for something (appreciation thesis, condition, location) that the cap rate doesn't capture.
Location & tenants
- Location reads 82/100 on livability (#53 in MI, #1,047 nationally) — a professional / high-income tenant draw. Strengths: cost of living A+, housing A+, commute A; Watch: employment C-, schools D-.
- Garden City Public Schools (suburban): math 22% / reading 36% proficiency, ranked #365 of 540 in MI (top 68%) — low school quality limits family demand, transient renter base, plan for 1-2y turnover.
- Market conditions: Rents rising (+3.6%/yr); 134 active listings in the ZIP; 19 comparable units currently listed for rent nearby; rentals at typical pace (median 17d on market — plan ~3-4 weeks tenant-placement turnaround); 2,639 units permitted in Wayne County in 2024 (1,216 in 5+ unit buildings).
Forward outlook
- Local home prices are declining (-3.0%/yr); year-one equity from $2k of loan paydown is wiped out by about $7k of value loss. Plan a longer hold.
- Wayne County population projected at -17% by 2050 — secular population decline; favor cash flow + early exit over multi-decade hold.
Negotiation context
- Only 9 days on market — expect competitive offers; lowballing is unlikely to land.
- 19 sale attempts since 22y ago with the ask held roughly flat each time — persistent listings suggest the price (not the market) is what's stuck; bring a comps-based counter.
- Current owner paid $125k; list at $245k implies a 96% gain — meaningful room to come down on a strong offer.
Risks & watch-outs
- Watch-outs: built in 1955 — expect roof / HVAC / electrical / plumbing capex.
Questions for the listing agent
- What do current leases actually rent for vs. the listed asking? Can we see a recent rent roll and the last 12 months of T-12 income?
- Built in 1955 — when were the roof, HVAC, electrical panel, plumbing, and water heater last replaced?
- Is there a deadline driving the sale (1031 exchange, divorce, estate, relocation)? That informs how much negotiation room exists.
- Schools are D-rated, which usually means shorter tenancies and higher turnover. Who's the typical renter profile here, and what's been the actual vacancy rate?
- The area grade is low — what's the realistic commute time and amenity access for the typical tenant pool here? Any planned neighborhood developments (good or bad) we should know about?
- What's the average days-on-market for RENTAL listings here right now (not sales)? A rising rental-DOM trend means longer vacancies and softer asking-rent achievability than the comps imply.
- What's the recent tenant-quality profile in this submarket — average credit score on applications, eviction rate, late-payment / NSF rate, and stable-employment percentage? A property-management company in the area should have these aggregated.
- How much new for-sale + rental construction is in the pipeline within 1–3 miles? Heavy new supply typically softens prices + rents 12–24 months out; constrained supply supports both.
Investment metrics
- 1% rule
- 0.65% ✗
- Cap rate
- 4.62%
- Cash-on-cash
- -5.97%
- DSCR
- 0.73
- GRM
- 12.8
CMA / ARV
- ARV (on-the-fly)
- $193,257
- Comps found
- 12
Show comp detail 12 sales within ~0.75 mi
| Address | Dist | Beds/Ba | Sqft | Sold | Price | $/sf | Match |
|---|---|---|---|---|---|---|---|
| 413 Forest St | 0.42mi | 3/1.5 | 931 (-5%) | 1mo | $167,500 | $180 | 69 |
| 32330 Grandview Ave | 0.60mi | 3/1.0 | 999 (+2%) | 1mo | $190,000 | $190 | 68 |
| 513 S Hawthorne St | 0.50mi | 3/1.0 | 1,040 (+6%) | 2mo | $185,000 | $178 | 65 |
| 34315 Sheridan St | 0.68mi | 3/2.0 | 981 (0%) | 1mo | $189,200 | $193 | 64 |
| 33124 Marquette St | 0.51mi | 3/1.5 | 908 (-7%) | 1mo | $215,000 | $237 | 61 |
| 231 Van Sull St | 0.42mi | 3/2.5 | 1,055 (+8%) | 2mo | $237,000 | $225 | 60 |
| 32151 Grandview Ave | 0.69mi | 3/1.5 | 1,000 (+2%) | 3mo | $266,000 | $266 | 60 |
| 31966 Rosslyn Ave | 0.65mi | 3/1.0 | 939 (-4%) | 3mo | $223,000 | $237 | 60 |
| 34454 Cherry Hill Rd | 0.68mi | 3/1.0 | 1,028 (+5%) | 2mo | $200,000 | $195 | 58 |
| 31732 Alvin St | 0.71mi | 4/1.0 (+1) | 1,000 (+2%) | 0mo | $210,000 | $210 | 58 |
| 34330 Florence Ave | 0.63mi | 3/1.0 | 907 (-8%) | 1mo | $179,000 | $197 | 57 |
| 32646 Hazelwood St | 0.72mi | 2/1.5 (-1) | 950 (-3%) | 1mo | $155,000 | $163 | 53 |
Match score weights: distance 35% · size 25% · config 20% · recency 20%. Top-matched comps best support the ARV.
Projected returns pro-forma
-3.0% appreciation · 3.65% rent growth · sell at horizon
- IRR
- -25.9%
- Equity multiple
- 0.12×
- Total profit
- $-60,397
- Equity at exit
- $36,515
- IRR
- -20.8%
- Equity multiple
- -0.11×
- Total profit
- $-76,351
- Equity at exit
- $21,174
Cash invested: $68,572 (down + closing). Projections, not guarantees.
Landlord ↔ Tenant lean methodology
- Overall (STATE)
- 62 Landlord-Friendly
- State Michigan
- 62 Landlord-Friendly · EVEN
- County
- — inherits STATE
- City
- — inherits STATE
ZIP-level market 48135
- Rents YoY
- 3.6%
- Active inventory
- 134
- Price-to-rent
- 12.8×
Monthly cashflow live
- Estimated rent
- $1,591 high interval (Pro) →
- Mortgage (P&I)
- −$1,284
- Tax from tax record
- −$212 /mo · $2,544/yr
- Insurance
- −$102
- HOA
- −$0
- Vacancy / Maint / Mgmt
- −$334
- Net cashflow
- $-341
Break-even live
UW: 25.0% down · 7.5% · 30yr · 1.5% tax · 5.0% vac · 8.0% maint · 8.0% mgmt
Financing live
Cash to close
- Down payment
- $61,225
- Closing costs
- $7,347
- Reserves months
- —
- Total cash needed
- —
Loan-product check · same deal, 3 products live
Conventional
25% down · 7.5% · 30yr
- Down + closing
- —
- Monthly P&I
- —
- Monthly cashflow
- —
- DSCR
- —
- Eligible?
- —
Personal DTI + credit; lowest rate.
DSCR
20% down · 8.5% · 30yr
- Down + closing
- —
- Monthly P&I
- —
- Monthly cashflow
- —
- DSCR
- —
- Eligible?
- —
No personal income docs; deal must DSCR.
Hard money
10% down · 12.0% · 12mo
- Down + closing
- —
- Monthly P&I
- —
- Monthly cashflow
- —
- DSCR
- —
- Eligible?
- —
Short-term bridge; refi at stabilization.
Rent comps 19 comps
| Address | Beds | Baths | Sqft | Rent | $/sqft | DOM | Units | Dist |
|---|---|---|---|---|---|---|---|---|
| 33381 Florence St Garden City, MI | 3.0 | 2.0 | 1000 | $1,540 | $1.54 | 2d | 1 | 0.21mi |
| 110 Waterbury Ct Westland, MI | 2.0 | 1.0–2.0 | 581 | $1,350 | $2.32 | 2d | 7 | 0.37mi |
| 32448 Birchwood St Westland, MI | 3.0 | 1.0 | 963 | $1,675 | $1.74 | 16d | 1 | 0.53mi |
| 31217 Cherry Hill Rd Westland, MI | 3.0 | 1.0 | 1100 | $1,800 | $1.64 | 4d | 1 | 1.00mi |
| 34856 Fairchild St Westland, MI | 3.0 | 1.0 | 1013 | $1,745 | $1.72 | 11d | 1 | 1.04mi |
| 2036 Alberta St Westland, MI | 3.0 | 1.0 | 936 | $1,325 | $1.42 | 43d | 1 | 1.16mi |
| 2024 Imperial Hwy Westland, MI | 3.0 | 1.0 | 1008 | $1,600 | $1.59 | 1d | 1 | 1.25mi |
| 2040 Dryden St Westland, MI | 3.0 | 1.0 | 1100 | $1,150 | $1.05 | 18d | 1 | 1.29mi |
| 130 E Tami Cir Westland, MI | 1.0–2.0 | 1.0–1.5 | 800 | $1,209 | $1.51 | 43d | 3 | 1.30mi |
| 5995 N Wildwood St Westland, MI | 2.0 | 1.0 | 960 | $1,084 | $1.13 | 43d | 1 | 1.32mi |
| 30520 Hiveley St Westland, MI | 3.0 | 1.0 | 1105 | $1,700 | $1.54 | 22d | 1 | 1.33mi |
| 33507 Berville Ct Westland, MI | 2.0 | 1.5 | 907 | $1,350 | $1.49 | 2d | 1 | 1.34mi |
| 2264 Delton Ct Westland, MI | 3.0 | 1.5 | 1076 | $1,300 | $1.21 | 15d | 1 | 1.35mi |
| 5800 N Christine Westland, MI | 1.0–2.0 | 1.0–2.0 | 910 | $1,340 | $1.47 | 2d | 8 | 1.37mi |
| 2310 Deerfield Ct Westland, MI | 3.0 | 1.5 | 1100 | $1,125 | $1.02 | 43d | 1 | 1.37mi |
| 31820 Bay Ct Westland, MI | 2.0 | 1.0 | 834 | $1,125 | $1.35 | 16d | 1 | 1.43mi |
| 32860 Mecosta St Westland, MI | 2.0 | 1.0 | 1000 | $1,150 | $1.15 | 43d | 1 | 1.44mi |
| 32860 Mecosta St Unit 1 Westland, MI | 2.0 | 1.0 | 900 | $1,200 | $1.33 | 43d | 1 | 1.44mi |
| 34039 Cambria Ct Westland, MI | 2.0 | 1.0 | 836 | $1,395 | $1.67 | 43d | 1 | 1.46mi |
Listing history 48 events
-
2026-05-21$244,900 Active
Show marketing remark (981 chars)
Welcome home to this beautifully renovated and move-in-ready 3-bedroom, 2-bath home that perfectly blends comfort, style, and functionality. Inside, you'll find tasteful updates throughout, offering modern finishes and a low-maintenance lifestyle for the next owner. The fully finished basement provides additional living space ideal for a family room, home office, gym, or entertainment area. Step outside and enjoy the spacious 30x10 deck - perfect for relaxing, hosting gatherings, or enjoying summer barbecues. A 2-car detached garage offers plenty of parking and extra storage space. With the Certificate of Occupancy already completed, this home is truly turnkey and ready for immediate move-in. Conveniently located in a desirable area, this property reflects pride of ownership throughout and offers both comfort and peace of mind. Don't miss your opportunity to own this must-see home - schedule your showing today! Buyer or Buyer's Agent to verify all information. BATVAI
-
2026-05-21$244,900 Active 981-char remark
Show marketing remark (981 chars)
Welcome home to this beautifully renovated and move-in-ready 3-bedroom, 2-bath home that perfectly blends comfort, style, and functionality. Inside, you'll find tasteful updates throughout, offering modern finishes and a low-maintenance lifestyle for the next owner. The fully finished basement provides additional living space ideal for a family room, home office, gym, or entertainment area. Step outside and enjoy the spacious 30x10 deck - perfect for relaxing, hosting gatherings, or enjoying summer barbecues. A 2-car detached garage offers plenty of parking and extra storage space. With the Certificate of Occupancy already completed, this home is truly turnkey and ready for immediate move-in. Conveniently located in a desirable area, this property reflects pride of ownership throughout and offers both comfort and peace of mind. Don't miss your opportunity to own this must-see home - schedule your showing today! Buyer or Buyer's Agent to verify all information. BATVAI
-
2026-05-11historical
-
2026-03-22status Active
-
2026-03-22status Active
-
2026-03-12status Pending
-
2026-03-12status Pending
-
2026-02-24price $259,999
-
2026-02-23price $259,999
-
2026-02-10price $279,999
-
2026-02-10price $279,999
-
2026-01-22status Active
-
2026-01-21historical
-
2026-01-14$289,999 Active
-
2026-01-14$289,999 Active
-
2025-07-03soldstatus $125,000
-
2025-06-27soldstatus $125,000 Closed
-
2025-06-27soldstatus $125,000 Closed
-
2025-06-15status Pending
-
2025-06-15status Pending
-
2025-06-09$185,000 Active
-
2025-06-09$185,000 Active
-
2025-06-03historical $185,000
-
2012-09-21soldstatus $57,000
-
2012-09-21soldstatus $57,000
-
2012-08-15historical
-
2012-05-20$54,900
-
2012-05-20$54,900
-
2012-04-11soldstatus $31,000
-
2012-04-11soldstatus $31,000
-
2012-01-27historical
-
2012-01-27historical
-
2011-08-18$35,000
-
2011-08-18$35,000
-
2005-04-20soldstatus $134,000
-
2005-03-14soldstatus $134,000
-
2005-02-10$139,900
-
2005-02-10historical
-
2005-01-10$139,900
-
2005-01-10historical
-
2004-11-05$139,900
-
2004-11-05historical
-
2004-09-24historical
-
2004-09-22$139,900
-
2004-09-04$148,907
-
2004-09-03historical
-
2004-06-17$149,900
-
1995-03-30soldstatus $73,500
ⓘ Source: listings_history table (triggers on properties + properties_extension) + one-shot
backfill from property_details.listing_events for pre-trigger history.
Tax reassessment forecast MI · Partial reset (capped growth)
- Current annual tax
- $2,544 · $212/mo
- Projected year-2 tax
- $3,158 · $263/mo
- Expected delta
- +$614/yr (+$51/mo · 24.1%)
ⓘ Screening estimate from a state-policy table — verify with the county assessor before closing.
Climate risk First Street
- Flood 4/10 Moderate FEMA zone X (unshaded) · 22% chance over 30 yrs
- Wildfire 1/10 Low
- Heat 3/10 Moderate 7 d/yr ≥97°F today · 15 d/yr by 30 yrs out
- Wind 2/10 Low
- Air quality 2/10 Low 1 unhealthy d/yr today · 3 by 30 yrs out
Nearby sold comps map
Loading sold comps map…
Walkable amenities ~0.75 mi
Loading nearby amenities…
Taxation est. · year 1
- Rental income
- $19,097
- − Mortgage interest
- −$13,718
- − Property taxes
- −$2,544
- − Insurance
- −$1,224
- − Repairs & maintenance
- −$1,528
- − Management
- −$1,528
- − Depreciation
- −$7,124
- Taxable loss
- −$8,570
- Est. tax savings @ 24.0%
- +$2,057
- After-tax cash flow
- $-2,037/yr
For passive investors: Depreciation is non-cash, so a rental often shows a tax loss while cash-flowing — sheltering income. Rental losses are passive: they offset passive income freely, and up to $25,000/yr can offset ordinary (W-2) income if you actively participate and your MAGI is under $100k (phasing out to $0 by $150k); unused losses carry forward. On sale, claimed depreciation is recaptured at up to 25%, and gains may owe capital-gains tax (a 1031 exchange can defer both). Figures are a year-1 estimate at your 24.0% rate — not tax advice; consult a CPA.
Schools (NCES district)
- District
- Garden City Public Schools
- NCES district ID
- 2615540
- Math proficiency
- 22% ▼ -11.00%
- Reading proficiency
- 36% ▼ -13.00%
- Median HH income
- $52,165
- Composite
- 25.53/100
- National rank
- #7433
- State rank
- #365 of 540 in MI
Livability — Garden City
- Score
- 82/100
- State rank
- #53
- US rank
- #1047
Category grades
Schools grade is shown separately in the Schools card above.
Census & demographics
- Census place
- Garden City, MI
- County
- Wayne County · 1,562,939 people
- City population
- 26,739
- Metro
- Detroit-Warren-Dearborn, MI
- Population (ZIP)
- 26,739
- Household income
- $67,294
- Rent vs Own
- Severe rent burden
- 509.0
Population outlook (Wayne County) Hauer SSP2
- Today (2025)
- 1,675,273 people
- By 2030
- 1,620,300 · -3.3%
- By 2040
- 1,502,341 · -10.3%
- By 2050
- 1,384,039 · -17.4%
- By 2075
- 1,124,592 · -32.9%
- By 2100
- 881,193 · -47.4%
Race, ethnicity, and origin ACS 2023
- Neighborhood character
- Predominantly White (82%)
- Race & ethnicity
- White 82% Two or more races 8% Black 7% Hispanic / Latino 5%
- Hispanic origin (detail)
- Mexican 5%
- Common ancestry
- Romanian 13% Italian 4% Slovak 3%
- Foreign-born
- 4% · Canada
- Languages at home
- 94% English-only · Arabic 3% Spanish 1% Other Indo-European 1%
Political lean MEDSL · Wayne
- 2024 margin
- Strong D (+29.0) · D 62.7% · R 33.7% · Other 3.6%
- 2008→2024 swing
- -20.5pp toward R · 2008: 49.5pp · 2024: 29.0pp
- All cycles
- 2024: D+29.0 2020: D+38.1 2016: D+37.3 2012: D+46.9 2008: D+49.5
Not yet ingested
- Civics
- —
Market trends
- HPI YoY
- ▼ -265.28%
- Current HPI
- 212.5713
- Rent YoY
- ▲ 3.65%
- Metro
- Detroit-Warren-Dearborn, MI
- State GDP YoY
- ▲ 1.37%
- F500 in state
- 28
Industry mix (Fortune 500 HQ in MI)
| Industry | F500 HQs | Revenue |
|---|---|---|
| Automotive Parts | 3 | $48B |
|
||
| Automotive | 2 | $372B |
|
||
| Chemicals | 1 | $45B |
|
||
| Automotive Retail | 1 | $29B |
|
||
| Healthcare / Medical Devices | 1 | $23B |
|
||
| Automotive Technology | 1 | $20B |
|
||
Price history
+233.2% since first listed48 events — show timeline
- 2026-05-21 Listed $244,900 MiRealSource-MiMLS
- 2026-05-21 Listed $244,900 REALCOMP
- 2026-05-11 Listing Removed — MiRealSource-MiMLS
- 2026-03-22 Relisted — MiRealSource-MiMLS
- 2026-03-22 Relisted — REALCOMP
- 2026-03-12 Pending — MiRealSource-MiMLS
- 2026-03-12 Pending — REALCOMP
- 2026-02-24 Price Changed $259,999 MiRealSource-MiMLS
- 2026-02-23 Price Changed $259,999 REALCOMP
- 2026-02-10 Price Changed $279,999 MiRealSource-MiMLS
- 2026-02-10 Price Changed $279,999 REALCOMP
- 2026-01-22 Relisted — REALCOMP
- 2026-01-21 Listing Removed — REALCOMP
- 2026-01-14 Listed $289,999 REALCOMP
- 2026-01-14 Listed $289,999 MiRealSource-MiMLS
- 2025-07-03 Sold (Public Records) $125,000 Public Records
- 2025-06-27 Sold (MLS) $125,000 MiRealSource-MiMLS
- 2025-06-27 Sold (MLS) $125,000 REALCOMP
- 2025-06-15 Pending — MiRealSource-MiMLS
- 2025-06-15 Pending — REALCOMP
- 2025-06-09 Listed $185,000 MiRealSource-MiMLS
- 2025-06-09 Listed $185,000 REALCOMP
- 2025-06-03 Coming Soon $185,000 MiRealSource-MiMLS
- 2012-09-21 Sold (MLS) $57,000 MiRealSource-MiMLS
- 2012-09-21 Sold (MLS) $57,000 REALCOMP
- 2012-08-15 Listing Removed — MiRealSource-MiMLS
- 2012-05-20 Listed $54,900 MiRealSource-MiMLS
- 2012-05-20 Listed $54,900 REALCOMP
- 2012-04-11 Sold (MLS) $31,000 REALCOMP
- 2012-04-11 Sold (MLS) $31,000 MiRealSource-MiMLS
- 2012-01-27 Listing Removed — REALCOMP
- 2012-01-27 Listing Removed — MiRealSource-MiMLS
- 2011-08-18 Listed $35,000 REALCOMP
- 2011-08-18 Listed $35,000 MiRealSource-MiMLS
- 2005-04-20 Sold (Public Records) $134,000 Public Records
- 2005-03-14 Sold (MLS) $134,000 REALCOMP
- 2005-02-10 Listing Removed — REALCOMP
- 2005-02-10 Listed $139,900 REALCOMP
- 2005-01-10 Listing Removed — REALCOMP
- 2005-01-10 Listed $139,900 REALCOMP
- 2004-11-05 Listing Removed — REALCOMP
- 2004-11-05 Listed $139,900 REALCOMP
- 2004-09-24 Listing Removed — REALCOMP
- 2004-09-22 Listed $139,900 REALCOMP
- 2004-09-04 Listed $148,907 REALCOMP
- 2004-09-03 Listing Removed — REALCOMP
- 2004-06-17 Listed $149,900 REALCOMP
- 1995-03-30 Sold (Public Records) $73,500 Public Records
Property tax history
+1.9%/yrLatest (2025): $2,544 · -11.2% YoY. Source: county tax records.
Cash-flow waterfall
monthlySold comps — $/sqft
last 12 mo · ≤1 miLoading sold comps…