550 Pine Grove Rd · Floral, AR
Flood risk 1/10 · Minimal
- FEMA flood zone
- X (unshaded)
- Chance of flooding over 30 yrs
- 0.0%
- Est. flood insurance / yr
- $507 – $1,088
Fire risk 7/10 · Major
- Est. fire insurance / yr
- $1,499 – $2,785
Heat risk 4/10 · Minor
- Hot days now (above 106°F)
- 7 days/yr
- Hot days in 30 yrs
- 19 days/yr
Wind risk 3/10 · Minor
- Chance of severe wind over 30 yrs
- 6.0%
Air-quality risk 2/10 · Minimal
- Unhealthy air days now
- 0 days/yr
- Unhealthy air days in 30 yrs
- 1 days/yr
Risk factors via First Street. Map © Google.
Why this score? — see what drove the D grade
The composite is a weighted blend of 9 inputs, each scored 0–100. Each bar is that input's sub-score; the figure is the points it added to the 100-point composite (weight × sub-score).
- Cash flow +13.6/30.0
- ARV discount +7.5/15.0
- Appreciation +5.0/10.0
- DSCR +4.1/10.0
- 1% rule +2.9/10.0
- Rent growth +2.5/5.0
- Livability +2.5/5.0
- Condition / age +2.5/5.0
- Schools +2.0/10.0
$129,000
🖨 Deal sheet (PDF) 📄 Offer letter ✓ Due diligence
Listing remarks
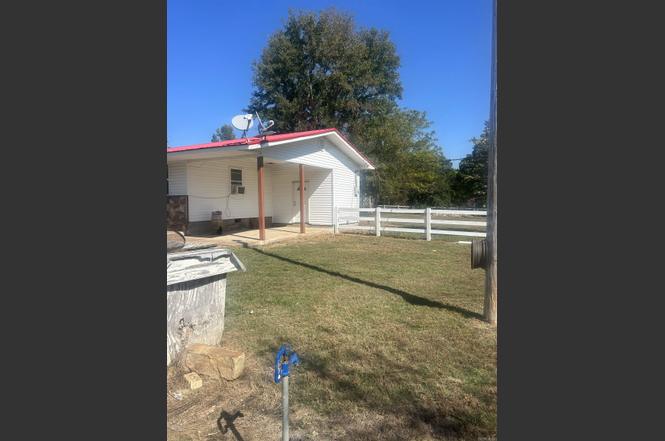
1188 Sq Ft, 3 Bedrooms, 1 Bathroom Discover this charming and recently updated. With 1,188 square feet of living space, this property offers comfort, convenience, and modern updates ideal for families or anyone seeking a move-in ready residence. This inviting home features three spacious bedrooms and one full bathroom. Recent updates include new flooring and new floor coverings throughout, creating a clean and contemporary atmosphere. Laundry room, the kitchen comes equipped with a stove and refrigerator, both included with the property, For climate control, the house offers a window air conditioning unit and an infrared heater; there is no central air or central heat. The exterior boasts a
Key facts
- Metal roof
- Recently updated
- Laundry room
Tags
Neighborhood map
What this means for you Summary
Snapshot
- This is a 3-bed/1.0-bath single-family listed at $129k.
Deal economics
- At list price, monthly cash flow is $6 ($78/yr) — positive.
- The deal already cash-flows at list — no discount required.
- To meet the 1% rule (rent ≥ 1% of price), the offer needs to be $101k (21.4% below list).
- Recommended offer: $101k (21.4% below list) — sets the bar for 1% rule.
Location & tenants
- Location reads: area grade D — affects rentability + tenant quality, not the cash-flow math above.
- Midland School District (rural): math 19% / reading 28% proficiency, ranked #191 of 238 in AR (top 80%) — low school quality limits family demand, transient renter base, plan for 1-2y turnover.
- Zoned schools: Midland Elementary School (math 22% / reading 27%, grade F, #347 of 454 statewide, top 79%, 277 students, 68% FRL); Midland High School (math 17% / reading 32%, grade F, #187 of 292 statewide, top 70%, 234 students, 58% FRL).
- Market conditions: 6 active listings in the ZIP; 33 units permitted in Independence County in 2024 (24 in 5+ unit buildings).
Forward outlook
- In year one you build about $5k of equity ($892 loan paydown + $4k appreciation (3.0% local appreciation)).
- At projected returns (3.0% appreciation + 3.0% rent growth), your $36k cash investment doubles in ~7 years — after that, you're playing with house money.
- By year 7, paydown + projected appreciation supports a ~$30k cash-out refi (75% LTV) — recoverable capital for the next deal without selling this one.
Negotiation context
- It's been on market 50 days — a 3% lower offer ($125k) is reasonable based on typical stale-listing flexibility.
Risks & watch-outs
- Climate carrying-cost: major wildfire risk — expect insurance premiums to compound above CPI over the hold.
Questions for the listing agent
- It's been on market 50 days. Have you received any prior offers? Is the seller open to a 21% concession, seller financing, or rate buy-down credit?
- Built in 1970 — when were the roof, HVAC, electrical panel, plumbing, and water heater last replaced?
- Is there a deadline driving the sale (1031 exchange, divorce, estate, relocation)? That informs how much negotiation room exists.
- The area grade is low — what's the realistic commute time and amenity access for the typical tenant pool here? Any planned neighborhood developments (good or bad) we should know about?
- What's the average days-on-market for RENTAL listings here right now (not sales)? A rising rental-DOM trend means longer vacancies and softer asking-rent achievability than the comps imply.
- What's the recent tenant-quality profile in this submarket — average credit score on applications, eviction rate, late-payment / NSF rate, and stable-employment percentage? A property-management company in the area should have these aggregated.
- How much new for-sale + rental construction is in the pipeline within 1–3 miles? Heavy new supply typically softens prices + rents 12–24 months out; constrained supply supports both.
Investment metrics
- 1% rule
- 0.79% ✗
- Cap rate
- 6.35%
- Cash-on-cash
- 0.22%
- DSCR
- 1.01
- GRM
- 10.6
CMA / ARV
No comps found within radius.
Projected returns pro-forma
3.0% appreciation · 3.0% rent growth · sell at horizon
- IRR
- 7.7%
- Equity multiple
- 1.44×
- Total profit
- $15,908
- Equity at exit
- $58,004
- IRR
- 10.3%
- Equity multiple
- 2.55×
- Total profit
- $56,014
- Equity at exit
- $89,391
Cash invested: $36,120 (down + closing). Projections, not guarantees.
Landlord ↔ Tenant lean methodology
- Overall (STATE)
- 92 Strongly Landlord-Friendly
- State Arkansas
- 92 Strongly Landlord-Friendly · R+14
- County
- — inherits STATE
- City
- — inherits STATE
ZIP-level market 72523
- Active inventory
- 6
- Price-to-rent
- 10.6×
Monthly cashflow live
- Estimated rent
- $1,014 medium interval (Pro) →
- Mortgage (P&I)
- −$676
- Tax from tax record
- −$65 /mo · $774/yr
- Insurance
- −$54
- HOA
- −$0
- Vacancy / Maint / Mgmt
- −$213
- Net cashflow
- $6
Break-even live
Sensitivity live
| Price | -10% $80 | -5% $43 | +0% $6 | +5% $-30 | +10% $-67 |
|---|---|---|---|---|---|
| Rent | -10% $-74 | -5% $-34 | +0% $6 | +5% $47 | +10% $87 |
| Rate | -1.0pp $71 | -0.5pp $39 | base $6 | +0.5pp $-27 | +1.0pp $-61 |
UW: 25.0% down · 7.5% · 30yr · 1.5% tax · 5.0% vac · 8.0% maint · 8.0% mgmt
Financing live
Cash to close
- Down payment
- $32,250
- Closing costs
- $3,870
- Reserves months
- —
- Total cash needed
- —
Loan-product check · same deal, 3 products live
Conventional
25% down · 7.5% · 30yr
- Down + closing
- —
- Monthly P&I
- —
- Monthly cashflow
- —
- DSCR
- —
- Eligible?
- —
Personal DTI + credit; lowest rate.
DSCR
20% down · 8.5% · 30yr
- Down + closing
- —
- Monthly P&I
- —
- Monthly cashflow
- —
- DSCR
- —
- Eligible?
- —
No personal income docs; deal must DSCR.
Hard money
10% down · 12.0% · 12mo
- Down + closing
- —
- Monthly P&I
- —
- Monthly cashflow
- —
- DSCR
- —
- Eligible?
- —
Short-term bridge; refi at stabilization.
Listing history 3 events
-
2026-01-05soldstatus $129,000
-
2025-12-10status Under Contract
-
2025-10-16$129,000 New Listing
ⓘ Source: listings_history table (triggers on properties + properties_extension) + one-shot
backfill from property_details.listing_events for pre-trigger history.
Tax reassessment forecast AR · Resets to sale price
- Current annual tax
- $774 · $65/mo
- Projected year-2 tax
- $826 · $69/mo
- Expected delta
- +$51/yr (+$4/mo · 6.6%)
ⓘ Screening estimate from a state-policy table — verify with the county assessor before closing.
Climate risk First Street
- Flood 1/10 Low FEMA zone X (unshaded) · 0% chance over 30 yrs
- Wildfire 7/10 Severe
- Heat 4/10 Moderate 7 d/yr ≥106°F today · 19 d/yr by 30 yrs out
- Wind 3/10 Moderate 6% chance of damaging wind over 30 yrs
- Air quality 2/10 Low 0 unhealthy d/yr today · 1 by 30 yrs out
Nearby sold comps map
Loading sold comps map…
Walkable amenities ~0.75 mi
Loading nearby amenities…
Taxation est. · year 1
- Rental income
- $12,171
- − Mortgage interest
- −$7,226
- − Property taxes
- −$774
- − Insurance
- −$645
- − Repairs & maintenance
- −$974
- − Management
- −$974
- − Depreciation
- −$3,753
- Taxable loss
- −$2,175
- Est. tax savings @ 24.0%
- +$522
- After-tax cash flow
- $600/yr
For passive investors: Depreciation is non-cash, so a rental often shows a tax loss while cash-flowing — sheltering income. Rental losses are passive: they offset passive income freely, and up to $25,000/yr can offset ordinary (W-2) income if you actively participate and your MAGI is under $100k (phasing out to $0 by $150k); unused losses carry forward. On sale, claimed depreciation is recaptured at up to 25%, and gains may owe capital-gains tax (a 1031 exchange can defer both). Figures are a year-1 estimate at your 24.0% rate — not tax advice; consult a CPA.
Schools (NCES district)
- District
- Midland School District
- NCES district ID
- 0500020
- Math proficiency
- 19% ▼ -2.00%
- Reading proficiency
- 28% ▼ -3.00%
- Median HH income
- $38,543
- Composite
- 19.69/100
- National rank
- #8726
- State rank
- #191 of 238 in AR
Livability — Floral
No livability data for this city. (Only ~50 U.S. cities are tracked.)
Census & demographics
- Population (ZIP)
- 793
Population outlook (Independence County) Hauer SSP2
- Today (2025)
- 37,748 people
- By 2030
- 37,962 · +0.6%
- By 2040
- 38,151 · +1.1%
- By 2050
- 37,980 · +0.6%
- By 2075
- 36,622 · -3.0%
- By 2100
- 32,741 · -13.3%
Race, ethnicity, and origin ACS 2023
- Neighborhood character
- Predominantly White (93%)
- Race & ethnicity
- White 93% Two or more races 5% Asian 2%
- Common ancestry
- Iranian 1% Serbian 1% Italian 1%
Political lean MEDSL · Independence
- 2024 margin
- Solid R (+59.5) · D 19.2% · R 78.7% · Other 2.1%
- 2008→2024 swing
- -22.3pp toward R · 2008: -37.1pp · 2024: -59.5pp
- All cycles
- 2024: R+59.5 2020: R+58.2 2016: R+52.4 2012: R+44.0 2008: R+37.1
Not yet ingested
- Civics
- —
Market trends
- HPI YoY
- —
- Current HPI
- —
- Rent YoY
- —
- Metro
- —
- State GDP YoY
- ▲ 3.80%
- F500 in state
- 10
Industry mix (Fortune 500 HQ in AR)
| Industry | F500 HQs | Revenue |
|---|---|---|
| Retail | 1 | $681B |
|
||
| Food / Agriculture | 1 | $53B |
|
||
| Retail / Energy | 1 | $22B |
|
||
| Transportation / Logistics | 1 | $12B |
|
||
| Energy | 1 | $4B |
|
||
Price history
+0.0% since first listed3 events — show timeline
- 2026-01-05 Sold (Public Records) $129,000 Public Records
- 2025-12-10 Pending — CARMLS
- 2025-10-16 Listed $129,000 CARMLS
Property tax history
+8.1%/yrLatest (2025): $774 · +16.9% YoY. Source: county tax records.
Cash-flow waterfall
monthlySold comps — $/sqft
last 12 mo · ≤1 miLoading sold comps…