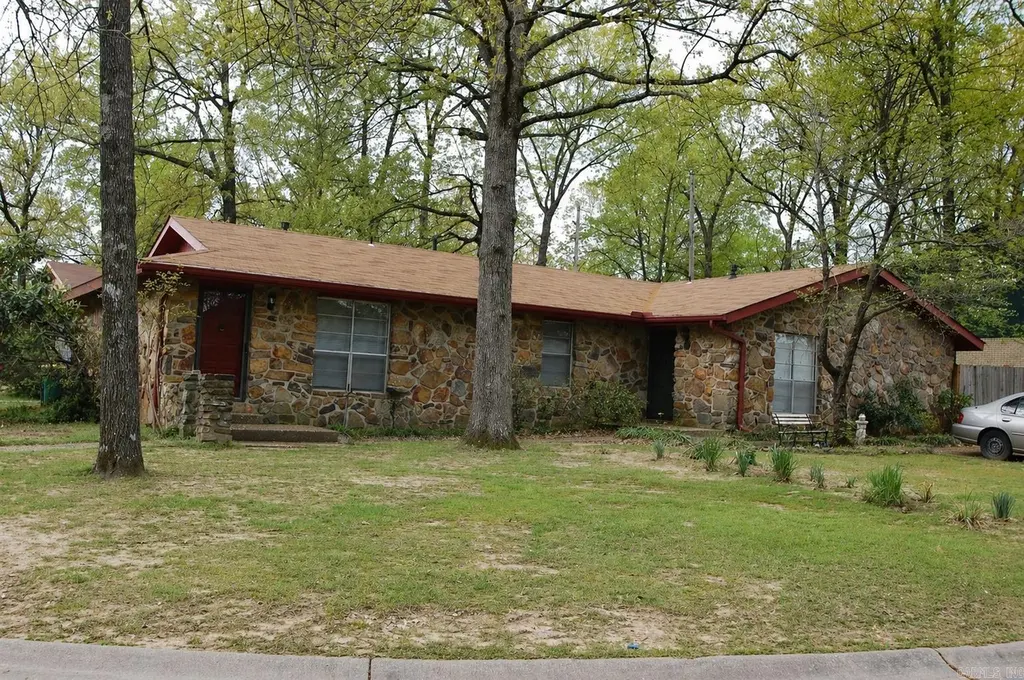
6102 N Woodview Dr · Sherwood, AR
Flood risk 1/10 · Minimal
- FEMA flood zone
- X (unshaded)
- Chance of flooding over 30 yrs
- 0.0%
- Est. flood insurance / yr
- $507 – $1,088
Fire risk 4/10 · Minor
- Est. fire insurance / yr
- $1,499 – $2,785
Heat risk 7/10 · Major
- Hot days now (above 111°F)
- 7 days/yr
- Hot days in 30 yrs
- 18 days/yr
Wind risk 3/10 · Minor
- Chance of severe wind over 30 yrs
- 8.0%
Air-quality risk 2/10 · Minimal
- Unhealthy air days now
- 2 days/yr
- Unhealthy air days in 30 yrs
- 2 days/yr
Risk factors via First Street. Map © Google.
Why this score? — see what drove the D+ grade
The composite is a weighted blend of 9 inputs, each scored 0–100. Each bar is that input's sub-score; the figure is the points it added to the 100-point composite (weight × sub-score).
- Cash flow +23.8/30.0
- DSCR +7.7/10.0
- 1% rule +5.6/10.0
- Rent growth +3.7/5.0
- Livability +3.7/5.0
- Schools +2.6/10.0
- Condition / age +2.5/5.0
- ARV discount +0.0/15.0
- Appreciation +0.0/10.0
$187,500
🖨 Deal sheet (PDF) 📄 Offer letter ✓ Due diligence
Listing remarks
Remodeled duplex in the heart of Sherwood that is tenant occupied. Looking to add to your portfolio? Starting your Real Estate journey? Opportunity to add value to these units. Long term tenants. Each unit is 2 Bed and 1 Bath with 987 sq/ft each. Off the street parking. In unit laundry. Corner lot. These units have access to highway, restaurants, shopping, and hospital systems. No showing until under contact / please do not disturb the tenants. See agent remarks.
Key facts
- Remodeled duplex
- In unit laundry
- Access to highway
Tags
Property features AI
Finance
- Other: Approximate lot acreage: 0.17 acre; Approximate building size (total): 1,974 (source: tax records); Each unit approx. 987 (source: tax records)
- Financial info: Potential financing: Cash, FHA, Conventional, VA; Monthly lease type; Two rental units with rents for 2-bedroom units ranging from $675 to $825; Expenses (included): Taxes, insurance, and other (see remarks); Tenant expenses: other (see remarks)
Exterior
- Parking: Parking pads
- Utilities: Municipal electric; Natural gas; Public water; Public sewer; Private telephone service
- Home design: Two-unit (multifamily) property; Zoned residential; Inside city limits
- Construction: Slab foundation; Composition roof (plus other — see remarks)
- Exterior features: Level corner lot in a subdivision; Paved road access; Stone and rock exterior
Interior
- Kitchen: Built-in stove; Electric range; Dishwasher; Exhaust fan
- Bedrooms: Two 2-bedroom units
- Flooring: Partial carpet; Vinyl
- Bathrooms: Two 1-bath units
- Heating & cooling: Central gas heat; Central electric cooling
- Interior features: Washer and dryer connections (dryer is electric); Ceiling fans; Window treatments
- Laundry & utility: Washer connection; Dryer connection (electric)
Neighborhood map
What this means for you Summary
Snapshot
- This is a 4-bed/2.0-bath other listed at $188k.
Deal economics
- At list price, monthly cash flow is $361 ($4k/yr) — positive.
- The deal already cash-flows at list — no discount required.
- Meets the 1% rule at list price ($2k rent vs $188k).
- Recommended offer: $182k (3.0% below list) — sets the bar for market timing.
- Cap rate 8.6% vs local median 4.4% in Sherwood — top-decile yield for the area; either an underpriced asset or a hidden risk that comps aren't pricing in. Stress-test before assuming the spread holds.
Location & tenants
- Location reads 73/100 on livability (#19 in AR) — a middle-class / working-renter tenant base. Strengths: cost of living A+, housing A+, health & safety A+; Watch: crime F, amenities F, commute F.
- Pulaski County Spec. School District (rural): math 27% / reading 31% proficiency, ranked #150 of 238 in AR (top 63%) — low school quality limits family demand, transient renter base, plan for 1-2y turnover.
- Zoned schools: Clinton Elementary School (math 20% / reading 16%, grade F, #393 of 454 statewide, top 87%, 567 students, 97% FRL); Sylvan Hills Middle School (math 26% / reading 30%, grade F, #150 of 201 statewide, top 76%, 1,122 students, 52% FRL); Sylvan Hills High School (math 16% / reading 29%, grade F, #211 of 292 statewide, top 73%, 1,017 students, 38% FRL).
- Market conditions: Rents rising fast (+4.8%/yr); 249 active listings in the ZIP; 19 comparable units currently listed for rent nearby; rentals lingering (median 45d on market — plan ~5-8 weeks vacancy on turnover, expect pricing pressure); 53% of comp listings sitting > 30 days — soft ceiling on asking rent; solid renter incomes; 1,006 units permitted in Pulaski County in 2024 (0 in 5+ unit buildings).
- This rent runs 31% of the median local income ($77k/yr) — at the standard rent-burdened threshold; future hikes will face affordability resistance.
Forward outlook
- Local home prices are declining (-3.0%/yr); year-one equity from $1k of loan paydown is wiped out by about $6k of value loss. Plan a longer hold.
- Pulaski County population projected at +6% by 2050 — modest demand growth; plan on rents tracking national, not racing it.
- At projected returns (-3.0% appreciation + 4.8% rent growth), your $52k cash investment doubles in ~10 years — after that, you're playing with house money.
Negotiation context
- It's been on market 45 days — a 3% lower offer ($182k) is reasonable based on typical stale-listing flexibility.
- Current owner paid $78k; list at $188k implies a 140% gain — meaningful room to come down on a strong offer.
Risks & watch-outs
- Climate carrying-cost: extreme-heat days projected 7→18/yr by 2055 (HVAC capex compounding) — expect insurance premiums to compound above CPI over the hold.
Questions for the listing agent
- It's been on market 45 days. Have you received any prior offers? Is the seller open to a 3% concession, seller financing, or rate buy-down credit?
- Built in 1973 — when were the roof, HVAC, electrical panel, plumbing, and water heater last replaced?
- Is there a deadline driving the sale (1031 exchange, divorce, estate, relocation)? That informs how much negotiation room exists.
- Crime grade is F in this area — have there been break-ins, vandalism, or insurance claims at this property in the last 3 years? What carrier currently insures it and at what premium?
- The area grade is low — what's the realistic commute time and amenity access for the typical tenant pool here? Any planned neighborhood developments (good or bad) we should know about?
- What's the average days-on-market for RENTAL listings here right now (not sales)? A rising rental-DOM trend means longer vacancies and softer asking-rent achievability than the comps imply.
- What's the recent tenant-quality profile in this submarket — average credit score on applications, eviction rate, late-payment / NSF rate, and stable-employment percentage? A property-management company in the area should have these aggregated.
- How much new for-sale + rental construction is in the pipeline within 1–3 miles? Heavy new supply typically softens prices + rents 12–24 months out; constrained supply supports both.
Investment metrics
- 1% rule
- 1.06% ✓
- Cap rate
- 8.60%
- Cash-on-cash
- 8.24%
- DSCR
- 1.37
- GRM
- 7.9
CMA / ARV
- ARV (median comp)
- $129,078
- List price
- $187,500
- Delta
- 45.26%
- Verdict
- OVERPRICED
- Comps
- 6 within 1.0 mi
Projected returns pro-forma
-3.0% appreciation · 4.81% rent growth · sell at horizon
- IRR
- -1.9%
- Equity multiple
- 0.93×
- Total profit
- $-3,750
- Equity at exit
- $27,957
- IRR
- 9.6%
- Equity multiple
- 1.80×
- Total profit
- $41,912
- Equity at exit
- $16,212
Cash invested: $52,500 (down + closing). Projections, not guarantees.
Landlord ↔ Tenant lean methodology
- Overall (STATE)
- 92 Strongly Landlord-Friendly
- State Arkansas
- 92 Strongly Landlord-Friendly · R+14
- County
- — inherits STATE
- City
- — inherits STATE
ZIP-level market 72120
- Rents YoY
- 4.8%
- Active inventory
- 249
- Price-to-rent
- 7.9×
Monthly cashflow live
- Estimated rent
- $1,988 high interval (Pro) →
- Mortgage (P&I)
- −$983
- Tax from tax record
- −$148 /mo · $1,781/yr
- Insurance
- −$78
- HOA
- −$0
- Vacancy / Maint / Mgmt
- −$417
- Net cashflow
- $361
Break-even live
Sensitivity live
| Price | -10% $467 | -5% $414 | +0% $361 | +5% $308 | +10% $255 |
|---|---|---|---|---|---|
| Rent | -10% $204 | -5% $282 | +0% $361 | +5% $439 | +10% $518 |
| Rate | -1.0pp $455 | -0.5pp $408 | base $361 | +0.5pp $312 | +1.0pp $263 |
UW: 25.0% down · 7.5% · 30yr · 1.5% tax · 5.0% vac · 8.0% maint · 8.0% mgmt
Financing live
Cash to close
- Down payment
- $46,875
- Closing costs
- $5,625
- Reserves months
- —
- Total cash needed
- —
Loan-product check · same deal, 3 products live
Conventional
25% down · 7.5% · 30yr
- Down + closing
- —
- Monthly P&I
- —
- Monthly cashflow
- —
- DSCR
- —
- Eligible?
- —
Personal DTI + credit; lowest rate.
DSCR
20% down · 8.5% · 30yr
- Down + closing
- —
- Monthly P&I
- —
- Monthly cashflow
- —
- DSCR
- —
- Eligible?
- —
No personal income docs; deal must DSCR.
Hard money
10% down · 12.0% · 12mo
- Down + closing
- —
- Monthly P&I
- —
- Monthly cashflow
- —
- DSCR
- —
- Eligible?
- —
Short-term bridge; refi at stabilization.
Rent comps 19 comps
| Address | Beds | Baths | Sqft | Rent | $/sqft | DOM | Units | Dist |
|---|---|---|---|---|---|---|---|---|
| 511 Briar St Sherwood, AR | 3.0 | 2.0 | 1248 | $2,500 | $2.00 | 45d | 1 | 0.44mi |
| 104 Willow Grove Rd Sherwood, AR | 4.0 | 2.0 | 1710 | $1,736 | $1.02 | 45d | 1 | 0.57mi |
| 105 King Pine Rd Sherwood, AR | 3.0 | 2.0 | 1362 | $1,500 | $1.10 | 25d | 1 | 0.63mi |
| 8214 Bronco Ln Sherwood, AR | 3.0 | 2.0 | 1680 | $1,495 | $0.89 | 45d | 1 | 0.75mi |
| 6756 Austin Harbor Loop Sherwood, AR | 4.0 | 2.0 | 2263 | $2,600 | $1.15 | 45d | 1 | 0.77mi |
| 2211 E Maryland Ave Sherwood, AR | 3.0 | 2.0 | 1421 | $1,635 | $1.15 | 45d | 1 | 0.89mi |
| 617 Brierly Dr Sherwood, AR | 3.0 | 1.5 | 1242 | $1,075 | $0.87 | 25d | 1 | 0.91mi |
| 125 Jessica Dr Sherwood, AR | 3.0 | 2.0 | 1788 | $1,785 | $1.00 | 45d | 1 | 0.93mi |
| 1301 Stafford Rd Sherwood, AR | 3.0 | 2.0 | 1721 | $1,625 | $0.94 | 45d | 1 | 0.96mi |
| 2616 Point River Cv Sherwood, AR | 3.0 | 2.0 | 2520 | $2,495 | $0.99 | 25d | 1 | 1.12mi |
| 3280 Overcup Dr Sherwood, AR | 4.0 | 2.5 | 2071 | $2,475 | $1.20 | 25d | 1 | 1.18mi |
| 8708 Patricia Lynn Ln Sherwood, AR | 3.0 | 2.0 | 1918 | $1,695 | $0.88 | 45d | 1 | 1.21mi |
| 8702 Oakhaven Dr Sherwood, AR | 3.0 | 2.0 | 1364 | $1,695 | $1.24 | 22d | 1 | 1.27mi |
| 4073 Willow Glen Cir Sherwood, AR | 3.0 | 2.0 | 2024 | $2,000 | $0.99 | 25d | 1 | 1.28mi |
| 8707 Oakhaven Dr Sherwood, AR | 3.0 | 2.0 | 1543 | $1,611 | $1.04 | 15d | 1 | 1.30mi |
| 8606 Holiday Dr Sherwood, AR | 3.0 | 2.0 | 1450 | $1,525 | $1.05 | 45d | 1 | 1.33mi |
| 1004 Country Club Rd Sherwood, AR | 3.0 | 2.0 | 1400 | $2,400 | $1.71 | 15d | 1 | 1.39mi |
| 7231 Gap Meadows Dr Sherwood, AR | 3.0 | 2.0 | 1850 | $1,795 | $0.97 | 20d | 1 | 1.41mi |
| 4 Shiloh Pl Sherwood, AR | 3.0 | 2.0 | 1450 | $2,900 | $2.00 | 45d | 1 | 1.49mi |
Listing history 19 events
-
2026-06-21days on market $187,500 Active 45 DOM
-
2026-06-18days on market $187,500 Active 42 DOM
-
2026-06-17days on market $187,500 Active 41 DOM
-
2026-06-16days on market $187,500 Active 40 DOM
-
2026-06-15days on market $187,500 Active 39 DOM
-
2026-06-14days on market $187,500 Active 37 DOM
-
2026-06-13days on market $187,500 Active 36 DOM
-
2026-06-10days on market $187,500 Active 34 DOM
-
2026-06-09days on market $187,500 Active 33 DOM
-
2026-06-08days on market $187,500 Active 32 DOM
-
2026-06-07days on market $187,500 Active 31 DOM
-
2026-06-05days on market $187,500 Active 28 DOM
-
2026-06-03days on market $187,500 Active 27 DOM
-
2026-06-02days on market $187,500 Active 26 DOM
-
2026-06-01days on market $187,500 Active 25 DOM
-
2026-05-31days on market $187,500 Active 24 DOM
-
2026-05-31days on market $187,500 Active 23 DOM
-
2026-05-07$187,500 New Listing 468-char remark
-
2013-05-02soldstatus $78,000
ⓘ Source: listings_history table (triggers on properties + properties_extension) + one-shot
backfill from property_details.listing_events for pre-trigger history.
Tax reassessment forecast AR · Resets to sale price
- Current annual tax
- $1,781 · $148/mo
- Projected year-2 tax
- $1,781 · $148/mo
- Expected delta
- $0/yr ($0/mo · 0.0%)
ⓘ Screening estimate from a state-policy table — verify with the county assessor before closing.
Climate risk First Street
- Flood 1/10 Low FEMA zone X (unshaded) · 0% chance over 30 yrs
- Wildfire 4/10 Moderate
- Heat 7/10 Severe 7 d/yr ≥111°F today · 18 d/yr by 30 yrs out
- Wind 3/10 Moderate 8% chance of damaging wind over 30 yrs
- Air quality 2/10 Low 2 unhealthy d/yr today · 2 by 30 yrs out
Nearby sold comps map
Loading sold comps map…
Walkable amenities ~0.75 mi
Loading nearby amenities…
Taxation est. · year 1
- Rental income
- $23,855
- − Mortgage interest
- −$10,503
- − Property taxes
- −$1,781
- − Insurance
- −$938
- − Repairs & maintenance
- −$1,908
- − Management
- −$1,908
- − Depreciation
- −$5,455
- Taxable income
- $1,362
- Est. tax owed @ 24.0%
- −$327
- After-tax cash flow
- $4,001/yr
For passive investors: Depreciation is non-cash, so a rental often shows a tax loss while cash-flowing — sheltering income. Rental losses are passive: they offset passive income freely, and up to $25,000/yr can offset ordinary (W-2) income if you actively participate and your MAGI is under $100k (phasing out to $0 by $150k); unused losses carry forward. On sale, claimed depreciation is recaptured at up to 25%, and gains may owe capital-gains tax (a 1031 exchange can defer both). Figures are a year-1 estimate at your 24.0% rate — not tax advice; consult a CPA.
Schools (NCES district)
- District
- Pulaski County Spec. School District
- NCES district ID
- 0511850
- Math proficiency
- 27% ▼ -13.00%
- Reading proficiency
- 31% ▼ -10.00%
- Median HH income
- $53,218
- Composite
- 25.67/100
- National rank
- #7394
- State rank
- #150 of 238 in AR
Livability — Sherwood
- Score
- 73/100
- State rank
- #19
- US rank
- #5246
Category grades
Schools grade is shown separately in the Schools card above.
Census & demographics
- Census place
- Sherwood, AR
- County
- Pulaski County · 372,764 people
- City population
- 34,365
- Metro
- Little Rock-North Little Rock-Conway, AR
- Population (ZIP)
- 34,365
- Household income
- $76,598
- Rent vs Own
- Severe rent burden
- 774.0
Population outlook (Pulaski County) Hauer SSP2
- Today (2025)
- 415,378 people
- By 2030
- 423,720 · +2.0%
- By 2040
- 435,182 · +4.8%
- By 2050
- 440,904 · +6.1%
- By 2075
- 445,521 · +7.3%
- By 2100
- 419,173 · +0.9%
Race, ethnicity, and origin ACS 2023
- Neighborhood character
- Predominantly White (65%)
- Race & ethnicity
- White 65% Black 26% Two or more races 5% Hispanic / Latino 4% Asian 1%
- Common ancestry
- Lithuanian 2% Slovak 1% Italian 1%
- Foreign-born
- 2% · Canada, South Korea
- Languages at home
- 96% English-only · Spanish 2% Korean 1%
Political lean MEDSL · Pulaski
- 2024 margin
- Strong D (+22.1) · D 59.8% · R 37.7% · Other 2.5%
- 2008→2024 swing
- +10.6pp toward D · 2008: 11.6pp · 2024: 22.1pp
- All cycles
- 2024: D+22.1 2020: D+22.5 2016: D+17.9 2012: D+11.4 2008: D+11.6
Not yet ingested
- Civics
- —
Market trends
- HPI YoY
- ▼ -134.93%
- Current HPI
- 198.9456
- Rent YoY
- ▲ 4.81%
- Metro
- Little Rock-North Little Rock-Conway, AR
- State GDP YoY
- ▲ 3.80%
- F500 in state
- 10
Industry mix (Fortune 500 HQ in AR)
| Industry | F500 HQs | Revenue |
|---|---|---|
| Retail | 1 | $681B |
|
||
| Food / Agriculture | 1 | $53B |
|
||
| Retail / Energy | 1 | $22B |
|
||
| Transportation / Logistics | 1 | $12B |
|
||
| Energy | 1 | $4B |
|
||
Price history
+140.4% since first listed2 events — show timeline
- 2026-05-07 Listed $187,500 CARMLS
- 2013-05-02 Sold (Public Records) $78,000 Public Records
Property tax history
+6.0%/yrLatest (2025): $1,781 · +7.8% YoY. Source: county tax records.
Cash-flow waterfall
monthlySold comps — $/sqft
last 12 mo · ≤1 miLoading sold comps…