 🏗️ New Construction
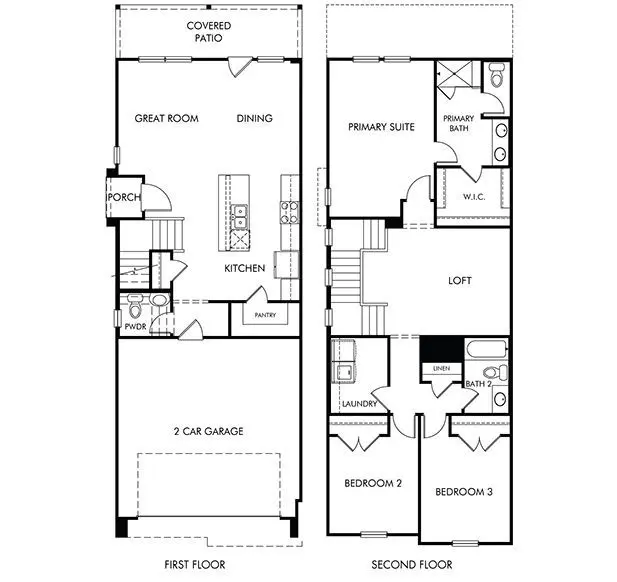
The Harlow (S135) Plan · Missouri City, TX
Flood risk 1/10 · Minimal
- FEMA flood zone
- X (unshaded)
- Chance of flooding over 30 yrs
- 0.0%
- Est. flood insurance / yr
- $507 – $1,088
Fire risk 5/10 · Moderate
- Est. fire insurance / yr
- $1,222 – $2,270
Heat risk 9/10 · Severe
- Hot days now (above 110°F)
- 7 days/yr
- Hot days in 30 yrs
- 21 days/yr
Wind risk 9/10 · Severe
- Chance of severe wind over 30 yrs
- 99.0%
Air-quality risk 3/10 · Minor
- Unhealthy air days now
- 2 days/yr
- Unhealthy air days in 30 yrs
- 3 days/yr
Risk factors via First Street. Map © Google.
Why this score? — see what drove the F grade
The composite is a weighted blend of 9 inputs, each scored 0–100. Each bar is that input's sub-score; the figure is the points it added to the 100-point composite (weight × sub-score).
- ARV discount +7.5/15.0
- Cash flow +7.2/30.0
- Schools +4.5/10.0
- Appreciation +4.2/10.0
- Livability +3.4/5.0
- Rent growth +2.5/5.0
- Condition / age +2.2/5.0
- 1% rule +2.0/10.0
- DSCR +1.3/10.0
$297,790
🖨 Deal sheet (PDF) 📄 Offer letter ✓ Due diligence
Listing remarks MLS
An open concept allows you to prepare dinner at the Harlow's kitchen island without missing conversation in the great room. Utilize the large upstairs loft space for your next game or movie night. The primary suite boats a large walk-in closet.
Key facts
- Walk-in closet
- Upstairs loft space
- Kitchen island
Tags
Neighborhood map
What this means for you Summary
Snapshot
- This is a 3-bed/2.5-bath single-family listed at $298k. Condition is rated fair.
Deal economics
- At list price, monthly cash flow is $-448 ($-5k/yr) — negative.
- To cash-flow at today's rent, offer at most $257k (13.7% below list).
- To meet the 1% rule (rent ≥ 1% of price), the offer needs to be $225k (24.5% below list).
- Recommended offer: $225k (24.5% below list) — sets the bar for 1% rule.
- Cap rate 4.6% vs local median 3.6% in Missouri City — meaningfully above typical; check what's discounted (condition, days-on-market, listing class) to confirm the premium yield is real.
Location & tenants
- Location reads 67/100 on livability (#526 in TX) — a middle-class / working-renter tenant base. Strengths: housing A+, crime A, employment A; Watch: amenities F, commute F, health & safety F.
- Fort Bend ISD (suburban): math 44% / reading 53% proficiency, ranked #140 of 826 in TX (top 17%) — families likely to look elsewhere, expect single-tenant / working-renter base with shorter leases.
- Market conditions: Rents soft (-0.1%/yr); 1228 active listings in the ZIP; 6 comparable units currently listed for rent nearby; rentals at typical pace (median 22d on market — plan ~3-4 weeks tenant-placement turnaround); high-income renter base; 12,093 units permitted in Fort Bend County in 2024 (815 in 5+ unit buildings).
Forward outlook
- Local home prices are declining (-1.7%/yr); year-one equity from $2k of loan paydown is wiped out by about $5k of value loss. Plan a longer hold.
- Fort Bend County population projected at +75% by 2050 — long-run rental-demand tailwind backs the buy-and-hold thesis.
Negotiation context
- It's been on market 148 days — a 12% lower offer ($262k) is reasonable based on typical stale-listing flexibility.
Risks & watch-outs
- Climate carrying-cost: severe wind risk, 99% chance of damaging wind over 30y; moderate wildfire risk; extreme-heat days projected 7→21/yr by 2055 (HVAC capex compounding) — expect insurance premiums to compound above CPI over the hold.
Questions for the listing agent
- What do current leases actually rent for vs. the listed asking? Can we see a recent rent roll and the last 12 months of T-12 income?
- It's been on market 148 days. Have you received any prior offers? Is the seller open to a 25% concession, seller financing, or rate buy-down credit?
- Have any recent inspections been done? Can we get a copy of the seller's disclosures and any deferred-maintenance estimates?
- Why hasn't it sold? Are there any deal-killer items the seller is aware of (foundation, flood, title, zoning, code violations)?
- Is there a deadline driving the sale (1031 exchange, divorce, estate, relocation)? That informs how much negotiation room exists.
- Schools are B-rated — typically a magnet for longer-tenancy family renters. What's the average tenant stay here, and is there a school-zone premium baked into asking?
- The area grade is low — what's the realistic commute time and amenity access for the typical tenant pool here? Any planned neighborhood developments (good or bad) we should know about?
- What's the average days-on-market for RENTAL listings here right now (not sales)? A rising rental-DOM trend means longer vacancies and softer asking-rent achievability than the comps imply.
- What's the recent tenant-quality profile in this submarket — average credit score on applications, eviction rate, late-payment / NSF rate, and stable-employment percentage? A property-management company in the area should have these aggregated.
- How much new for-sale + rental construction is in the pipeline within 1–3 miles? Heavy new supply typically softens prices + rents 12–24 months out; constrained supply supports both.
Investment metrics
- 1% rule
- 0.70% ✗
- Cap rate
- 4.62%
- Cash-on-cash
- -5.97%
- DSCR
- 0.73
- GRM
- 11.9
CMA / ARV
- ARV (median comp)
- $321,740
- List price
- $297,790
- Delta
- -7.44%
- Verdict
- FAIR
- Comps
- 20 within 1.0 mi
Show comp detail 12 sales within ~0.75 mi
| Address | Dist | Beds/Ba | Sqft | Sold | Price | $/sf | Match |
|---|---|---|---|---|---|---|---|
| 4210 Laurel Oak Cir | 0.03mi | 3/2.5 | 1,727 (0%) | 2mo | $302,340 | $175 | 97 |
| 1143 Cedar Place Ln | 0.07mi | 3/2.5 | 1,727 (0%) | 1mo | $319,640 | $185 | 96 |
| 1122 Cedar Place Ln | 0.07mi | 3/2.5 | 1,727 (0%) | 1mo | $310,840 | $180 | 96 |
| 1135 Cedar Place Ln | 0.07mi | 3/2.5 | 1,727 (0%) | 2mo | $302,190 | $175 | 95 |
| 1111 Cedar Place Ln | 0.10mi | 3/2.5 | 1,727 (0%) | 1mo | $288,490 | $167 | 95 |
| 1130 Cedar Place Ln | 0.06mi | 3/2.5 | 1,703 (-1%) | 1mo | $285,290 | $168 | 94 |
| 1134 Cedar Place Ln | 0.05mi | 3/2.5 | 1,604 (-7%) | 1mo | $279,490 | $174 | 84 |
| 1126 Cedar Place Ln | 0.06mi | 3/2.5 | 1,853 (+7%) | 2mo | $317,940 | $172 | 84 |
| 1103 Cedar Place Ln | 0.11mi | 3/2.5 | 1,853 (+7%) | 1mo | $327,090 | $177 | 82 |
| 2215 Bronze Bay Dr | 0.43mi | 3/2.5 | 1,748 (+1%) | 1mo | $278,000 | $159 | 78 |
| 3946 Canyon Shore Ln | 0.47mi | 3/2.0 | 1,875 (+9%) | 0mo | $330,000 | $176 | 62 |
| 3322 Aldridge Dr | 0.74mi | 3/2.0 | 1,733 (+0%) | 2mo | $239,000 | $138 | 61 |
Match score weights: distance 35% · size 25% · config 20% · recency 20%. Top-matched comps best support the ARV.
Projected returns pro-forma
-1.67% appreciation · 0.0% rent growth · sell at horizon
- IRR
- -19.7%
- Equity multiple
- 0.24×
- Total profit
- $-68,913
- Equity at exit
- $67,478
- IRR
- -16.9%
- Equity multiple
- -0.17×
- Total profit
- $-105,461
- Equity at exit
- $62,501
Cash invested: $90,087 (down + closing). Projections, not guarantees.
Landlord ↔ Tenant lean methodology
- Overall (STATE)
- 87 Strongly Landlord-Friendly
- State Texas
- 87 Strongly Landlord-Friendly · R+5
- County
- — inherits STATE
- City
- — inherits STATE
ZIP-level market 77459
- Home prices YoY
- -0.8%
- Rents YoY
- -0.1%
- Active inventory
- 1228
- Price-to-rent
- 11.0×
Monthly cashflow live
- Estimated rent
- $2,247 high interval (Pro) →
- Mortgage (P&I)
- −$1,687
- Tax est. 1.5%
- −$402 /mo · $4,826/yr
- Insurance
- −$134
- HOA
- −$0
- Vacancy / Maint / Mgmt
- −$472
- Net cashflow
- $-448
Break-even live
Sensitivity live
| Price | -10% $-226 | -5% $-337 | +0% $-448 | +5% $-560 | +10% $-671 |
|---|---|---|---|---|---|
| Rent | -10% $-626 | -5% $-537 | +0% $-448 | +5% $-360 | +10% $-271 |
| Rate | -1.0pp $-286 | -0.5pp $-367 | base $-448 | +0.5pp $-532 | +1.0pp $-617 |
UW: 25.0% down · 7.5% · 30yr · 1.5% tax · 5.0% vac · 8.0% maint · 8.0% mgmt
Financing live
Cash to close
- Down payment
- $80,435
- Closing costs
- $9,652
- Reserves months
- —
- Total cash needed
- —
Loan-product check · same deal, 3 products live
Conventional
25% down · 7.5% · 30yr
- Down + closing
- —
- Monthly P&I
- —
- Monthly cashflow
- —
- DSCR
- —
- Eligible?
- —
Personal DTI + credit; lowest rate.
DSCR
20% down · 8.5% · 30yr
- Down + closing
- —
- Monthly P&I
- —
- Monthly cashflow
- —
- DSCR
- —
- Eligible?
- —
No personal income docs; deal must DSCR.
Hard money
10% down · 12.0% · 12mo
- Down + closing
- —
- Monthly P&I
- —
- Monthly cashflow
- —
- DSCR
- —
- Eligible?
- —
Short-term bridge; refi at stabilization.
Rent comps 6 comps
| Address | Beds | Baths | Sqft | Rent | $/sqft | DOM | Units | Dist |
|---|---|---|---|---|---|---|---|---|
| 1055 Memorial Bend Blvd Missouri City, TX | 1.0–2.0 | 1.0–2.0 | 994 | $2,514 | $2.53 | 0d | 120 | 0.15mi |
| 2707 Troy Dr Missouri City, TX | 3.0 | 2.5 | 2082 | $2,245 | $1.08 | 3d | 1 | 0.83mi |
| 2709 Troy Dr Missouri City, TX | 3.0 | 2.5 | 2082 | $2,245 | $1.08 | 22d | 1 | 0.84mi |
| 17318 Edgehaven Dr Missouri City, TX | 3.0 | 2.0 | 1448 | $1,695 | $1.17 | 22d | 1 | 0.88mi |
| 3106 Presley Jane Ct Missouri City, TX | 3.0 | 2.0 | 2109 | $2,271 | $1.08 | 6d | 1 | 1.05mi |
| 3618 Quail Meadow Dr Missouri City, TX | 3.0 | 2.0 | 1618 | $1,966 | $1.22 | 45d | 1 | 1.26mi |
Listing history 23 events
-
2026-06-21days on market $297,790 Active 148 DOM
-
2026-06-18days on market $297,790 Active 145 DOM
-
2026-06-17days on market $297,790 Active 144 DOM
-
2026-06-16days on market $297,790 Active 143 DOM
-
2026-06-15days on market $297,790 Active 142 DOM
-
2026-06-13days on market $297,790 Active 140 DOM
-
2026-06-09days on market $297,790 Active 136 DOM
-
2026-06-07days on market $297,790 Active 134 DOM
-
2026-06-04days on market $297,790 Active 131 DOM
-
2026-06-03pricedays on market $297,790 Active 130 DOM
-
2026-06-02days on market $295,790 Active 129 DOM
-
2026-06-01days on market $295,790 Active 128 DOM
-
2026-05-31days on market $295,790 Active 127 DOM
-
2026-05-02price $294,790 244-char remark
Show marketing remark (244 chars)
An open concept allows you to prepare dinner at the Harlow's kitchen island without missing conversation in the great room. Utilize the large upstairs loft space for your next game or movie night. The primary suite boats a large walk-in closet.
-
2026-04-29price $289,790 244-char remark
Show marketing remark (244 chars)
An open concept allows you to prepare dinner at the Harlow's kitchen island without missing conversation in the great room. Utilize the large upstairs loft space for your next game or movie night. The primary suite boats a large walk-in closet.
-
2026-04-22price $311,790 244-char remark
Show marketing remark (244 chars)
An open concept allows you to prepare dinner at the Harlow's kitchen island without missing conversation in the great room. Utilize the large upstairs loft space for your next game or movie night. The primary suite boats a large walk-in closet.
-
2026-04-09price $288,490 244-char remark
Show marketing remark (244 chars)
An open concept allows you to prepare dinner at the Harlow's kitchen island without missing conversation in the great room. Utilize the large upstairs loft space for your next game or movie night. The primary suite boats a large walk-in closet.
-
2026-04-03price $308,490 244-char remark
Show marketing remark (244 chars)
An open concept allows you to prepare dinner at the Harlow's kitchen island without missing conversation in the great room. Utilize the large upstairs loft space for your next game or movie night. The primary suite boats a large walk-in closet.
-
2026-04-02price $305,490 244-char remark
Show marketing remark (244 chars)
An open concept allows you to prepare dinner at the Harlow's kitchen island without missing conversation in the great room. Utilize the large upstairs loft space for your next game or movie night. The primary suite boats a large walk-in closet.
-
2026-03-30price $302,340 244-char remark
Show marketing remark (244 chars)
An open concept allows you to prepare dinner at the Harlow's kitchen island without missing conversation in the great room. Utilize the large upstairs loft space for your next game or movie night. The primary suite boats a large walk-in closet.
-
2026-02-12price $302,190 244-char remark
Show marketing remark (244 chars)
An open concept allows you to prepare dinner at the Harlow's kitchen island without missing conversation in the great room. Utilize the large upstairs loft space for your next game or movie night. The primary suite boats a large walk-in closet.
-
2026-02-06price $321,640 244-char remark
Show marketing remark (244 chars)
An open concept allows you to prepare dinner at the Harlow's kitchen island without missing conversation in the great room. Utilize the large upstairs loft space for your next game or movie night. The primary suite boats a large walk-in closet.
-
2026-01-24$322,340 Active 244-char remark
Show marketing remark (244 chars)
An open concept allows you to prepare dinner at the Harlow's kitchen island without missing conversation in the great room. Utilize the large upstairs loft space for your next game or movie night. The primary suite boats a large walk-in closet.
ⓘ Source: listings_history table (triggers on properties + properties_extension) + one-shot
backfill from property_details.listing_events for pre-trigger history.
Climate risk First Street
- Flood 1/10 Low FEMA zone X (unshaded) · 0% chance over 30 yrs
- Wildfire 5/10 Major
- Heat 9/10 Extreme 7 d/yr ≥110°F today · 21 d/yr by 30 yrs out
- Wind 9/10 Extreme 99% chance of damaging wind over 30 yrs
- Air quality 3/10 Moderate 2 unhealthy d/yr today · 3 by 30 yrs out
Nearby sold comps map
Loading sold comps map…
Walkable amenities ~0.75 mi
Loading nearby amenities…
Taxation est. · year 1
- Rental income
- $26,962
- − Mortgage interest
- −$18,022
- − Property taxes
- −$4,826
- − Insurance
- −$1,609
- − Repairs & maintenance
- −$2,157
- − Management
- −$2,157
- − Depreciation
- −$9,360
- Taxable loss
- −$11,169
- Est. tax savings @ 24.0%
- +$2,680
- After-tax cash flow
- $-2,701/yr
For passive investors: Depreciation is non-cash, so a rental often shows a tax loss while cash-flowing — sheltering income. Rental losses are passive: they offset passive income freely, and up to $25,000/yr can offset ordinary (W-2) income if you actively participate and your MAGI is under $100k (phasing out to $0 by $150k); unused losses carry forward. On sale, claimed depreciation is recaptured at up to 25%, and gains may owe capital-gains tax (a 1031 exchange can defer both). Figures are a year-1 estimate at your 24.0% rate — not tax advice; consult a CPA.
Condition & rehab AI · 1 photo
The Harlow (S135) Plan in Missouri City, TX, is in fair condition with average systems and minimal visible wear. A moderate level of renovation is suggested, focusing on painting and HVAC maintenance to enhance its resale and rental value.
Repairs flagged
- Minor Paint — Paint appears slightly faded
Value-add opportunities
- Both Paint — Fresh paint enhances curb appeal and interior aesthetics
- Both HVAC maintenance — A clean and efficient HVAC system improves comfort and energy efficiency
Renovation cost estimate screening
| Repair item | Severity | Est. cost |
|---|---|---|
| Paint · Paint appears slightly faded | Minor | $500–3,000 |
| Total estimated repair cost · 1 items | $500–3,000 |
Value-add ROI direction
- Both Paint — Fresh paint enhances curb appeal and interior aesthetics ↑
- Both HVAC maintenance — A clean and efficient HVAC system improves comfort and energy efficiency ↑
ⓘ Cost ranges are severity-bucket heuristics (US national rule-of-thumb). Get contractor quotes + a written scope before underwriting a rehab budget.
Schools (NCES district)
- District
- Fort Bend ISD
- NCES district ID
- 4819650
- Math proficiency
- 44% ▼ -15.00%
- Reading proficiency
- 53% ▼ -4.00%
- Median HH income
- $82,360
- Composite
- 44.61/100
- National rank
- #2779
- State rank
- #140 of 826 in TX
Livability — Missouri City
- Score
- 67/100
- State rank
- #526
- US rank
- #10308
Category grades
Schools grade is shown separately in the Schools card above.
Census & demographics
- Census place
- Missouri City, TX
- County
- Fort Bend County · 836,777 people
- City population
- 123,513
- Metro
- Houston-The Woodlands-Sugar Land, TX
- Population (ZIP)
- 84,221
- Household income
- $129,151
- Rent vs Own
- Severe rent burden
- 1004.0
Population outlook (Fort Bend County) Hauer SSP2
- Today (2025)
- 1,004,526 people
- By 2030
- 1,153,104 · +14.8%
- By 2040
- 1,453,718 · +44.7%
- By 2050
- 1,753,781 · +74.6%
- By 2075
- 2,455,772 · +144.5%
- By 2100
- 2,930,528 · +191.7%
Race, ethnicity, and origin ACS 2023
- Neighborhood character
- Highly diverse neighborhood (Simpson 0.75)
- Race & ethnicity
- White 34% Black 26% Asian 22% Hispanic / Latino 13% Two or more races 10%
- Hispanic origin (detail)
- Mexican 7%
- Common ancestry
- Lithuanian 2% Slovak 1% Italian 1%
- Foreign-born
- 21% · Canada, China, Vietnam
- Languages at home
- 73% English-only · Other Asian/Pacific 8% Spanish 7% Other Indo-European 5%
Political lean MEDSL · Fort Bend
- 2024 margin
- Toss-up / Even · D 49.5% · R 47.9% · Other 2.6%
- 2008→2024 swing
- +4.0pp toward D · 2008: -2.4pp · 2024: 1.6pp
- All cycles
- 2024: D+1.6 2020: D+10.6 2016: D+6.6 2012: R+6.8 2008: R+2.4
Not yet ingested
- Civics
- —
Market trends
- HPI YoY
- ▼ -1.67%
- Current HPI
- 212.3573
- Rent YoY
- ▼ -0.15%
- Metro
- Houston-The Woodlands-Sugar Land, TX
- State GDP YoY
- ▲ 3.95%
- F500 in state
- 110
Industry mix (Fortune 500 HQ in TX)
| Industry | F500 HQs | Revenue |
|---|---|---|
| Energy | 16 | $1,198B |
|
||
| Technology | 5 | $198B |
|
||
| Engineering / Construction | 4 | $72B |
|
||
| Energy Services | 3 | $60B |
|
||
| Utilities | 3 | $41B |
|
||
| Healthcare | 2 | $330B |
|
||
Price history
-8.5% since first listed10 events — show timeline
- 2026-05-02 Price Changed $294,790 Zillow
- 2026-04-29 Price Changed $289,790 Zillow
- 2026-04-22 Price Changed $311,790 Zillow
- 2026-04-09 Price Changed $288,490 Zillow
- 2026-04-03 Price Changed $308,490 Zillow
- 2026-04-02 Price Changed $305,490 Zillow
- 2026-03-30 Price Changed $302,340 Zillow
- 2026-02-12 Price Changed $302,190 Zillow
- 2026-02-06 Price Changed $321,640 Zillow
- 2026-01-24 Listed $322,340 Zillow
Cash-flow waterfall
monthlySold comps — $/sqft
last 12 mo · ≤1 miLoading sold comps…