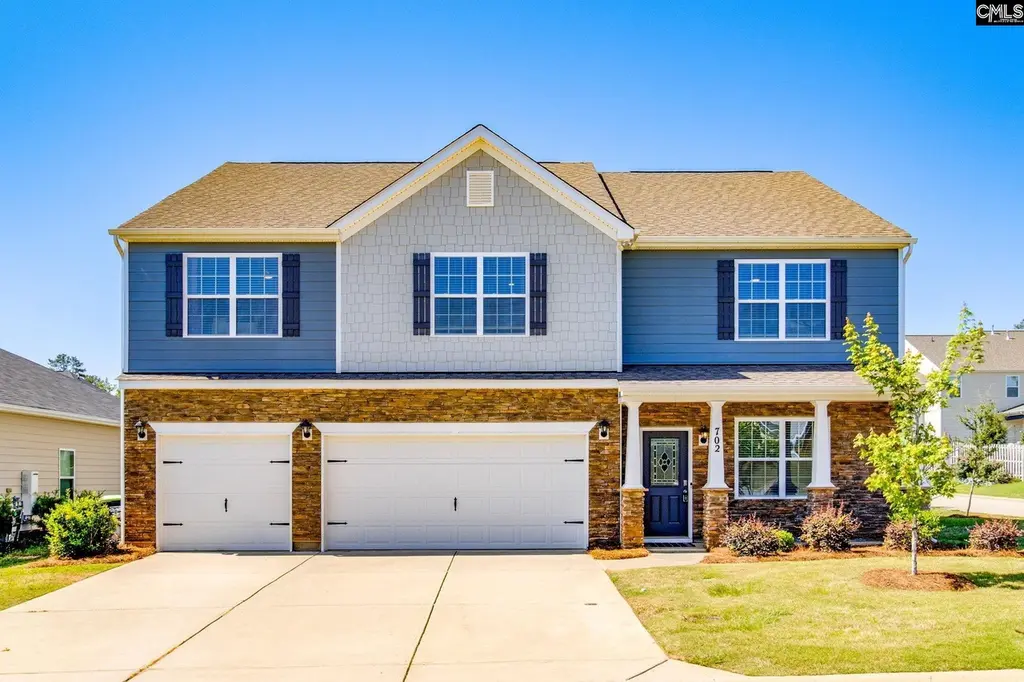
702 Autumn Shiloh Dr · Lake Murray of Richland, SC
Flood risk 1/10 · Minimal
- FEMA flood zone
- X (unshaded)
- Chance of flooding over 30 yrs
- 0.0%
- Est. flood insurance / yr
- $507 – $1,088
Fire risk 4/10 · Minor
- Est. fire insurance / yr
- $783 – $1,453
Heat risk 7/10 · Major
- Hot days now (above 107°F)
- 7 days/yr
- Hot days in 30 yrs
- 17 days/yr
Wind risk 6/10 · Moderate
- Chance of severe wind over 30 yrs
- 60.0%
Air-quality risk 3/10 · Minor
- Unhealthy air days now
- 2 days/yr
- Unhealthy air days in 30 yrs
- 3 days/yr
Risk factors via First Street. Map © Google.
Why this score? — see what drove the D grade
The composite is a weighted blend of 9 inputs, each scored 0–100. Each bar is that input's sub-score; the figure is the points it added to the 100-point composite (weight × sub-score).
- Cash flow +13.2/30.0
- ARV discount +11.4/15.0
- Schools +4.5/10.0
- DSCR +4.0/10.0
- Livability +3.4/5.0
- 1% rule +2.9/10.0
- Rent growth +2.5/5.0
- Condition / age +2.5/5.0
- Appreciation +0.0/10.0
$405,000
🖨 Deal sheet (PDF) 📄 Offer letter ✓ Due diligence
Listing remarks
Spacious home in desirable Woodland Crossing, the Georgetown plan by DR Horton has room for everything. Entering into an open floorplan with living anddining spaces leading into the family room and kitchen - great for entertaining and guests. The downstairs bedroom has an ensuite bath and would be perfectfor overnight or long-term guests. The large upstairs primary has double vanities and a roomy closet, three additional secondary bedrooms all have walk-inclosets and share a hall bath. Expansive bonus/media room is perfect for movies, sports, and games. Kitchen features granite countertops and a gas stove. The backyard is fully fenced for privacy and enjoyment. One of the best things about
Key facts
- Open floorplan
- Ensuite bath
- Walk-in closets
Tags
Property features AI
Finance
- Other: Community pool
- HOA & community: Homeowners association with common area maintenance and community pool
Exterior
- Parking: Attached 3-car garage on main level
- Utilities: Public water; Public sewer
- Home design: Two-story single-family home; Home faces north
- Construction: Fiber cement (Hardie plank) siding with stone accents; Slab foundation
- Exterior features: Covered front porch; Covered back porch; Rear wood privacy fence
Interior
- Kitchen: Eat-in kitchen with island and pantry; Granite countertops and tiled backsplash; Painted cabinets; Dishwasher; Microwave above stove; Free-standing gas range
- Bedrooms: Master bedroom on second floor with cathedral ceilings, double vanity, private bath, separate shower, walk-in closet; Bedroom 2 on second floor with private bath, walk-in closet, tub/shower; Bedroom 3 on second floor with double vanity, shared bath, walk-in closet, garden tub; Bedroom 4 on second floor with double vanity, shared bath, walk-in closet, tub/shower; Bedroom 5 on main level with private bath
- Flooring: Luxury vinyl plank flooring in living areas and kitchen; Carpet in bedrooms; Vinyl flooring in some areas
- Bathrooms: Four full bathrooms and one half bathroom total; Three full secondary bathrooms
- Heating & cooling: Central cooling; Gas heating on both first and second levels
- Interior features: Ceiling fans throughout; Garage opener; Gas log (natural) fireplace with recessed lighting in great room; Recessed lights in living areas
- Laundry & utility: Main-level laundry in heated utility room; Tankless and gas water heaters
Neighborhood map
What this means for you Summary
Snapshot
- This is a 5-bed/4.5-bath single-family listed at $405k.
Deal economics
- At list price, monthly cash flow is $-8 ($-92/yr) — negative.
- To cash-flow at today's rent, offer at most $404k (0.3% below list).
- To meet the 1% rule (rent ≥ 1% of price), the offer needs to be $321k (20.8% below list).
- Recommended offer: $321k (20.8% below list) — sets the bar for 1% rule.
Location & tenants
- Location reads 67/100 on livability (#102 in SC) — a middle-class / working-renter tenant base. Strengths: crime A+, employment A+, housing A+; Watch: amenities F, commute F, cost of living F.
- Lexington 05 (suburban): math 47% / reading 55% proficiency, ranked #5 of 80 in SC (top 6%) — acceptable for families but not a draw, mixed tenant base, ~2y average lease.
- Zoned schools: Chapin Elementary (math 53% / reading 51%, grade C-, #145 of 597 statewide, top 26%, 790 students, 34% FRL); Chapin Middle (math 50% / reading 57%, grade C+, #29 of 229 statewide, top 13%, 991 students, 27% FRL); Chapin High (math 82% / reading 91%, grade A, #7 of 196 statewide, top 4%, 1,615 students, 100% FRL) — zoned schools average 54% FRL vs 27% district-wide (26 pts higher); higher-poverty schools than district average — tighter screening recommended.
- Zoned-school proficiency averages 64% at this address vs 51% district-wide (+13 pts) — the actual schools serving this property are materially stronger than the Lexington 05 average implies; a family-tenant draw the district grade alone would hide.
- Market conditions: 443 active listings in the ZIP; 2 comparable units currently listed for rent nearby; high-income renter base; 1,712 units permitted in Lexington County in 2024 (0 in 5+ unit buildings).
- This rent runs 34% of the median local income ($114k/yr) — at the standard rent-burdened threshold; future hikes will face affordability resistance.
Forward outlook
- Local home prices are declining (-3.0%/yr); year-one equity from $3k of loan paydown is wiped out by about $12k of value loss. Plan a longer hold.
- Lexington County population projected at +26% by 2050 — long-run rental-demand tailwind backs the buy-and-hold thesis.
Negotiation context
- It's been on market 30 days — a 2% lower offer ($399k) is reasonable based on typical stale-listing flexibility.
Risks & watch-outs
- Climate carrying-cost: major wind risk, 60% chance of damaging wind over 30y; extreme-heat days projected 7→17/yr by 2055 (HVAC capex compounding) — expect insurance premiums to compound above CPI over the hold.
Questions for the listing agent
- What do current leases actually rent for vs. the listed asking? Can we see a recent rent roll and the last 12 months of T-12 income?
- What does the HOA fee cover, when was the last increase, and are there any pending special assessments or reserve-fund shortfalls?
- Is there a deadline driving the sale (1031 exchange, divorce, estate, relocation)? That informs how much negotiation room exists.
- Schools are D-rated, which usually means shorter tenancies and higher turnover. Who's the typical renter profile here, and what's been the actual vacancy rate?
- The area grade is low — what's the realistic commute time and amenity access for the typical tenant pool here? Any planned neighborhood developments (good or bad) we should know about?
- What's the average days-on-market for RENTAL listings here right now (not sales)? A rising rental-DOM trend means longer vacancies and softer asking-rent achievability than the comps imply.
- What's the recent tenant-quality profile in this submarket — average credit score on applications, eviction rate, late-payment / NSF rate, and stable-employment percentage? A property-management company in the area should have these aggregated.
- How much new for-sale + rental construction is in the pipeline within 1–3 miles? Heavy new supply typically softens prices + rents 12–24 months out; constrained supply supports both.
Investment metrics
- 1% rule
- 0.79% ✗
- Cap rate
- 6.27%
- Cash-on-cash
- -0.08%
- DSCR
- 1.00
- GRM
- 10.5
CMA / ARV
- ARV (on-the-fly)
- $443,772
- Comps found
- 1
Show comp detail 1 sale within ~0.75 mi
| Address | Dist | Beds/Ba | Sqft | Sold | Price | $/sf | Match |
|---|---|---|---|---|---|---|---|
| 359 Sycamore Crest Way | 0.15mi | 4/3.5 (-1) | 3,108 (-12%) | 18mo | $393,000 | $126 | 49 |
Match score weights: distance 35% · size 25% · config 20% · recency 20%. Top-matched comps best support the ARV.
Projected returns pro-forma
-3.0% appreciation · 3.0% rent growth · sell at horizon
- IRR
- -16.5%
- Equity multiple
- 0.42×
- Total profit
- $-66,224
- Equity at exit
- $60,387
- IRR
- -8.3%
- Equity multiple
- 0.48×
- Total profit
- $-58,740
- Equity at exit
- $35,017
Cash invested: $113,400 (down + closing). Projections, not guarantees.
Landlord ↔ Tenant lean methodology
- Overall (STATE)
- 90 Strongly Landlord-Friendly
- State South Carolina
- 90 Strongly Landlord-Friendly · R+6
- County
- — inherits STATE
- City
- — inherits STATE
ZIP-level market 29036
- Active inventory
- 443
- Price-to-rent
- 10.5×
Monthly cashflow live
- Estimated rent
- $3,207 medium interval (Pro) →
- Mortgage (P&I)
- −$2,124
- Tax from tax record
- −$186 /mo · $2,229/yr
- Insurance
- −$169
- HOA
- −$63
- Vacancy / Maint / Mgmt
- −$674
- Net cashflow
- $-8
Break-even live
Sensitivity live
| Price | -10% $222 | -5% $107 | +0% $-8 | +5% $-122 | +10% $-237 |
|---|---|---|---|---|---|
| Rent | -10% $-261 | -5% $-134 | +0% $-8 | +5% $119 | +10% $246 |
| Rate | -1.0pp $196 | -0.5pp $95 | base $-8 | +0.5pp $-113 | +1.0pp $-219 |
UW: 25.0% down · 7.5% · 30yr · 1.5% tax · 5.0% vac · 8.0% maint · 8.0% mgmt
Financing live
Cash to close
- Down payment
- $101,250
- Closing costs
- $12,150
- Reserves months
- —
- Total cash needed
- —
Loan-product check · same deal, 3 products live
Conventional
25% down · 7.5% · 30yr
- Down + closing
- —
- Monthly P&I
- —
- Monthly cashflow
- —
- DSCR
- —
- Eligible?
- —
Personal DTI + credit; lowest rate.
DSCR
20% down · 8.5% · 30yr
- Down + closing
- —
- Monthly P&I
- —
- Monthly cashflow
- —
- DSCR
- —
- Eligible?
- —
No personal income docs; deal must DSCR.
Hard money
10% down · 12.0% · 12mo
- Down + closing
- —
- Monthly P&I
- —
- Monthly cashflow
- —
- DSCR
- —
- Eligible?
- —
Short-term bridge; refi at stabilization.
Rent comps 2 comps
| Address | Beds | Baths | Sqft | Rent | $/sqft | DOM | Units | Dist |
|---|---|---|---|---|---|---|---|---|
| 425 Pine Log Run Chapin, SC | 5.0 | 3.0 | 2588 | $2,600 | $1.00 | 13d | 1 | 0.08mi |
| 2019 Ludlow Pl Chapin, SC | 5.0 | 3.5 | 3316 | $2,990 | $0.90 | 13d | 1 | 0.49mi |
HOA detail
- Monthly dues
- $63 · $756/yr
- Likely covers
- gas
Listing history 17 events
-
2026-06-21days on market $405,000 Active 30 DOM
-
2026-06-18days on market $405,000 Active 27 DOM
-
2026-06-18price $405,000 Active 26 DOM
-
2026-06-17days on market $415,000 Active 26 DOM
-
2026-06-16days on market $415,000 Active 25 DOM
-
2026-06-15days on market $415,000 Active 24 DOM
-
2026-06-14days on market $415,000 Active 22 DOM
-
2026-06-13days on market $415,000 Active 21 DOM
-
2026-06-10days on market $415,000 Active 19 DOM
-
2026-06-09days on market $415,000 Active 18 DOM
-
2026-06-08days on market $415,000 Active 17 DOM
-
2026-06-07days on market $415,000 Active 16 DOM
-
2026-06-03days on market $415,000 Active 12 DOM
-
2026-06-03days on market $415,000 Active 11 DOM
-
2026-06-01days on market $415,000 Active 10 DOM
-
2026-05-31days on market $415,000 Active 9 DOM
-
2026-05-22$415,000 Active
ⓘ Source: listings_history table (triggers on properties + properties_extension) + one-shot
backfill from property_details.listing_events for pre-trigger history.
Tax reassessment forecast SC · Resets to sale price
- Current annual tax
- $2,229 · $186/mo
- Projected year-2 tax
- $2,308 · $192/mo
- Expected delta
- +$79/yr (+$7/mo · 3.6%)
ⓘ Screening estimate from a state-policy table — verify with the county assessor before closing.
Climate risk First Street
- Flood 1/10 Low FEMA zone X (unshaded) · 0% chance over 30 yrs
- Wildfire 4/10 Moderate
- Heat 7/10 Severe 7 d/yr ≥107°F today · 17 d/yr by 30 yrs out
- Wind 6/10 Major 60% chance of damaging wind over 30 yrs
- Air quality 3/10 Moderate 2 unhealthy d/yr today · 3 by 30 yrs out
Nearby sold comps map
Loading sold comps map…
Walkable amenities ~0.75 mi
Loading nearby amenities…
Taxation est. · year 1
- Rental income
- $38,487
- − Mortgage interest
- −$22,686
- − Property taxes
- −$2,229
- − Insurance
- −$2,025
- − Repairs & maintenance
- −$3,079
- − Management
- −$3,079
- − HOA
- −$756
- − Depreciation
- −$11,782
- Taxable loss
- −$7,149
- Est. tax savings @ 24.0%
- +$1,716
- After-tax cash flow
- $1,624/yr
For passive investors: Depreciation is non-cash, so a rental often shows a tax loss while cash-flowing — sheltering income. Rental losses are passive: they offset passive income freely, and up to $25,000/yr can offset ordinary (W-2) income if you actively participate and your MAGI is under $100k (phasing out to $0 by $150k); unused losses carry forward. On sale, claimed depreciation is recaptured at up to 25%, and gains may owe capital-gains tax (a 1031 exchange can defer both). Figures are a year-1 estimate at your 24.0% rate — not tax advice; consult a CPA.
Schools (NCES district)
- District
- Lexington 05
- NCES district ID
- 4502820
- Math proficiency
- 47% ▼ -7.00%
- Reading proficiency
- 55% ▼ -4.00%
- Median HH income
- $67,732
- Composite
- 45.28/100
- National rank
- #2656
- State rank
- #5 of 80 in SC
Livability — Lake Murray of Richland
- Score
- 67/100
- State rank
- #102
- US rank
- #10903
Category grades
Schools grade is shown separately in the Schools card above.
Census & demographics
- County
- Lexington County · 232,571 people
- City population
- 179
- Metro
- Columbia, SC
- Population (ZIP)
- 26,620
- Household income
- $113,986
- Rent vs Own
- Severe rent burden
- 212.0
Population outlook (Lexington County) Hauer SSP2
- Today (2025)
- 322,999 people
- By 2030
- 342,356 · +6.0%
- By 2040
- 377,715 · +16.9%
- By 2050
- 406,984 · +26.0%
- By 2075
- 465,447 · +44.1%
- By 2100
- 485,674 · +50.4%
Race, ethnicity, and origin ACS 2023
- Neighborhood character
- Predominantly White (86%)
- Race & ethnicity
- White 86% Asian 5% Two or more races 4% Black 3% Hispanic / Latino 3%
- Common ancestry
- Lithuanian 4% Slovak 4% Italian 2%
- Foreign-born
- 6% · Canada, South Korea, China
- Languages at home
- 95% English-only · Other Indo-European 2% Spanish 1% Korean 1%
Political lean MEDSL · Lexington
- 2024 margin
- Solid R (+33.5) · D 32.5% · R 66.0% · Other 1.4%
- 2008→2024 swing
- +4.6pp toward D · 2008: -38.0pp · 2024: -33.5pp
- All cycles
- 2024: R+33.5 2020: R+30.1 2016: R+36.7 2012: R+37.8 2008: R+38.0
Not yet ingested
- Civics
- —
Market trends
- HPI YoY
- ▼ -134.76%
- Current HPI
- 248.3807
- Rent YoY
- —
- Metro
- Columbia, SC
- State GDP YoY
- ▲ 4.51%
- F500 in state
- 2
Industry mix (Fortune 500 HQ in SC)
| Industry | F500 HQs | Revenue |
|---|---|---|
| Packaging | 1 | $7B |
|
||
Price history
1 event — show timeline
- 2026-05-22 Listed $415,000 Consolidated MLS
Property tax history
+8.5%/yrLatest (2024): $2,229 · +0.9% YoY. Source: county tax records.
Cash-flow waterfall
monthlySold comps — $/sqft
last 12 mo · ≤1 miLoading sold comps…