1250 Dorrell Rd · Central Garage, VA
Flood risk 1/10 · Minimal
- FEMA flood zone
- X (unshaded)
- Chance of flooding over 30 yrs
- 0.0%
- Est. flood insurance / yr
- $507 – $1,088
Fire risk 4/10 · Minor
- Est. fire insurance / yr
- $666 – $1,236
Heat risk 7/10 · Major
- Hot days now (above 105°F)
- 7 days/yr
- Hot days in 30 yrs
- 16 days/yr
Wind risk 6/10 · Moderate
- Chance of severe wind over 30 yrs
- 27.0%
Air-quality risk 3/10 · Minor
- Unhealthy air days now
- 2 days/yr
- Unhealthy air days in 30 yrs
- 3 days/yr
Risk factors via First Street. Map © Google.
Why this score? — see what drove the C- grade
The composite is a weighted blend of 9 inputs, each scored 0–100. Each bar is that input's sub-score; the figure is the points it added to the 100-point composite (weight × sub-score).
- Cash flow +20.9/30.0
- ARV discount +7.5/15.0
- DSCR +6.7/10.0
- Schools +5.1/10.0
- 1% rule +4.4/10.0
- Livability +3.1/5.0
- Rent growth +2.5/5.0
- Condition / age +2.5/5.0
- Appreciation +0.0/10.0
$189,950
🖨 Deal sheet 📄 Offer letter ✓ Due diligence
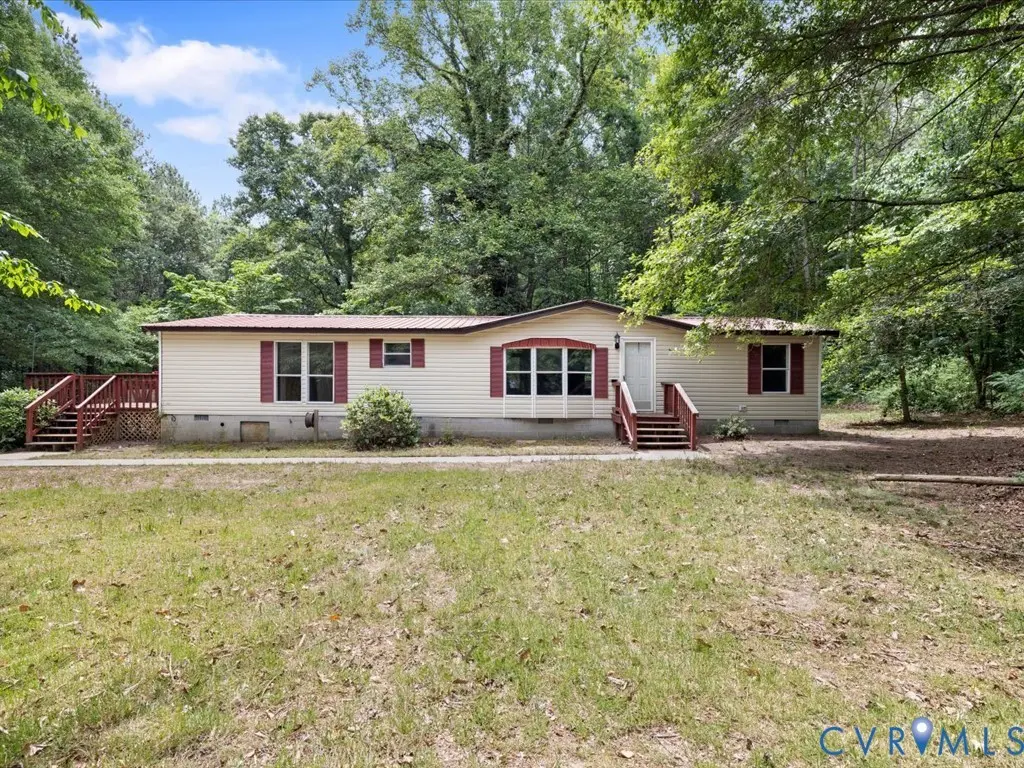
Listing remarks
Nestled on a serene and private lot, this charming property offers peaceful country living with proximity to local amenities. Step outside to enjoy the expansive large deck, perfect for entertaining, relaxing, or taking in the surrounding nature. The home features a new metal roof, providing durability, low maintenance, and peace of mind for years to come. Offered as-is, this is a fantastic opportunity for buyers looking to add their personal touch and build equity. Disclaimer: Room dimensions are approximate. Photos are enhanced for aesthetic purposes.
Key facts
- New metal roof
- Private lot
- Expansive large deck
Tags
Property features AI
Finance
- Other: Above-grade finished area documented (1,560)
- Financial info: No investor or income/expense details provided
- HOA & community: No HOA details provided
Exterior
- Parking: No parking details provided
- Security: No security details provided
- Utilities: Private well water; Septic tank sewer
- Home design: Single-story property; Above-grade finished living area reported
- Construction: Block and vinyl siding construction; Metal roof; Built (actual year not specified)
- Exterior features: Lot zoned A-C; 1.27-acre lot
Interior
- Kitchen: No kitchen appliance details provided
- Bedrooms: One bedroom on the first floor
- Flooring: No flooring details provided
- Bathrooms: Two full bathrooms; One full bathroom with tub & shower on the first floor
- Heating & cooling: Heat pump and electric heating; Central air conditioning
- Interior features: Resale condition
- Laundry & utility: No laundry details provided
Neighborhood map
What this means for you Summary
Snapshot
- This is a 3-bed/2.0-bath manufactured listed at $190k.
Deal economics
- At list price, monthly cash flow is $265 ($3k/yr) — positive.
- The deal already cash-flows at list — no discount required.
- To meet the 1% rule (rent ≥ 1% of price), the offer needs to be $179k (5.9% below list).
- Recommended offer: $179k (5.9% below list) — sets the bar for 1% rule.
- Cap rate 8.0% vs local median 3.1% in Central Garage — top-decile yield for the area; either an underpriced asset or a hidden risk that comps aren't pricing in. Stress-test before assuming the spread holds.
Location & tenants
- Location reads 62/100 on livability (#392 in VA) — a middle-class / working-renter tenant base. Strengths: crime A+, employment A+, housing A+; Watch: schools F, amenities F, commute F.
- King William County Public School District (rural): math 49% / reading 67% proficiency, ranked #60 of 131 in VA (top 46%) — acceptable for families but not a draw, mixed tenant base, ~2y average lease.
- Market conditions: 156 active listings in the ZIP; 129 units permitted in King William County in 2024 (0 in 5+ unit buildings).
Forward outlook
- Local home prices are declining (-3.0%/yr); year-one equity from $1k of loan paydown is wiped out by about $6k of value loss. Plan a longer hold.
Negotiation context
- Only 4 days on market — expect competitive offers; lowballing is unlikely to land.
- Current owner paid $80k; list at $190k implies a 137% gain — meaningful room to come down on a strong offer.
Risks & watch-outs
- Climate carrying-cost: major wind risk, 27% chance of damaging wind over 30y; extreme-heat days projected 7→16/yr by 2055 (HVAC capex compounding) — expect insurance premiums to compound above CPI over the hold.
Questions for the listing agent
- Is there a deadline driving the sale (1031 exchange, divorce, estate, relocation)? That informs how much negotiation room exists.
- Schools are F-rated, which usually means shorter tenancies and higher turnover. Who's the typical renter profile here, and what's been the actual vacancy rate?
- What's the average days-on-market for RENTAL listings here right now (not sales)? A rising rental-DOM trend means longer vacancies and softer asking-rent achievability than the comps imply.
- What's the recent tenant-quality profile in this submarket — average credit score on applications, eviction rate, late-payment / NSF rate, and stable-employment percentage? A property-management company in the area should have these aggregated.
- How much new for-sale + rental construction is in the pipeline within 1–3 miles? Heavy new supply typically softens prices + rents 12–24 months out; constrained supply supports both.
Investment metrics
- 1% rule
- 0.94% ✗
- Cap rate
- 7.97%
- Cash-on-cash
- 5.99%
- DSCR
- 1.27
- GRM
- 8.9
CMA / ARV
No comps found within radius.
Projected returns pro-forma
-3.0% appreciation · 3.0% rent growth · sell at horizon
- IRR
- -7.1%
- Equity multiple
- 0.74×
- Total profit
- $-13,950
- Equity at exit
- $28,322
- IRR
- 2.5%
- Equity multiple
- 1.18×
- Total profit
- $9,316
- Equity at exit
- $16,423
Cash invested: $53,186 (down + closing). Projections, not guarantees.
Landlord ↔ Tenant lean methodology
- Overall (STATE)
- 55 Moderately Landlord-Leaning
- State Virginia
- 55 Moderately Landlord-Leaning · D+2
- County
- — inherits STATE
- City
- — inherits STATE
ZIP-level market 23009
- Home prices YoY
- -33.7%
- Active inventory
- 156
- Price-to-rent
- 8.9×
Monthly cashflow live
- Estimated rent
- $1,788 medium interval (Pro) →
- Mortgage (P&I)
- −$996
- Tax from tax record
- −$72 /mo · $863/yr
- Insurance
- −$79
- HOA
- −$0
- Vacancy / Maint / Mgmt
- −$376
- Net cashflow
- $265
Break-even live
UW: 25.0% down · 7.5% · 30yr · 1.5% tax · 5.0% vac · 8.0% maint · 8.0% mgmt
Financing live
Cash to close
- Down payment
- $47,488
- Closing costs
- $5,698
- Reserves months
- —
- Total cash needed
- —
Loan-product check · same deal, 3 products live
Conventional
25% down · 7.5% · 30yr
- Down + closing
- —
- Monthly P&I
- —
- Monthly cashflow
- —
- DSCR
- —
- Eligible?
- —
Personal DTI + credit; lowest rate.
DSCR
20% down · 8.5% · 30yr
- Down + closing
- —
- Monthly P&I
- —
- Monthly cashflow
- —
- DSCR
- —
- Eligible?
- —
No personal income docs; deal must DSCR.
Hard money
10% down · 12.0% · 12mo
- Down + closing
- —
- Monthly P&I
- —
- Monthly cashflow
- —
- DSCR
- —
- Eligible?
- —
Short-term bridge; refi at stabilization.
Listing history 3 events
-
2026-06-13statusdays on market $189,950 Pending 4 DOM
-
2026-06-08remarks 559-char remark
-
2026-06-08$189,950 Active 1 DOM
ⓘ Source: listings_history table (triggers on properties + properties_extension) + one-shot
backfill from property_details.listing_events for pre-trigger history.
Tax reassessment forecast VA · Resets to sale price
- Current annual tax
- $863 · $72/mo
- Projected year-2 tax
- $1,558 · $130/mo
- Expected delta
- +$694/yr (+$58/mo · 80.4%)
ⓘ Screening estimate from a state-policy table — verify with the county assessor before closing.
Climate risk First Street
- Flood 1/10 Low FEMA zone X (unshaded) · 0% chance over 30 yrs
- Wildfire 4/10 Moderate
- Heat 7/10 Severe 7 d/yr ≥105°F today · 16 d/yr by 30 yrs out
- Wind 6/10 Major 27% chance of damaging wind over 30 yrs
- Air quality 3/10 Moderate 2 unhealthy d/yr today · 3 by 30 yrs out
Nearby sold comps map
Loading sold comps map…
Walkable amenities ~0.75 mi
Loading nearby amenities…
Taxation est. · year 1
- Rental income
- $21,458
- − Mortgage interest
- −$10,640
- − Property taxes
- −$863
- − Insurance
- −$950
- − Repairs & maintenance
- −$1,717
- − Management
- −$1,717
- − Depreciation
- −$5,526
- Taxable income
- $45
- Est. tax owed @ 24.0%
- −$11
- After-tax cash flow
- $3,174/yr
For passive investors: Depreciation is non-cash, so a rental often shows a tax loss while cash-flowing — sheltering income. Rental losses are passive: they offset passive income freely, and up to $25,000/yr can offset ordinary (W-2) income if you actively participate and your MAGI is under $100k (phasing out to $0 by $150k); unused losses carry forward. On sale, claimed depreciation is recaptured at up to 25%, and gains may owe capital-gains tax (a 1031 exchange can defer both). Figures are a year-1 estimate at your 24.0% rate — not tax advice; consult a CPA.
Schools (NCES district)
- District
- King William County Public School District
- NCES district ID
- 5102120
- Math proficiency
- 49% ▼ -28.00%
- Reading proficiency
- 67% ▼ -7.00%
- Median HH income
- $63,630
- Composite
- 50.65/100
- National rank
- #1834
- State rank
- #60 of 131 in VA
Livability — Central Garage
- Score
- 62/100
- State rank
- #392
- US rank
- #16210
Category grades
Schools grade is shown separately in the Schools card above.
Census & demographics
- Population (ZIP)
- 8,203
Population outlook (King William County) Hauer SSP2
- Today (2025)
- 16,840 people
- By 2030
- 16,990 · +0.9%
- By 2040
- 16,965 · +0.7%
- By 2050
- 16,483 · -2.1%
- By 2075
- 15,292 · -9.2%
- By 2100
- 12,764 · -24.2%
Race, ethnicity, and origin ACS 2023
- Neighborhood character
- Predominantly White (77%)
- Race & ethnicity
- White 77% Black 18% Hispanic / Latino 3% Two or more races 1%
- Common ancestry
- Italian 3% Lithuanian 2% Slovak 1%
- Foreign-born
- 2% · Canada
- Languages at home
- 98% English-only · Spanish 1%
Political lean MEDSL · King William
- 2024 margin
- Solid R (+40.6) · D 29.3% · R 69.9%
- 2008→2024 swing
- -21.2pp toward R · 2008: -19.3pp · 2024: -40.6pp
- All cycles
- 2024: R+40.6 2020: R+37.8 2016: R+35.3 2012: R+23.9 2008: R+19.3
Not yet ingested
- Civics
- —
Market trends
- HPI YoY
- ▼ -90.14%
- Current HPI
- 177.564
- Rent YoY
- —
- Metro
- —
- State GDP YoY
- ▲ 2.40%
- F500 in state
- 50
Industry mix (Fortune 500 HQ in VA)
| Industry | F500 HQs | Revenue |
|---|---|---|
| Aerospace / Defense | 4 | $236B |
|
||
| Technology / Defense | 3 | $32B |
|
||
| Financial Services | 2 | $176B |
|
||
| Utilities | 2 | $27B |
|
||
| Insurance | 2 | $25B |
|
||
| Technology | 2 | $15B |
|
||
Price history
+137.4% since first listed2 events — show timeline
- 2026-06-08 Listed $189,950 CVRMLS
- 1994-11-01 Sold (Public Records) $80,000 Public Records
Property tax history
-1.8%/yrLatest (2025): $863 · +5.9% YoY. Source: county tax records.
Cash-flow waterfall
monthlySold comps — $/sqft
last 12 mo · ≤1 miLoading sold comps…