309 E 39th St · Garden City, ID
Flood risk 1/10 · Minimal
- FEMA flood zone
- AE
- Chance of flooding over 30 yrs
- 0.0%
- Est. flood insurance / yr
- $1,737 – $8,500
Fire risk 3/10 · Minor
- Est. fire insurance / yr
- $584 – $1,086
Heat risk 5/10 · Moderate
- Hot days now (above 96°F)
- 7 days/yr
- Hot days in 30 yrs
- 18 days/yr
Wind risk 1/10 · Minimal
- Chance of severe wind over 30 yrs
- —
Air-quality risk 8/10 · Major
- Unhealthy air days now
- 14 days/yr
- Unhealthy air days in 30 yrs
- 19 days/yr
Risk factors via First Street. Map © Google.
Why this score? — see what drove the B grade
The composite is a weighted blend of 9 inputs, each scored 0–100. Each bar is that input's sub-score; the figure is the points it added to the 100-point composite (weight × sub-score).
- Cash flow +30.0/30.0
- 1% rule +10.0/10.0
- DSCR +10.0/10.0
- ARV discount +6.0/15.0
- Schools +4.2/10.0
- Livability +4.1/5.0
- Rent growth +3.7/5.0
- Condition / age +2.5/5.0
- Appreciation +0.0/10.0
$39,900
🖨 Deal sheet (PDF) 📄 Offer letter ✓ Due diligence
Listing remarks
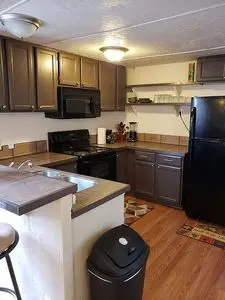
Well-maintained, remodeled in the last 7 years, one bedroom, one bath mobile home. A short walk to the Greenbelt in a quiet mobile home park. All appliances included. Fully fenced yard, pets allowed with park approval. Approval from trailer park property management company required prior to purchase. $850/ month lot rent.
Key facts
- Fully fenced yard
- Built 1976
- Listed 10 days
Tags
Neighborhood map
What this means for you Summary
Snapshot
- This is a 1-bed/1.0-bath manufactured listed at $40k.
Deal economics
- At list price, monthly cash flow is $305 ($4k/yr) — positive.
- The deal already cash-flows at list — no discount required.
- Meets the 1% rule at list price ($1k rent vs $40k).
- Cap rate 28.3% vs local median 2.5% in Garden City — top-decile yield for the area; either an underpriced asset or a hidden risk that comps aren't pricing in. Stress-test before assuming the spread holds.
Location & tenants
- Location reads 82/100 on livability (#11 in ID, #1,264 nationally) — a professional / high-income tenant draw. Strengths: commute A+, health & safety A+, housing A; Watch: crime F.
- Boise Independent District (urban): math 42% / reading 56% proficiency, ranked #36 of 92 in ID (top 39%) — families likely to look elsewhere, expect single-tenant / working-renter base with shorter leases.
- Zoned schools: Whittier Elementary School (math 31% / reading 38%, grade F, #272 of 357 statewide, top 80%, 572 students, 99% FRL); North Junior High School (math 54% / reading 71%, grade B+, #7 of 109 statewide, top 6%, 876 students, 12% FRL); Boise Senior High School (math 58% / reading 75%, grade B, #9 of 169 statewide, top 5%, 1,588 students, 15% FRL).
- Market conditions: Rents rising fast (+4.9%/yr); 448 active listings in the ZIP; 22 comparable units currently listed for rent nearby; rentals at typical pace (median 22d on market — plan ~3-4 weeks tenant-placement turnaround); solid renter incomes; 5,129 units permitted in Ada County in 2024 (414 in 5+ unit buildings).
- This rent is only 17% of the median local income ($88k/yr) — well below the 30% rent-burden line; pricing power to push rent on renewal without tenant pushback.
Forward outlook
- Local home prices are declining (-3.0%/yr); year-one equity from $276 of loan paydown is wiped out by about $1k of value loss. Plan a longer hold.
- Ada County population projected at +45% by 2050 — long-run rental-demand tailwind backs the buy-and-hold thesis.
- At projected returns (-3.0% appreciation + 4.9% rent growth), your $11k cash investment doubles in ~4 years — after that, you're playing with house money.
Negotiation context
- Only 10 days on market — expect competitive offers; lowballing is unlikely to land.
- 2 sale attempts since 21y ago with the ask held roughly flat each time — persistent listings suggest the price (not the market) is what's stuck; bring a comps-based counter.
Risks & watch-outs
- Watch-outs: flood insurance adds $427/mo.
- Climate carrying-cost: in FEMA flood zone AE (mandatory federal flood insurance); extreme-heat days projected 7→18/yr by 2055 (HVAC capex compounding) — expect insurance premiums to compound above CPI over the hold.
Questions for the listing agent
- Built in 1976 — when were the roof, HVAC, electrical panel, plumbing, and water heater last replaced?
- What's the actual annual flood-insurance premium (NFIP or private), and is the property in a SFHA with mandatory coverage?
- Is there a deadline driving the sale (1031 exchange, divorce, estate, relocation)? That informs how much negotiation room exists.
- Crime grade is F in this area — have there been break-ins, vandalism, or insurance claims at this property in the last 3 years? What carrier currently insures it and at what premium?
- What's the average days-on-market for RENTAL listings here right now (not sales)? A rising rental-DOM trend means longer vacancies and softer asking-rent achievability than the comps imply.
- What's the recent tenant-quality profile in this submarket — average credit score on applications, eviction rate, late-payment / NSF rate, and stable-employment percentage? A property-management company in the area should have these aggregated.
- How much new for-sale + rental construction is in the pipeline within 1–3 miles? Heavy new supply typically softens prices + rents 12–24 months out; constrained supply supports both.
Investment metrics
- 1% rule
- 3.20% ✓
- Cap rate
- 28.30%
- Cash-on-cash
- 78.61%
- DSCR
- 4.50
- GRM
- 2.6
CMA / ARV
- ARV (on-the-fly)
- $38,592
- Comps found
- 1
Show comp detail 1 sale within ~0.75 mi
| Address | Dist | Beds/Ba | Sqft | Sold | Price | $/sf | Match |
|---|---|---|---|---|---|---|---|
| 301 E 40th St #17 | 0.14mi | 2/1.0 (+1) | 640 (+11%) | 20mo | $43,000 | $67 | 53 |
Match score weights: distance 35% · size 25% · config 20% · recency 20%. Top-matched comps best support the ARV.
Projected returns pro-forma
-3.0% appreciation · 4.87% rent growth · sell at horizon
- IRR
- 31.9%
- Equity multiple
- 2.41×
- Total profit
- $15,708
- Equity at exit
- $5,949
- IRR
- 40.8%
- Equity multiple
- 5.50×
- Total profit
- $50,284
- Equity at exit
- $3,450
Cash invested: $11,172 (down + closing). Projections, not guarantees.
Landlord ↔ Tenant lean methodology
- Overall (STATE)
- 91 Strongly Landlord-Friendly
- State Idaho
- 91 Strongly Landlord-Friendly · R+18
- County
- — inherits STATE
- City
- — inherits STATE
ZIP-level market 83714
- Home prices YoY
- -31.5%
- Rents YoY
- 4.9%
- Active inventory
- 448
- Price-to-rent
- 2.6×
Monthly cashflow live
- Estimated rent
- $1,275 high interval (Pro) →
- Mortgage (P&I)
- −$209
- Tax est. 1.5%
- −$50 /mo · $598/yr
- Insurance
- −$17
- Flood insurance flood zone
- −$427 /mo · $5,118/yr
- HOA
- −$0
- Lot rent leased land?
- −$0
- Vacancy / Maint / Mgmt
- −$268
- Net cashflow
- $305
Break-even live
Sensitivity live
| Price | -10% $333 | -5% $319 | +0% $305 | +5% $292 | +10% $278 |
|---|---|---|---|---|---|
| Rent | -10% $205 | -5% $255 | +0% $305 | +5% $356 | +10% $406 |
| Rate | -1.0pp $325 | -0.5pp $315 | base $305 | +0.5pp $295 | +1.0pp $284 |
UW: 25.0% down · 7.5% · 30yr · 1.5% tax · 5.0% vac · 8.0% maint · 8.0% mgmt
Financing live
Cash to close
- Down payment
- $9,975
- Closing costs
- $1,197
- Reserves months
- —
- Total cash needed
- —
Loan-product check · same deal, 3 products live
Conventional
25% down · 7.5% · 30yr
- Down + closing
- —
- Monthly P&I
- —
- Monthly cashflow
- —
- DSCR
- —
- Eligible?
- —
Personal DTI + credit; lowest rate.
DSCR
20% down · 8.5% · 30yr
- Down + closing
- —
- Monthly P&I
- —
- Monthly cashflow
- —
- DSCR
- —
- Eligible?
- —
No personal income docs; deal must DSCR.
Hard money
10% down · 12.0% · 12mo
- Down + closing
- —
- Monthly P&I
- —
- Monthly cashflow
- —
- DSCR
- —
- Eligible?
- —
Short-term bridge; refi at stabilization.
Rent comps 22 comps
| Address | Beds | Baths | Sqft | Rent | $/sqft | DOM | Units | Dist |
|---|---|---|---|---|---|---|---|---|
| 331 E 40th St Garden City, ID | 2.0 | 2.0 | 678 | $1,875 | $2.77 | 5d | 1 | 0.14mi |
| 521 E 41st St Garden City, ID | 2.0 | 1.0–2.0 | 814 | $3,152 | $3.87 | 25d | 18 | 0.31mi |
| 385 E 42nd St Garden City, ID | 1.0–2.0 | 1.0–2.0 | 832 | $1,295 | $1.56 | 5d | 1 | 0.38mi |
| 4220 N Adams St Garden City, ID | 2.0 | 1.0–2.0 | 767 | $1,889 | $2.46 | 5d | 7 | 0.42mi |
| 1680 N Phillippi St Boise, ID | 1.0 | 1.0 | 450 | $1,145 | $2.54 | 25d | 1 | 0.76mi |
| 1901 N 32nd St Boise, ID | 2.0 | 1.0 | 616 | $1,245 | $2.02 | 25d | 1 | 0.85mi |
| 2815 Madison Ave Boise, ID | 1.0 | 1.0 | 423 | $1,240 | $2.93 | 5d | 3 | 0.87mi |
| 4632 N Iota Ln Unit 300 Garden City, ID | 1.0 | 1.0 | 563 | $1,375 | $2.44 | 25d | 1 | 0.92mi |
| 4632 N Iota Ln Unit 200 Garden City, ID | 1.0 | 1.0 | 563 | $1,375 | $2.44 | 21d | 1 | 0.92mi |
| 4633 N Iota Ln Unit 201 Garden City, ID | 1.0 | 1.0 | 563 | $1,375 | $2.44 | 25d | 1 | 0.92mi |
| 820 N 25th St Unit 1324051P Boise, ID | 1.0 | 1.0 | 592 | $2,361 | $3.99 | 5d | 1 | 1.08mi |
| 2407 W State St Unit 6 Boise, ID | 1.0 | 1.0 | 450 | $1,195 | $2.66 | 5d | 1 | 1.12mi |
| 603 N 23rd St Unit 6015 Boise, ID | 1.0 | 1.0 | 500 | $1,100 | $2.20 | 5d | 1 | 1.20mi |
| 2419 W Fairview Ave Boise, ID | 1.0–3.0 | 1.0–2.0 | 826 | $1,026 | $1.24 | 25d | 1 | 1.27mi |
| 1677 N Raymond St Boise, ID | 1.0 | 1.0 | 685 | $1,395 | $2.04 | 25d | 1 | 1.31mi |
| 1689 Shoreline Dr Boise, ID | 1.0 | 1.0 | 711 | $1,574 | $2.21 | 5d | 1 | 1.31mi |
| 3115 Sycamore Dr Boise, ID | 1.0 | 1.0 | 454 | $1,520 | $3.35 | 25d | 1 | 1.35mi |
| 1428 N Raymond St Unit 1408 104 Boise, ID | 1.0 | 1.0 | 740 | $1,195 | $1.61 | 25d | 1 | 1.36mi |
| 1408 N Raymond St Boise, ID | 1.0 | 1.0 | 740 | $1,195 | $1.61 | 25d | 1 | 1.37mi |
| 1105 N Liberty St Boise, ID | 1.0–2.0 | 1.0 | 727 | $1,599 | $2.20 | 16d | 4 | 1.44mi |
| 3304 N Lakeharbor Ln Boise, ID | 1.0–3.0 | 1.0–2.0 | 1000 | $1,619 | $1.62 | 5d | 16 | 1.44mi |
| 3304 N 36th St Boise, ID | — | 1.0 | 384 | $1,145 | $2.98 | 5d | 1 | 1.47mi |
Listing history 8 events
-
2026-06-22days on market $39,900 Active 10 DOM
-
2026-06-22days on market $39,900 Active 9 DOM
-
2026-06-18days on market $39,900 Active 6 DOM
-
2026-06-17days on market $39,900 Active 5 DOM
-
2026-06-16days on market $39,900 Active 4 DOM
-
2026-06-15days on market $39,900 Active 3 DOM
-
2026-06-13remarks 323-char remark
-
2026-06-13$39,900 Active 1 DOM
ⓘ Source: listings_history table (triggers on properties + properties_extension) + one-shot
backfill from property_details.listing_events for pre-trigger history.
Climate risk First Street
- Flood 1/10 Low FEMA zone AE · 0% chance over 30 yrs
- Wildfire 3/10 Moderate
- Heat 5/10 Major 7 d/yr ≥96°F today · 18 d/yr by 30 yrs out
- Wind 1/10 Low
- Air quality 8/10 Severe 14 unhealthy d/yr today · 19 by 30 yrs out
Nearby sold comps map
Loading sold comps map…
Walkable amenities ~0.75 mi
Loading nearby amenities…
Taxation est. · year 1
- Rental income
- $15,306
- − Mortgage interest
- −$2,235
- − Property taxes
- −$598
- − Insurance
- −$5,318
- − Repairs & maintenance
- −$1,224
- − Management
- −$1,224
- − Depreciation
- −$1,161
- Taxable income
- $3,544
- Est. tax owed @ 24.0%
- −$851
- After-tax cash flow
- $2,813/yr
For passive investors: Depreciation is non-cash, so a rental often shows a tax loss while cash-flowing — sheltering income. Rental losses are passive: they offset passive income freely, and up to $25,000/yr can offset ordinary (W-2) income if you actively participate and your MAGI is under $100k (phasing out to $0 by $150k); unused losses carry forward. On sale, claimed depreciation is recaptured at up to 25%, and gains may owe capital-gains tax (a 1031 exchange can defer both). Figures are a year-1 estimate at your 24.0% rate — not tax advice; consult a CPA.
Schools (NCES district)
- District
- Boise Independent District
- NCES district ID
- 1600360
- Math proficiency
- 42% ▼ -5.00%
- Reading proficiency
- 56% ▼ -1.00%
- Median HH income
- $49,135
- Composite
- 41.82/100
- National rank
- #3388
- State rank
- #36 of 92 in ID
Livability — Garden City
- Score
- 82/100
- State rank
- #11
- US rank
- #1264
Category grades
Schools grade is shown separately in the Schools card above.
Census & demographics
- Census place
- Garden City, ID
- County
- Ada County · 522,161 people
- Metro
- Boise City, ID
- Population (ZIP)
- 27,564
- Household income
- $87,651
- Rent vs Own
- Severe rent burden
- 557.0
Population outlook (Ada County) Hauer SSP2
- Today (2025)
- 535,818 people
- By 2030
- 585,751 · +9.3%
- By 2040
- 682,435 · +27.4%
- By 2050
- 775,818 · +44.8%
- By 2075
- 994,458 · +85.6%
- By 2100
- 1,148,884 · +114.4%
Race, ethnicity, and origin ACS 2023
- Neighborhood character
- Predominantly White (86%)
- Race & ethnicity
- White 86% Hispanic / Latino 9% Two or more races 7%
- Hispanic origin (detail)
- Mexican 7%
- Common ancestry
- Italian 4% Slovak 4% Portuguese 4%
- Foreign-born
- 5% · Canada
- Languages at home
- 92% English-only · Spanish 5% Russian/Polish/Slavic 2% Other Indo-European 1%
Political lean MEDSL · Ada
- 2024 margin
- R (+10.3) · D 43.4% · R 53.8% · Other 2.8%
- 2008→2024 swing
- -4.2pp toward R · 2008: -6.2pp · 2024: -10.3pp
- All cycles
- 2024: R+10.3 2020: R+3.9 2016: R+9.2 2012: R+11.3 2008: R+6.2
Not yet ingested
- Civics
- —
Market trends
- HPI YoY
- ▼ -155.87%
- Current HPI
- 339.0701
- Rent YoY
- ▲ 4.87%
- Metro
- Boise City, ID
- State GDP YoY
- ▲ 4.51%
- F500 in state
- 6
Industry mix (Fortune 500 HQ in ID)
| Industry | F500 HQs | Revenue |
|---|---|---|
| Retail | 1 | $79B |
|
||
| Technology | 1 | $25B |
|
||
| Food / Agriculture | 1 | $6B |
|
||
Price history
+398.8% since first listed3 events — show timeline
- 2026-06-13 Listed $39,900 FSBO.com
- 2005-12-12 Sold (MLS) — IMLS
- 2005-10-31 Listed $8,000 IMLS
Cash-flow waterfall
monthlySold comps — $/sqft
last 12 mo · ≤1 miLoading sold comps…