2137 Presidio Ct · Danville, CA
Flood risk 1/10 · Minimal
- FEMA flood zone
- X (unshaded)
- Chance of flooding over 30 yrs
- 0.0%
- Est. flood insurance / yr
- $507 – $1,088
Fire risk 6/10 · Moderate
- Est. fire insurance / yr
- $659 – $1,223
Heat risk 3/10 · Minor
- Hot days now (above 96°F)
- 7 days/yr
- Hot days in 30 yrs
- 14 days/yr
Wind risk 1/10 · Minimal
- Chance of severe wind over 30 yrs
- —
Air-quality risk 8/10 · Major
- Unhealthy air days now
- 14 days/yr
- Unhealthy air days in 30 yrs
- 15 days/yr
Risk factors via First Street. Map © Google.
Why this score? — see what drove the D grade
The composite is a weighted blend of 9 inputs, each scored 0–100. Each bar is that input's sub-score; the figure is the points it added to the 100-point composite (weight × sub-score).
- ARV discount +15.0/15.0
- Schools +7.6/10.0
- Appreciation +5.3/10.0
- Rent growth +3.9/5.0
- Livability +3.9/5.0
- Condition / age +2.5/5.0
- Cash flow +2.0/30.0
- 1% rule +0.0/10.0
- DSCR +0.0/10.0
$950,000
🖨 Deal sheet (PDF) 📄 Offer letter ✓ Due diligence
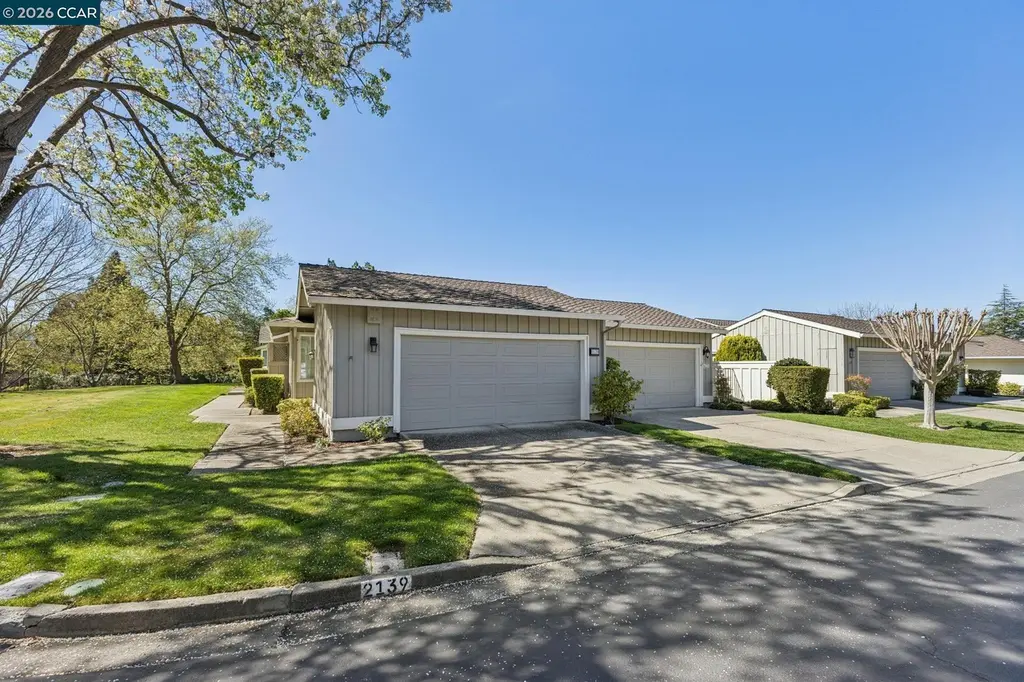
Listing remarks
Nestled at the end of a court along the 6th fairway—close to the main gate & Country Club—this charming one-story Fairway Villa is now available at an exciting price! This offers an incredible opportunity to make this sought-after home your own & update it to your personal tastes. The popular floor plan features direct interior access from the garage, conveniently located off the kitchen and laundry room, making daily tasks a breeze. Vaulted ceilings in the entry and dining room add a sense of spaciousness rarely found in this model. The home is filled with natural light throughout and boasts brand-new laminate wood flooring. The updated kitchen provides abundant cou
Key facts
- Natural light
- Skylight
- Gas range
Tags
Property features AI
Finance
- HOA & community: Part of an association (Crow Canyon Country Club); Association amenities include greenbelt, community pool, gated community; Pets allowed; Monthly association fee (includes reserves, insurance, management fee, hazard insurance, common area maintenance, exterior maintenance)
Exterior
- Parking: Attached garage with interior access; 2 garage spaces (covered)
- Utilities: Public water; Public sewer
- Home design: Residential townhouse; Built in 1979; Model: Pinehurst; Raised foundation
- Construction: Wood siding construction; Shingle roof
- Exterior features: Patio; On golf course; Court
Interior
- Kitchen: Breakfast nook / eat-in kitchen; Solid-surface counters; Dishwasher; Gas range / free-standing range; Range/oven (free standing); Disposal; Refrigerator; Skylight in kitchen; Updated kitchen
- Bedrooms: 2 bedrooms (street level); Primary bedroom suite (street level)
- Flooring: Laminate flooring; Tile flooring
- Bathrooms: 2 full bathrooms; Primary bathroom with solid-surface counters, stall shower and tile; Additional bathroom with shower over tub and tile; Both bathrooms updated
- Heating & cooling: Forced-air heating; Central air conditioning
- Interior features: Atrium; Breakfast nook; Solid-surface countertops; Updated kitchen; Skylights; Double-pane windows; Living room fireplace; Crawl space
- Laundry & utility: Laundry room with washer and dryer included
Neighborhood map
What this means for you Summary
Snapshot
- This is a 2-bed/2.0-bath townhouse listed at $950k.
Deal economics
- At list price, monthly cash flow is $-4k ($-42k/yr) — negative.
- To cash-flow at today's rent, offer at most $331k (65.1% below list).
- To meet the 1% rule (rent ≥ 1% of price), the offer needs to be $356k (62.5% below list).
- Recommended offer: $331k (65.1% below list) — sets the bar for cash-flow.
- Cap rate 1.9% vs local median 1.3% in Danville — top-decile yield for the area; either an underpriced asset or a hidden risk that comps aren't pricing in. Stress-test before assuming the spread holds.
Location & tenants
- Location reads 77/100 on livability (#79 in CA, #3,007 nationally) — a middle-class / working-renter tenant base. Strengths: crime A+, commute A+, employment A+; Watch: amenities D, cost of living F.
- San Ramon Valley Unified (suburban): math 77% / reading 81% proficiency, ranked #28 of 1,400 in CA (top 2%) — strong family-tenant draw, lease renewals of 3-5y typical; only 3% free/reduced lunch — higher-income household profile.
- Zoned schools: Greenbrook Elementary (657 students, 4% FRL); Charlotte Wood Middle (878 students, 5% FRL); San Ramon Valley High (math 24% / reading 24%, grade F, #826 of 1,170 statewide, top 80%, 1,981 students, 5% FRL) — zoned schools at 5% FRL track the district average.
- Zoned-school proficiency averages 24% at this address vs 79% district-wide (-54 pts) — the specific schools serving this property underperform the San Ramon Valley Unified average; the district grade overstates school quality for this exact location.
- Market conditions: Rents rising fast (+5.7%/yr); 143 active listings in the ZIP; 24 comparable units currently listed for rent nearby; rentals leasing fast (median 7d on market — plan ~1-2 weeks tenant-placement turnaround); high-income renter base; 2,169 units permitted in Contra Costa County in 2024 (896 in 5+ unit buildings).
Forward outlook
- In year one you build about $13k of equity ($7k loan paydown + $6k appreciation (0.7% local appreciation)).
- Contra Costa County population projected at +26% by 2050 — long-run rental-demand tailwind backs the buy-and-hold thesis.
- By year 5, paydown + projected appreciation supports a ~$63k cash-out refi (75% LTV) — recoverable capital for the next deal without selling this one.
Negotiation context
- It's been on market 43 days — a 3% lower offer ($922k) is reasonable based on typical stale-listing flexibility.
- 3 sale attempts; this cycle's ask is 27043% above the opening price — seller raised mid-cycle; expect resistance to lowballs.
- Current owner paid $160k; list at $950k implies a 494% gain — meaningful room to come down on a strong offer.
Risks & watch-outs
- Climate carrying-cost: major wildfire risk — expect insurance premiums to compound above CPI over the hold.
Questions for the listing agent
- What do current leases actually rent for vs. the listed asking? Can we see a recent rent roll and the last 12 months of T-12 income?
- It's been on market 43 days. Have you received any prior offers? Is the seller open to a 65% concession, seller financing, or rate buy-down credit?
- Built in 1979 — when were the roof, HVAC, electrical panel, plumbing, and water heater last replaced?
- What does the HOA fee cover, when was the last increase, and are there any pending special assessments or reserve-fund shortfalls?
- Is there a deadline driving the sale (1031 exchange, divorce, estate, relocation)? That informs how much negotiation room exists.
- Schools are A-rated — typically a magnet for longer-tenancy family renters. What's the average tenant stay here, and is there a school-zone premium baked into asking?
- The area grade is low — what's the realistic commute time and amenity access for the typical tenant pool here? Any planned neighborhood developments (good or bad) we should know about?
- What's the average days-on-market for RENTAL listings here right now (not sales)? A rising rental-DOM trend means longer vacancies and softer asking-rent achievability than the comps imply.
- What's the recent tenant-quality profile in this submarket — average credit score on applications, eviction rate, late-payment / NSF rate, and stable-employment percentage? A property-management company in the area should have these aggregated.
- How much new for-sale + rental construction is in the pipeline within 1–3 miles? Heavy new supply typically softens prices + rents 12–24 months out; constrained supply supports both.
Investment metrics
- 1% rule
- 0.38% ✗
- Cap rate
- 1.87%
- Cash-on-cash
- -15.80%
- DSCR
- 0.30
- GRM
- 22.2
CMA / ARV
- ARV (median comp)
- $1,218,112
- List price
- $950,000
- Delta
- -22.01%
- Verdict
- UNDERPRICED
- Comps
- 20 within 1.0 mi
Show comp detail 12 sales within ~0.75 mi
| Address | Dist | Beds/Ba | Sqft | Sold | Price | $/sf | Match |
|---|---|---|---|---|---|---|---|
| 1918 Saint George Rd | 0.38mi | 2/2.0 | 1,364 (0%) | 7mo | $1,120,000 | $821 | 76 |
| 537 Rolling Hills Ln | 0.41mi | 2/2.0 | 1,436 (+5%) | 0mo | $1,110,000 | $773 | 72 |
| 3406 Fostoria Way #313 | 0.36mi | 3/2.5 (+1) | 1,375 (+1%) | 6mo | $830,000 | $604 | 70 |
| 631 Silver Lake Dr | 0.35mi | 2/2.0 | 1,436 (+5%) | 7mo | $1,068,888 | $744 | 69 |
| 531 Silver Lake Dr | 0.54mi | 2/2.0 | 1,448 (+6%) | 0mo | $1,050,000 | $725 | 64 |
| 1942 Rancho Verde Cir E | 0.32mi | 3/2.0 (+1) | 1,539 (+13%) | 1mo | $1,080,000 | $702 | 58 |
| 108 Norris Canyon Pl Unit D | 0.39mi | 2/2.0 | 1,179 (-14%) | 1mo | $729,000 | $618 | 58 |
| 3045 Fostoria Cir | 0.42mi | 3/2.0 (+1) | 1,233 (-10%) | 3mo | $635,000 | $515 | 57 |
| 1844 Saint George Rd | 0.48mi | 2/2.0 | 1,506 (+10%) | 7mo | $1,180,000 | $784 | 54 |
| 2131 Myrtle Beach Ln | 0.40mi | 3/2.0 (+1) | 1,553 (+14%) | 2mo | $1,125,000 | $724 | 51 |
| 1864 Saint George Rd | 0.47mi | 3/2.0 (+1) | 1,553 (+14%) | 1mo | $1,200,000 | $773 | 50 |
| 644 Doral Dr | 0.56mi | 3/2.0 (+1) | 1,550 (+14%) | 7mo | $1,325,000 | $855 | 40 |
Match score weights: distance 35% · size 25% · config 20% · recency 20%. Top-matched comps best support the ARV.
Projected returns pro-forma
0.67% appreciation · 5.72% rent growth · sell at horizon
- IRR
- -16.1%
- Equity multiple
- 0.21×
- Total profit
- $-210,471
- Equity at exit
- $308,310
- IRR
- -8.4%
- Equity multiple
- -0.01×
- Total profit
- $-267,359
- Equity at exit
- $397,613
Cash invested: $266,000 (down + closing). Projections, not guarantees.
Landlord ↔ Tenant lean methodology
- Overall (STATE)
- 18 Strongly Tenant-Friendly
- State California
- 18 Strongly Tenant-Friendly · D+13
- County
- — inherits STATE
- City
- — inherits STATE
ZIP-level market 94526
- Home prices YoY
- 0.2%
- Rents YoY
- 5.7%
- Active inventory
- 143
- Price-to-rent
- 22.2×
Monthly cashflow live
- Estimated rent
- $3,565 high interval (Pro) →
- Mortgage (P&I)
- −$4,982
- Tax from tax record
- −$376 /mo · $4,507/yr
- Insurance
- −$396
- HOA
- −$566
- Vacancy / Maint / Mgmt
- −$749
- Net cashflow
- $-3,503
Break-even live
Sensitivity live
| Price | -10% $-2,965 | -5% $-3,234 | +0% $-3,503 | +5% $-3,772 | +10% $-4,041 |
|---|---|---|---|---|---|
| Rent | -10% $-3,785 | -5% $-3,644 | +0% $-3,503 | +5% $-3,362 | +10% $-3,222 |
| Rate | -1.0pp $-3,025 | -0.5pp $-3,262 | base $-3,503 | +0.5pp $-3,749 | +1.0pp $-4,000 |
UW: 25.0% down · 7.5% · 30yr · 1.5% tax · 5.0% vac · 8.0% maint · 8.0% mgmt
Financing live
Cash to close
- Down payment
- $237,500
- Closing costs
- $28,500
- Reserves months
- —
- Total cash needed
- —
Loan-product check · same deal, 3 products live
Conventional
25% down · 7.5% · 30yr
- Down + closing
- —
- Monthly P&I
- —
- Monthly cashflow
- —
- DSCR
- —
- Eligible?
- —
Personal DTI + credit; lowest rate.
DSCR
20% down · 8.5% · 30yr
- Down + closing
- —
- Monthly P&I
- —
- Monthly cashflow
- —
- DSCR
- —
- Eligible?
- —
No personal income docs; deal must DSCR.
Hard money
10% down · 12.0% · 12mo
- Down + closing
- —
- Monthly P&I
- —
- Monthly cashflow
- —
- DSCR
- —
- Eligible?
- —
Short-term bridge; refi at stabilization.
Rent comps 24 comps
| Address | Beds | Baths | Sqft | Rent | $/sqft | DOM | Units | Dist |
|---|---|---|---|---|---|---|---|---|
| 410 Norris Canyon Ter San Ramon, CA | 2.0 | 1.0 | 1009 | $2,895 | $2.87 | 1d | 1 | 0.28mi |
| 332 Norris Canyon Ter San Ramon, CA | 2.0 | 2.0 | 1150 | $3,325 | $2.89 | 7d | 1 | 0.36mi |
| 318 Norris Canyon Ter San Ramon, CA | 2.0 | 2.0 | 1070 | $3,300 | $3.08 | 7d | 1 | 0.36mi |
| 4728 Norris Canyon Rd #205 San Ramon, CA | 3.0 | 2.0 | 951 | $3,200 | $3.36 | 26d | 1 | 0.45mi |
| 4720 Norris Canyon Rd #102 San Ramon, CA | 3.0 | 2.0 | 951 | $3,350 | $3.52 | 45d | 1 | 0.46mi |
| 3081 Fostoria Cir Danville, CA | 3.0 | 2.0 | 1233 | $3,400 | $2.76 | 20d | 1 | 0.52mi |
| 3873 Crow Canyon Rd San Ramon, CA | 2.0 | 2.0 | 1107 | $3,250 | $2.94 | 45d | 1 | 0.59mi |
| 1705 Cinnabar Ct San Ramon, CA | 3.0 | 4.0 | 1716 | $4,500 | $2.62 | 45d | 1 | 0.65mi |
| 5022 Lakeview Dr #101 San Ramon, CA | 3.0 | 2.0 | 1309 | $3,900 | $2.98 | 7d | 1 | 0.97mi |
| 910 Vista Pointe Dr San Ramon, CA | 3.0 | 2.5 | 1727 | $4,500 | $2.61 | 26d | 1 | 1.01mi |
| 1102 Vista Pointe Cir San Ramon, CA | 3.0 | 2.5 | 1471 | $4,100 | $2.79 | 7d | 1 | 1.10mi |
| 1000 Canyon Village Cir San Ramon, CA | 1.0–2.0 | 1.0–2.0 | 881 | $3,000 | $3.40 | 0d | 14 | 1.10mi |
| 453 Carillo Ct San Ramon, CA | 3.0 | 1.5 | 1200 | $3,350 | $2.79 | 17d | 1 | 1.21mi |
| 481 Carillo Ct San Ramon, CA | 2.0 | 1.0 | 954 | $2,900 | $3.04 | 13d | 1 | 1.24mi |
| 560 La Copita Ct San Ramon, CA | 3.0 | 1.5 | 1200 | $3,300 | $2.75 | 45d | 1 | 1.25mi |
| 505 Mission Pl Danville, CA | 3.0 | 2.0 | 1334 | $3,700 | $2.77 | 0d | 1 | 1.27mi |
| 2000 Shoreline Loop San Ramon, CA | 2.0 | 1.0–2.0 | 775 | $3,999 | $5.16 | 0d | 23 | 1.32mi |
| 1830 Mockingbird Pl Danville, CA | 3.0 | 2.5 | 1705 | $4,700 | $2.76 | 4d | 1 | 1.35mi |
| 1700 Promontory Ter San Ramon, CA | 1.0–3.0 | 1.0–2.0 | 953 | $3,402 | $3.57 | 0d | 16 | 1.36mi |
| 211 Skyline Dr San Ramon, CA | 3.0 | 3.0 | 1317 | $3,850 | $2.92 | 45d | 1 | 1.37mi |
| 401 Canyon Woods Pl San Ramon, CA | 2.0 | 1.0–2.0 | 775 | $3,622 | $4.67 | 0d | 11 | 1.39mi |
| 601 Destiny Ln San Ramon, CA | 2.0 | 2.0 | 1027 | $3,395 | $3.31 | 7d | 1 | 1.41mi |
| 330 Eastridge Dr San Ramon, CA | 2.0 | 2.0 | 1058 | $2,800 | $2.65 | 5d | 1 | 1.43mi |
| 331 Eastridge Dr San Ramon, CA | 2.0 | 1.0 | 985 | $2,550 | $2.59 | 22d | 1 | 1.46mi |
HOA detail
- Monthly dues
- $566 · $6,792/yr
Listing history 13 events
-
2026-06-09days on market $950,000 Active 43 DOM
-
2026-06-08days on market $950,000 Active 42 DOM
-
2026-06-07days on market $950,000 Active 41 DOM
-
2026-06-04days on market $950,000 Active 38 DOM
-
2026-06-03days on market $950,000 Active 37 DOM
-
2026-06-02days on market $950,000 Active 36 DOM
-
2026-06-01days on market $950,000 Active 35 DOM
-
2026-05-31days on market $950,000 Active 34 DOM
-
2026-04-27historical
-
2026-04-27$950,000 Active 1466-char remark
-
2026-04-17price
-
2026-03-20Active
-
1988-05-27soldstatus $160,000
ⓘ Source: listings_history table (triggers on properties + properties_extension) + one-shot
backfill from property_details.listing_events for pre-trigger history.
Tax reassessment forecast CA · Resets to sale price
- Current annual tax
- $4,507 · $376/mo
- Projected year-2 tax
- $7,220 · $602/mo
- Expected delta
- +$2,713/yr (+$226/mo · 60.2%)
ⓘ Screening estimate from a state-policy table — verify with the county assessor before closing.
Climate risk First Street
- Flood 1/10 Low FEMA zone X (unshaded) · 0% chance over 30 yrs
- Wildfire 6/10 Major
- Heat 3/10 Moderate 7 d/yr ≥96°F today · 14 d/yr by 30 yrs out
- Wind 1/10 Low
- Air quality 8/10 Severe 14 unhealthy d/yr today · 15 by 30 yrs out
Nearby sold comps map
Loading sold comps map…
Walkable amenities ~0.75 mi
Loading nearby amenities…
Taxation est. · year 1
- Rental income
- $42,777
- − Mortgage interest
- −$53,215
- − Property taxes
- −$4,507
- − Insurance
- −$4,750
- − Repairs & maintenance
- −$3,422
- − Management
- −$3,422
- − HOA
- −$6,792
- − Depreciation
- −$27,636
- Taxable loss
- −$60,967
- Est. tax savings @ 24.0%
- +$14,632
- After-tax cash flow
- $-27,406/yr
For passive investors: Depreciation is non-cash, so a rental often shows a tax loss while cash-flowing — sheltering income. Rental losses are passive: they offset passive income freely, and up to $25,000/yr can offset ordinary (W-2) income if you actively participate and your MAGI is under $100k (phasing out to $0 by $150k); unused losses carry forward. On sale, claimed depreciation is recaptured at up to 25%, and gains may owe capital-gains tax (a 1031 exchange can defer both). Figures are a year-1 estimate at your 24.0% rate — not tax advice; consult a CPA.
Schools (NCES district)
- District
- San Ramon Valley Unified
- NCES district ID
- 0635130
- Math proficiency
- 77% ▬ 0.00%
- Reading proficiency
- 81% ▼ -1.00%
- Median HH income
- $138,331
- Composite
- 76.08/100
- National rank
- #216
- State rank
- #28 of 1400 in CA
Livability — Danville
- Score
- 77/100
- State rank
- #79
- US rank
- #3007
Category grades
Schools grade is shown separately in the Schools card above.
Census & demographics
- Census place
- Danville, CA
- County
- Contra Costa County · 1,059,880 people
- City population
- 59,639
- Metro
- San Francisco-Oakland-Berkeley, CA
- Population (ZIP)
- 32,584
- Household income
- $225,097
- Rent vs Own
- Severe rent burden
- 440.0
Population outlook (Contra Costa County) Hauer SSP2
- Today (2025)
- 1,287,720 people
- By 2030
- 1,364,937 · +6.0%
- By 2040
- 1,506,209 · +17.0%
- By 2050
- 1,624,373 · +26.1%
- By 2075
- 1,853,193 · +43.9%
- By 2100
- 1,901,231 · +47.6%
Race, ethnicity, and origin ACS 2023
- Neighborhood character
- Predominantly White (69%)
- Race & ethnicity
- White 69% Asian 16% Two or more races 9% Hispanic / Latino 9%
- Hispanic origin (detail)
- Mexican 5%
- Common ancestry
- Romanian 3% Italian 3% Slovak 3%
- Foreign-born
- 17% · China, Canada, South Korea
- Languages at home
- 83% English-only · Chinese 4% Other Indo-European 4% Spanish 3%
Political lean MEDSL · Contra Costa
- 2024 margin
- Solid D (+38.0) · D 67.3% · R 29.4% · Other 3.3%
- 2008→2024 swing
- +0.2pp no change · 2008: 37.8pp · 2024: 38.0pp
- All cycles
- 2024: D+38.0 2020: D+45.3 2016: D+43.5 2012: D+33.7 2008: D+37.8
Not yet ingested
- Civics
- —
Market trends
- HPI YoY
- ▲ 0.67%
- Current HPI
- 338.4779
- Rent YoY
- ▲ 5.72%
- Metro
- San Francisco-Oakland-Berkeley, CA
- State GDP YoY
- ▲ 3.21%
- F500 in state
- 116
Industry mix (Fortune 500 HQ in CA)
| Industry | F500 HQs | Revenue |
|---|---|---|
| Technology | 27 | $1,492B |
|
||
| Financial Services | 3 | $174B |
|
||
| Retail | 3 | $44B |
|
||
| Insurance | 3 | $26B |
|
||
| Media / Entertainment | 2 | $115B |
|
||
| Pharmaceuticals / Biotech | 2 | $62B |
|
||
Price history
-97.8% since first listed8 events — show timeline
- 2026-06-10 Rental Removed $3,500 BRIDGEMLS
- 2026-06-10 Listing Removed — bridgeMLS, Bay East AOR, or Contra Costa AOR
- 2026-06-03 Listed for Rent $3,500 BRIDGEMLS
- 2026-04-27 Listing Removed — bridgeMLS, Bay East AOR, or Contra Costa AOR
- 2026-04-27 Listed — bridgeMLS, Bay East AOR, or Contra Costa AOR
- 2026-04-17 Price Changed — bridgeMLS, Bay East AOR, or Contra Costa AOR
- 2026-03-20 Listed — bridgeMLS, Bay East AOR, or Contra Costa AOR
- 1988-05-27 Sold (Public Records) $160,000 Public Records
Property tax history
+2.2%/yrLatest (2025): $4,507 · +3.3% YoY. Source: county tax records.
Cash-flow waterfall
monthlySold comps — $/sqft
last 12 mo · ≤1 miLoading sold comps…