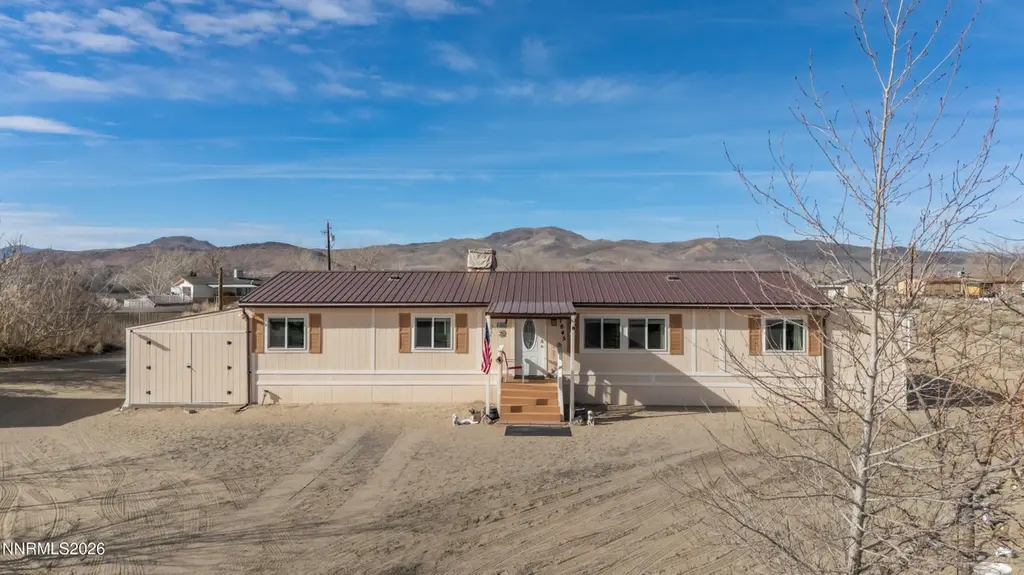
7645 Bass St · Silver Springs, NV
Flood risk 4/10 · Minor
- FEMA flood zone
- X (unshaded)
- Chance of flooding over 30 yrs
- 0.22%
- Est. flood insurance / yr
- $507 – $1,088
Fire risk 4/10 · Minor
- Est. fire insurance / yr
- $490 – $910
Heat risk 6/10 · Moderate
- Hot days now (above 96°F)
- 7 days/yr
- Hot days in 30 yrs
- 19 days/yr
Wind risk 1/10 · Minimal
- Chance of severe wind over 30 yrs
- —
Air-quality risk 8/10 · Major
- Unhealthy air days now
- 16 days/yr
- Unhealthy air days in 30 yrs
- 17 days/yr
Risk factors via First Street. Map © Google.
Why this score? — see what drove the D- grade
The composite is a weighted blend of 9 inputs, each scored 0–100. Each bar is that input's sub-score; the figure is the points it added to the 100-point composite (weight × sub-score).
- ARV discount +11.5/15.0
- Appreciation +8.2/10.0
- Cash flow +6.6/30.0
- Livability +3.2/5.0
- Rent growth +2.5/5.0
- Condition / age +2.5/5.0
- Schools +2.4/10.0
- 1% rule +1.7/10.0
- DSCR +0.9/10.0
$298,000
🖨 Deal sheet (PDF) 📄 Offer letter ✓ Due diligence
Listing remarks MLS
Looking for room to breathe? Welcome to this well-maintained 1-acre horse property located in Silver Springs. This 3-bedroom, 2-bath home offers over 1,300 sq. ft. of living space and features a carport, additional storage, and RV access with full hookups. The property is fully fenced and ideal for animals, recreation, or extra parking. Conveniently located just down the road from Lahontan Lake State Park, with quick access to USA Parkway and an easy commute to Reno or Carson City. Enjoy peaceful rural living with nearby amenities and outdoor recreation.
Key facts
- Fully fenced
- Nearby amenities
- Additional storage
Tags
Neighborhood map
What this means for you Summary
Snapshot
- This is a 3-bed/2.0-bath manufactured listed at $298k.
Deal economics
- At list price, monthly cash flow is $-486 ($-6k/yr) — negative.
- To cash-flow at today's rent, offer at most $228k (23.6% below list).
- To meet the 1% rule (rent ≥ 1% of price), the offer needs to be $199k (33.2% below list).
- Recommended offer: $199k (33.2% below list) — sets the bar for 1% rule.
Location & tenants
- Location reads 65/100 on livability (#42 in NV) — a middle-class / working-renter tenant base. Strengths: cost of living A+, housing A+, health & safety A-; Watch: schools F, amenities F, commute F.
- Lyon County School District (town): math 21% / reading 35% proficiency, ranked #14 of 17 in NV (top 82%) — low school quality limits family demand, transient renter base, plan for 1-2y turnover.
- Market conditions: 249 active listings in the ZIP; 297 units permitted in Lyon County in 2024 (80 in 5+ unit buildings).
Forward outlook
- In year one you build about $21k of equity ($2k loan paydown + $19k appreciation (6.4% local appreciation)).
- Lyon County population projected at -20% by 2050 — secular population decline; favor cash flow + early exit over multi-decade hold.
- By year 2, paydown + projected appreciation supports a ~$34k cash-out refi (75% LTV) — recoverable capital for the next deal without selling this one.
Negotiation context
- It's been on market 133 days — a 12% lower offer ($262k) is reasonable based on typical stale-listing flexibility.
- 3 sale attempts since 22y ago; this cycle's ask has dropped $27k (8%) from the opening price — seller is motivated, your offer sets the floor, not the list.
- Current owner paid $35k; list at $298k implies a 751% gain — meaningful room to come down on a strong offer.
Risks & watch-outs
- Climate carrying-cost: extreme-heat days projected 7→19/yr by 2055 (HVAC capex compounding) — expect insurance premiums to compound above CPI over the hold.
Questions for the listing agent
- What do current leases actually rent for vs. the listed asking? Can we see a recent rent roll and the last 12 months of T-12 income?
- It's been on market 133 days. Have you received any prior offers? Is the seller open to a 33% concession, seller financing, or rate buy-down credit?
- Why hasn't it sold? Are there any deal-killer items the seller is aware of (foundation, flood, title, zoning, code violations)?
- Is there a deadline driving the sale (1031 exchange, divorce, estate, relocation)? That informs how much negotiation room exists.
- Schools are F-rated, which usually means shorter tenancies and higher turnover. Who's the typical renter profile here, and what's been the actual vacancy rate?
- The area grade is low — what's the realistic commute time and amenity access for the typical tenant pool here? Any planned neighborhood developments (good or bad) we should know about?
- What's the average days-on-market for RENTAL listings here right now (not sales)? A rising rental-DOM trend means longer vacancies and softer asking-rent achievability than the comps imply.
- What's the recent tenant-quality profile in this submarket — average credit score on applications, eviction rate, late-payment / NSF rate, and stable-employment percentage? A property-management company in the area should have these aggregated.
- How much new for-sale + rental construction is in the pipeline within 1–3 miles? Heavy new supply typically softens prices + rents 12–24 months out; constrained supply supports both.
Investment metrics
- 1% rule
- 0.67% ✗
- Cap rate
- 4.34%
- Cash-on-cash
- -6.99%
- DSCR
- 0.69
- GRM
- 12.5
CMA / ARV
- ARV (median comp)
- $327,038
- List price
- $298,000
- Delta
- -8.88%
- Verdict
- FAIR
- Comps
- 9 within 1.0 mi
Show comp detail 4 sales within ~0.75 mi
| Address | Dist | Beds/Ba | Sqft | Sold | Price | $/sf | Match |
|---|---|---|---|---|---|---|---|
| 7855 Remington Rd | 0.44mi | 3/2.0 | 1,344 (+2%) | 8mo | $243,664 | $181 | 70 |
| 2530 E 7th St | 0.60mi | 3/2.0 | 1,296 (-2%) | 6mo | $290,000 | $224 | 64 |
| 7815 Bass St | 0.17mi | 3/2.0 | 1,188 (-10%) | 19mo | $290,000 | $244 | 60 |
| 7565 Springfield Rd | 0.27mi | 3/2.0 | 1,512 (+15%) | 4mo | $363,000 | $240 | 59 |
Match score weights: distance 35% · size 25% · config 20% · recency 20%. Top-matched comps best support the ARV.
Projected returns pro-forma
6.36% appreciation · 3.0% rent growth · sell at horizon
- IRR
- 10.7%
- Equity multiple
- 1.74×
- Total profit
- $61,553
- Equity at exit
- $194,174
- IRR
- 11.7%
- Equity multiple
- 3.44×
- Total profit
- $203,780
- Equity at exit
- $358,184
Cash invested: $83,440 (down + closing). Projections, not guarantees.
Landlord ↔ Tenant lean methodology
- Overall (STATE)
- 71 Landlord-Friendly
- State Nevada
- 71 Landlord-Friendly · R+1
- County
- — inherits STATE
- City
- — inherits STATE
ZIP-level market 89429
- Home prices YoY
- 2.4%
- Active inventory
- 249
- Price-to-rent
- 12.5×
Monthly cashflow live
- Estimated rent
- $1,992 medium interval (Pro) →
- Mortgage (P&I)
- −$1,563
- Tax est. 1.5%
- −$372 /mo · $4,470/yr
- Insurance
- −$124
- HOA
- −$0
- Vacancy / Maint / Mgmt
- −$418
- Net cashflow
- $-486
Break-even live
Sensitivity live
| Price | -10% $-280 | -5% $-383 | +0% $-486 | +5% $-589 | +10% $-692 |
|---|---|---|---|---|---|
| Rent | -10% $-643 | -5% $-565 | +0% $-486 | +5% $-407 | +10% $-329 |
| Rate | -1.0pp $-336 | -0.5pp $-410 | base $-486 | +0.5pp $-563 | +1.0pp $-642 |
UW: 25.0% down · 7.5% · 30yr · 1.5% tax · 5.0% vac · 8.0% maint · 8.0% mgmt
Financing live
Cash to close
- Down payment
- $74,500
- Closing costs
- $8,940
- Reserves months
- —
- Total cash needed
- —
Loan-product check · same deal, 3 products live
Conventional
25% down · 7.5% · 30yr
- Down + closing
- —
- Monthly P&I
- —
- Monthly cashflow
- —
- DSCR
- —
- Eligible?
- —
Personal DTI + credit; lowest rate.
DSCR
20% down · 8.5% · 30yr
- Down + closing
- —
- Monthly P&I
- —
- Monthly cashflow
- —
- DSCR
- —
- Eligible?
- —
No personal income docs; deal must DSCR.
Hard money
10% down · 12.0% · 12mo
- Down + closing
- —
- Monthly P&I
- —
- Monthly cashflow
- —
- DSCR
- —
- Eligible?
- —
Short-term bridge; refi at stabilization.
Listing history 22 events
-
2026-06-18days on market $298,000 Active 133 DOM
-
2026-06-17days on market $298,000 Active 132 DOM
-
2026-06-16days on market $298,000 Active 131 DOM
-
2026-06-15days on market $298,000 Active 130 DOM
-
2026-06-14days on market $298,000 Active 128 DOM
-
2026-06-13days on market $298,000 Active 127 DOM
-
2026-06-10days on market $298,000 Active 125 DOM
-
2026-06-09days on market $298,000 Active 124 DOM
-
2026-06-08days on market $298,000 Active 123 DOM
-
2026-06-07days on market $298,000 Active 122 DOM
-
2026-06-03pricedays on market $298,000 Active 118 DOM
-
2026-06-02days on market $320,000 Active 117 DOM
-
2026-06-01days on market $320,000 Active 116 DOM
-
2026-05-31status $320,000 Active 115 DOM
-
2026-03-30price $320,000 560-char remark
Show marketing remark (560 chars)
Looking for room to breathe? Welcome to this well-maintained 1-acre horse property located in Silver Springs. This 3-bedroom, 2-bath home offers over 1,300 sq. ft. of living space and features a carport, additional storage, and RV access with full hookups. The property is fully fenced and ideal for animals, recreation, or extra parking. Conveniently located just down the road from Lahontan Lake State Park, with quick access to USA Parkway and an easy commute to Reno or Carson City. Enjoy peaceful rural living with nearby amenities and outdoor recreation.
-
2026-01-27$325,000 Active 560-char remark
Show marketing remark (560 chars)
Looking for room to breathe? Welcome to this well-maintained 1-acre horse property located in Silver Springs. This 3-bedroom, 2-bath home offers over 1,300 sq. ft. of living space and features a carport, additional storage, and RV access with full hookups. The property is fully fenced and ideal for animals, recreation, or extra parking. Conveniently located just down the road from Lahontan Lake State Park, with quick access to USA Parkway and an easy commute to Reno or Carson City. Enjoy peaceful rural living with nearby amenities and outdoor recreation.
-
2014-10-31soldstatus $35,000 405-char remark
Show marketing remark (405 chars)
bank approved, want and offer now, .. .. will keep reducing until an acceptable offer comes in . (PER LENDERS REQUEST). . ALL OFFERS ARE SUBJECT TO FINAL INVESTOR APPROVAL * * * * * NO OFFERS OR COUNTER OFFER SHOULD BE CONSIDERED APPROVED UNITL FINAL INVESTOR IS RECEIVED. ., AS IS go direct, gate has a chain on it with a bolt lightly on there, just unscrew bolt and put back please, thanks.
-
2014-09-10historical 405-char remark
Show marketing remark (405 chars)
bank approved, want and offer now, .. .. will keep reducing until an acceptable offer comes in . (PER LENDERS REQUEST). . ALL OFFERS ARE SUBJECT TO FINAL INVESTOR APPROVAL * * * * * NO OFFERS OR COUNTER OFFER SHOULD BE CONSIDERED APPROVED UNITL FINAL INVESTOR IS RECEIVED. ., AS IS go direct, gate has a chain on it with a bolt lightly on there, just unscrew bolt and put back please, thanks.
-
2014-06-09$35,900 405-char remark
Show marketing remark (405 chars)
bank approved, want and offer now, .. .. will keep reducing until an acceptable offer comes in . (PER LENDERS REQUEST). . ALL OFFERS ARE SUBJECT TO FINAL INVESTOR APPROVAL * * * * * NO OFFERS OR COUNTER OFFER SHOULD BE CONSIDERED APPROVED UNITL FINAL INVESTOR IS RECEIVED. ., AS IS go direct, gate has a chain on it with a bolt lightly on there, just unscrew bolt and put back please, thanks.
-
2005-06-17soldstatus $73,000
-
2005-04-19historical
-
2004-12-15$82,900
ⓘ Source: listings_history table (triggers on properties + properties_extension) + one-shot
backfill from property_details.listing_events for pre-trigger history.
Climate risk First Street
- Flood 4/10 Moderate FEMA zone X (unshaded) · 22% chance over 30 yrs
- Wildfire 4/10 Moderate
- Heat 6/10 Major 7 d/yr ≥96°F today · 19 d/yr by 30 yrs out
- Wind 1/10 Low
- Air quality 8/10 Severe 16 unhealthy d/yr today · 17 by 30 yrs out
Nearby sold comps map
Loading sold comps map…
Walkable amenities ~0.75 mi
Loading nearby amenities…
Taxation est. · year 1
- Rental income
- $23,902
- − Mortgage interest
- −$16,693
- − Property taxes
- −$4,470
- − Insurance
- −$1,490
- − Repairs & maintenance
- −$1,912
- − Management
- −$1,912
- − Depreciation
- −$8,669
- Taxable loss
- −$11,244
- Est. tax savings @ 24.0%
- +$2,699
- After-tax cash flow
- $-3,132/yr
For passive investors: Depreciation is non-cash, so a rental often shows a tax loss while cash-flowing — sheltering income. Rental losses are passive: they offset passive income freely, and up to $25,000/yr can offset ordinary (W-2) income if you actively participate and your MAGI is under $100k (phasing out to $0 by $150k); unused losses carry forward. On sale, claimed depreciation is recaptured at up to 25%, and gains may owe capital-gains tax (a 1031 exchange can defer both). Figures are a year-1 estimate at your 24.0% rate — not tax advice; consult a CPA.
Schools (NCES district)
- District
- Lyon County School District
- NCES district ID
- 3200300
- Math proficiency
- 21% ▼ -11.00%
- Reading proficiency
- 35% ▼ -7.00%
- Median HH income
- $48,197
- Composite
- 24.32/100
- National rank
- #7707
- State rank
- #14 of 17 in NV
Livability — Silver Springs
- Score
- 65/100
- State rank
- #42
- US rank
- #13362
Category grades
Schools grade is shown separately in the Schools card above.
Census & demographics
- Census place
- Silver Springs, NV
- City population
- 7,949
- Population (ZIP)
- 7,949
Population outlook (Lyon County) Hauer SSP2
- Today (2025)
- 51,655 people
- By 2030
- 50,194 · -2.8%
- By 2040
- 46,155 · -10.6%
- By 2050
- 41,580 · -19.5%
- By 2075
- 32,687 · -36.7%
- By 2100
- 24,111 · -53.3%
Race, ethnicity, and origin ACS 2023
- Neighborhood character
- Predominantly White (83%)
- Race & ethnicity
- White 83% Two or more races 8% Hispanic / Latino 8% Native American 2%
- Hispanic origin (detail)
- Mexican 7%
- Common ancestry
- Slovak 3% Lithuanian 2% Italian 2%
- Foreign-born
- 5% · Canada, China
- Languages at home
- 92% English-only · Spanish 5% Arabic 1% Chinese 1%
Political lean MEDSL · Lyon
- 2024 margin
- Solid R (+44.4) · D 26.7% · R 71.1% · Other 2.2%
- 2008→2024 swing
- -26.5pp toward R · 2008: -17.9pp · 2024: -44.4pp
- All cycles
- 2024: R+44.4 2020: R+41.1 2016: R+41.5 2012: R+28.6 2008: R+17.9
Not yet ingested
- Civics
- —
Market trends
- HPI YoY
- ▲ 6.36%
- Current HPI
- 271.5945
- Rent YoY
- —
- Metro
- —
- State GDP YoY
- ▲ 3.08%
- F500 in state
- 6
Industry mix (Fortune 500 HQ in NV)
| Industry | F500 HQs | Revenue |
|---|---|---|
| Hotels / Casinos | 3 | $36B |
|
||
Price history
+286.0% since first listed8 events — show timeline
- 2026-03-30 Price Changed $320,000 NNRMLS
- 2026-01-27 Listed $325,000 NNRMLS
- 2014-10-31 Sold (MLS) $35,000 NNRMLS
- 2014-09-10 Listing Removed — NNRMLS
- 2014-06-09 Listed $35,900 NNRMLS
- 2005-06-17 Sold (Public Records) $73,000 Public Records
- 2005-04-19 Listing Removed — NNRMLS
- 2004-12-15 Listed $82,900 NNRMLS
Property tax history
+4.0%/yrLatest (2025): $473 · +3.0% YoY. Source: county tax records.
Cash-flow waterfall
monthlySold comps — $/sqft
last 12 mo · ≤1 miLoading sold comps…