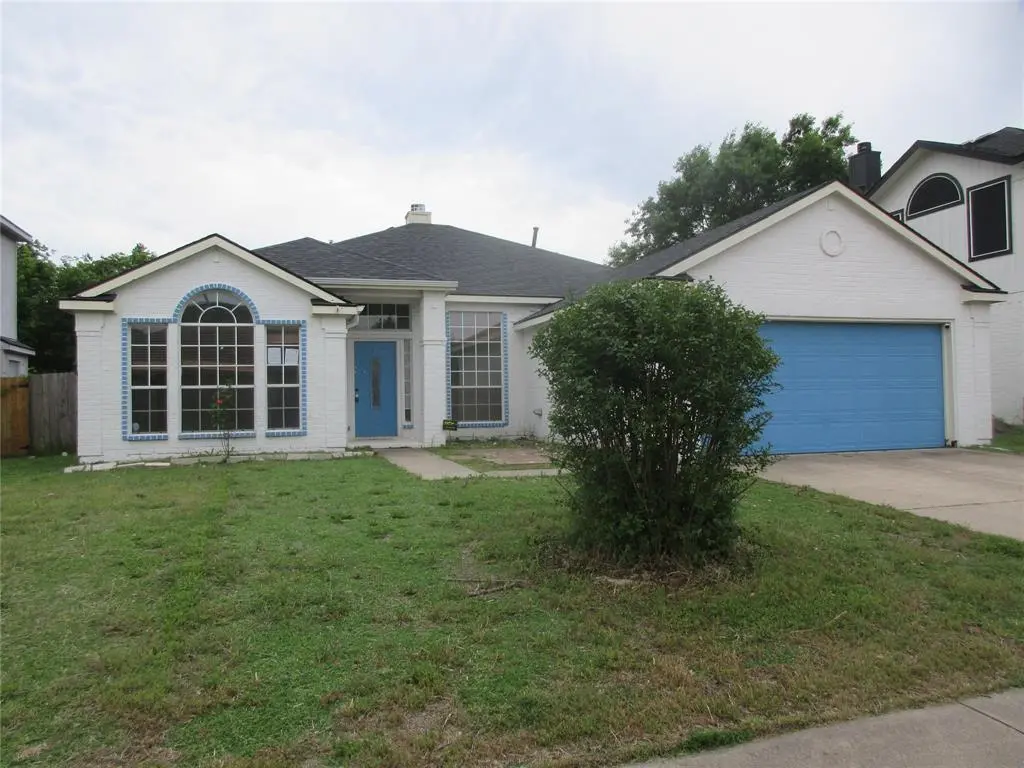
214 Westbrook Dr · Arlington, TX
Flood risk 1/10 · Minimal
- FEMA flood zone
- X (unshaded)
- Chance of flooding over 30 yrs
- 0.0%
- Est. flood insurance / yr
- $507 – $1,088
Fire risk 3/10 · Minor
- Est. fire insurance / yr
- $1,222 – $2,270
Heat risk 7/10 · Major
- Hot days now (above 110°F)
- 7 days/yr
- Hot days in 30 yrs
- 23 days/yr
Wind risk 6/10 · Moderate
- Chance of severe wind over 30 yrs
- 27.0%
Air-quality risk 3/10 · Minor
- Unhealthy air days now
- 2 days/yr
- Unhealthy air days in 30 yrs
- 3 days/yr
Risk factors via First Street. Map © Google.
Why this score? — see what drove the D+ grade
The composite is a weighted blend of 9 inputs, each scored 0–100. Each bar is that input's sub-score; the figure is the points it added to the 100-point composite (weight × sub-score).
- ARV discount +15.0/15.0
- Cash flow +11.2/30.0
- 1% rule +5.0/10.0
- Schools +4.6/10.0
- Livability +3.9/5.0
- DSCR +3.3/10.0
- Rent growth +3.3/5.0
- Condition / age +2.5/5.0
- Appreciation +0.0/10.0
$272,000
🖨 Deal sheet 📄 Offer letter ✓ Due diligence
Listing remarks
Spacious and versatile, this beautiful 4-bedroom, 2-bath home in Arlington TX offers the perfect blend of comfort and functionality—located in a highly sought-after area known for its great schools. Designed with flexibility in mind, the fourth bedroom can easily serve as a private study or home office. Inside, you’ll find two generous living areas and two dining spaces, ideal for both everyday living and entertaining guests. The layout provides plenty of room to spread out while still maintaining a warm, connected feel throughout the home. Step outside to your own backyard retreat featuring an in-ground pool and a covered patio—perfect for relaxing evenings, weekend gathe
Key facts
- Two dining spaces
- Two living areas
- Private study
Tags
Property features AI
Finance
- Other: Property type: Single-family residence; Subdivision: Matlock Estates Add; County: Tarrant; Possession at closing/funding
- Financial info: Listing accepts Cash, Conventional, FHA, and VA financing; Special listing conditions: HUD owned
- HOA & community: No homeowners association; Community features include curbs and sidewalks
Exterior
- Parking: Attached 2-car garage with two 20' x 20' dimensions; Covered parking; Driveway; Garage door opener; Garage faces front; 2-car single door configuration
- Security: Security features: Unknown
- Utilities: City water; City sewer; Sewer available; Cable available; Curbs and sidewalks
- Home design: Single-family residence; Residential property; One level; Built in 1998
- Construction: Brick and siding exterior; Composition roof; Slab foundation
- Exterior features: Wood fencing; Covered rear porch; Interior lot; Partially wooded yard; In-ground gunite pool with pool cover
Interior
- Kitchen: Dishwasher; Disposal; Electric range; Microwave; Breakfast room adjacent to kitchen; Pantry
- Bedrooms: 4 bedrooms (all on the main level); Primary bedroom on main level
- Flooring: Carpet; Ceramic tile; Laminate
- Bathrooms: 2 full bathrooms
- Heating & cooling: Central heating (natural gas); Central air (electric); Ceiling fans
- Interior features: Cable TV available; Pantry; Window coverings; Two living areas; Two dining areas; Nine total rooms; One-story layout
- Laundry & utility: Full-size washer/dryer area
Neighborhood map
What this means for you Summary
Snapshot
- This is a 3-bed/2.0-bath single-family listed at $272k.
Deal economics
- At list price, monthly cash flow is $-104 ($-1k/yr) — negative.
- To cash-flow at today's rent, offer at most $254k (6.7% below list).
- To meet the 1% rule (rent ≥ 1% of price), the offer needs to be $271k (0.2% below list).
- Recommended offer: $254k (6.7% below list) — sets the bar for cash-flow.
- Cap rate 5.8% vs local median 3.7% in Arlington — top-decile yield for the area; either an underpriced asset or a hidden risk that comps aren't pricing in. Stress-test before assuming the spread holds.
Location & tenants
- Location reads 78/100 on livability (#75 in TX, #2,697 nationally) — a middle-class / working-renter tenant base. Strengths: amenities A+, cost of living A+, housing A+; Watch: crime F, commute F.
- Mansfield ISD (suburban): math 47% / reading 53% proficiency, ranked #125 of 826 in TX (top 15%) — acceptable for families but not a draw, mixed tenant base, ~2y average lease.
- Zoned schools: Imogene Gideon El (math 32% / reading 37%, grade F, #1,995 of 4,322 statewide, top 50%, 329 students, 73% FRL) — zoned schools average 73% FRL vs 35% district-wide (37 pts higher); higher-poverty schools than district average — tighter screening recommended.
- Zoned-school proficiency averages 34% at this address vs 50% district-wide (-16 pts) — the specific schools serving this property underperform the Mansfield ISD average; the district grade overstates school quality for this exact location.
- Market conditions: Rents rising (+3.1%/yr); 98 active listings in the ZIP; 40 comparable units currently listed for rent nearby; rentals at typical pace (median 24d on market — plan ~3-4 weeks tenant-placement turnaround); 42% of comp listings sitting > 30 days — soft ceiling on asking rent; solid renter incomes; 18,938 units permitted in Tarrant County in 2024 (8,336 in 5+ unit buildings).
- This rent runs 32% of the median local income ($101k/yr) — at the standard rent-burdened threshold; future hikes will face affordability resistance.
Forward outlook
- Local home prices are declining (-3.0%/yr); year-one equity from $2k of loan paydown is wiped out by about $8k of value loss. Plan a longer hold.
- Tarrant County population projected at +41% by 2050 — long-run rental-demand tailwind backs the buy-and-hold thesis.
Negotiation context
- It's been on market 48 days — a 3% lower offer ($264k) is reasonable based on typical stale-listing flexibility.
- 5 sale attempts since 22y ago; this cycle's ask has dropped $68k (20%) from the opening price — seller is motivated, your offer sets the floor, not the list.
Risks & watch-outs
- Watch-outs: property tax is 3.1% of price.
- Climate carrying-cost: major wind risk, 27% chance of damaging wind over 30y; extreme-heat days projected 7→23/yr by 2055 (HVAC capex compounding) — expect insurance premiums to compound above CPI over the hold.
Questions for the listing agent
- What do current leases actually rent for vs. the listed asking? Can we see a recent rent roll and the last 12 months of T-12 income?
- It's been on market 48 days. Have you received any prior offers? Is the seller open to a 7% concession, seller financing, or rate buy-down credit?
- Property tax is high relative to price — has the assessment been appealed recently, and will the sale trigger a re-assessment?
- Is there a deadline driving the sale (1031 exchange, divorce, estate, relocation)? That informs how much negotiation room exists.
- Schools are D-rated, which usually means shorter tenancies and higher turnover. Who's the typical renter profile here, and what's been the actual vacancy rate?
- Crime grade is F in this area — have there been break-ins, vandalism, or insurance claims at this property in the last 3 years? What carrier currently insures it and at what premium?
- The area grade is low — what's the realistic commute time and amenity access for the typical tenant pool here? Any planned neighborhood developments (good or bad) we should know about?
- What's the average days-on-market for RENTAL listings here right now (not sales)? A rising rental-DOM trend means longer vacancies and softer asking-rent achievability than the comps imply.
- What's the recent tenant-quality profile in this submarket — average credit score on applications, eviction rate, late-payment / NSF rate, and stable-employment percentage? A property-management company in the area should have these aggregated.
- How much new for-sale + rental construction is in the pipeline within 1–3 miles? Heavy new supply typically softens prices + rents 12–24 months out; constrained supply supports both.
Investment metrics
- 1% rule
- 1.00% ✗
- Cap rate
- 5.84%
- Cash-on-cash
- -1.63%
- DSCR
- 0.93
- GRM
- 8.4
CMA / ARV
- ARV (median comp)
- $349,509
- List price
- $272,000
- Delta
- -22.18%
- Verdict
- UNDERPRICED
- Comps
- 20 within 1.0 mi
Show comp detail 12 sales within ~0.75 mi
| Address | Dist | Beds/Ba | Sqft | Sold | Price | $/sf | Match |
|---|---|---|---|---|---|---|---|
| 202 Creek Point Ln | 0.25mi | 4/2.0 (+1) | 2,096 (+1%) | 0mo | $344,000 | $164 | 82 |
| 7926 Rattlers Ct | 0.29mi | 3/2.0 | 1,964 (-6%) | 1mo | $355,000 | $181 | 77 |
| 218 Quail Meadows Ln | 0.20mi | 3/2.0 | 2,226 (+7%) | 3mo | $335,000 | $150 | 77 |
| 7815 Regent Dr | 0.50mi | 3/2.5 | 2,209 (+6%) | 3mo | $299,000 | $135 | 62 |
| 7315 Fossil Creek Dr | 0.39mi | 3/2.0 | 1,818 (-13%) | 0mo | $330,000 | $182 | 61 |
| 7505 Cresswell Dr | 0.67mi | 3/2.5 | 2,182 (+5%) | 2mo | $335,000 | $154 | 56 |
| 803 W Lonesome Dove Trl | 0.50mi | 3/2.0 | 1,843 (-11%) | 4mo | $345,000 | $187 | 54 |
| 510 Poplar Vista Ln | 0.60mi | 4/2.0 (+1) | 2,214 (+6%) | 2mo | $350,000 | $158 | 54 |
| 602 Mesa Ridge Ct | 0.58mi | 3/2.0 | 1,863 (-10%) | 4mo | $329,900 | $177 | 52 |
| 506 Quartz St | 0.57mi | 3/2.0 | 1,798 (-14%) | 2mo | $310,000 | $172 | 50 |
| 730 W Lonesome Dove Trl | 0.44mi | 4/2.0 (+1) | 1,785 (-14%) | 4mo | $384,000 | $215 | 48 |
| 809 Elbe Dr | 0.68mi | 4/2.0 (+1) | 1,812 (-13%) | 3mo | $280,000 | $155 | 40 |
Match score weights: distance 35% · size 25% · config 20% · recency 20%. Top-matched comps best support the ARV.
Projected returns pro-forma
-3.0% appreciation · 3.1% rent growth · sell at horizon
- IRR
- -18.7%
- Equity multiple
- 0.34×
- Total profit
- $-50,134
- Equity at exit
- $40,556
- IRR
- -10.7%
- Equity multiple
- 0.34×
- Total profit
- $-49,944
- Equity at exit
- $23,518
Cash invested: $76,160 (down + closing). Projections, not guarantees.
Landlord ↔ Tenant lean methodology
- Overall (STATE)
- 87 Strongly Landlord-Friendly
- State Texas
- 87 Strongly Landlord-Friendly · R+5
- County
- — inherits STATE
- City
- — inherits STATE
ZIP-level market 76002
- Home prices YoY
- -4.6%
- Rents YoY
- 3.1%
- Active inventory
- 98
- Price-to-rent
- 8.4×
Monthly cashflow live
- Estimated rent
- $2,713 high interval (Pro) →
- Mortgage (P&I)
- −$1,426
- Tax from tax record
- −$707 /mo · $8,489/yr
- Insurance
- −$113
- HOA
- −$0
- Vacancy / Maint / Mgmt
- −$570
- Net cashflow
- $-104
Break-even live
UW: 25.0% down · 7.5% · 30yr · 1.5% tax · 5.0% vac · 8.0% maint · 8.0% mgmt
Financing live
Cash to close
- Down payment
- $68,000
- Closing costs
- $8,160
- Reserves months
- —
- Total cash needed
- —
Loan-product check · same deal, 3 products live
Conventional
25% down · 7.5% · 30yr
- Down + closing
- —
- Monthly P&I
- —
- Monthly cashflow
- —
- DSCR
- —
- Eligible?
- —
Personal DTI + credit; lowest rate.
DSCR
20% down · 8.5% · 30yr
- Down + closing
- —
- Monthly P&I
- —
- Monthly cashflow
- —
- DSCR
- —
- Eligible?
- —
No personal income docs; deal must DSCR.
Hard money
10% down · 12.0% · 12mo
- Down + closing
- —
- Monthly P&I
- —
- Monthly cashflow
- —
- DSCR
- —
- Eligible?
- —
Short-term bridge; refi at stabilization.
Rent comps 40 comps
| Address | Beds | Baths | Sqft | Rent | $/sqft | DOM | Units | Dist |
|---|---|---|---|---|---|---|---|---|
| 7711 Rochester Ln Arlington, TX | 4.0 | 2.0 | 2058 | $2,650 | $1.29 | 12d | 1 | 0.14mi |
| 7903 Clear Fork Trl Arlington, TX | 4.0 | 2.5 | 2474 | $3,000 | $1.21 | 5d | 1 | 0.22mi |
| 303 Quail Meadows Ln Arlington, TX | 3.0 | 2.5 | 2917 | $2,495 | $0.86 | 43d | 1 | 0.29mi |
| 8001 Mourning Dove Dr Arlington, TX | 4.0 | 2.0 | 1785 | $2,399 | $1.34 | 17d | 1 | 0.29mi |
| 8001 Mourning Dove Dr Arlington, TX | 4.0 | 2.0 | 1785 | $2,349 | $1.32 | 2d | 1 | 0.29mi |
| 8004 Mourning Dove Dr Arlington, TX | 4.0 | 2.0 | 2020 | $1,100 | $0.54 | 18d | 1 | 0.33mi |
| 307 Pointer Pl Arlington, TX | 4.0 | 2.5 | 2900 | $2,995 | $1.03 | 43d | 1 | 0.34mi |
| 8024 Mourning Dove Dr Arlington, TX | 4.0 | 3.0 | 2469 | $2,680 | $1.09 | 24d | 1 | 0.35mi |
| 8024 Mourning Dove Dr Arlington, TX | 4.0 | 3.0 | 2469 | $2,801 | $1.13 | 43d | 1 | 0.35mi |
| 343 Mesquite Hill Dr Arlington, TX | 3.0 | 2.5 | 2539 | $3,095 | $1.22 | 17d | 1 | 0.41mi |
| 8012 Blue Duck Trl Arlington, TX | 4.0 | 2.0 | 1990 | $2,500 | $1.26 | 43d | 1 | 0.43mi |
| 409 Creek Point Ln Arlington, TX | 4.0 | 2.0 | 2256 | $5,750 | $2.55 | 7d | 1 | 0.43mi |
| 8101 Sawyer Dr Arlington, TX | 3.0 | 2.5 | 1822 | $2,645 | $1.45 | 43d | 1 | 0.44mi |
| 8013 Sawyer Dr Unit ID5003 Arlington, TX | 3.0 | 2.5 | 1821 | $2,100 | $1.15 | 43d | 1 | 0.44mi |
| 8015 Splitrail Ct Arlington, TX | 3.0 | 2.0 | 1778 | $2,510 | $1.41 | 24d | 1 | 0.46mi |
| 7406 Lake Front Trl Arlington, TX | 3.0 | 2.0 | 1818 | $2,440 | $1.34 | 5d | 1 | 0.47mi |
| 7232 Jurassic Dr Arlington, TX | 4.0 | 2.5 | 2423 | $2,623 | $1.08 | 43d | 1 | 0.51mi |
| 405 Matlock Meadow Dr Arlington, TX | 4.0 | 2.0 | 2004 | $2,595 | $1.29 | 43d | 1 | 0.60mi |
| 316 Matlock Meadow Dr Arlington, TX | 3.0 | 2.0 | 1402 | $2,150 | $1.53 | 3d | 1 | 0.60mi |
| 625 Spanish Oak Ct Arlington, TX | 3.0 | 2.0 | 1565 | $2,125 | $1.36 | 43d | 1 | 0.63mi |
| 206 Shady Brook Dr Arlington, TX | 3.0 | 2.0 | 1743 | $2,190 | $1.26 | 20d | 1 | 0.64mi |
| 7301 Fossil Lake Dr Arlington, TX | 3.0 | 2.0 | 1990 | $2,400 | $1.21 | 17d | 1 | 0.64mi |
| 7218 Fossil Rim Trl Arlington, TX | 4.0 | 2.5 | 2365 | $2,850 | $1.21 | 24d | 1 | 0.65mi |
| 809 Elbe Dr Arlington, TX | 4.0 | 2.0 | 1812 | $2,850 | $1.57 | 43d | 1 | 0.68mi |
| 7409 Cresswell Dr Arlington, TX | 3.0 | 2.0 | 1430 | $2,200 | $1.54 | 43d | 1 | 0.72mi |
| 6930 Misty Meadow Ln Arlington, TX | 3.0 | 2.0 | 1678 | $2,450 | $1.46 | 43d | 1 | 0.74mi |
| 7023 Spoonbill Ct Arlington, TX | 3.0 | 2.0 | 2014 | $2,505 | $1.24 | 20d | 1 | 0.76mi |
| 7005 Edmundson Dr Arlington, TX | 3.0 | 2.0 | 1475 | $2,145 | $1.45 | 11d | 1 | 0.77mi |
| 6920 Misty Meadow Ln Arlington, TX | 3.0 | 2.0 | 1582 | $2,150 | $1.36 | 18d | 1 | 0.78mi |
| 606 Primavera Dr Arlington, TX | 4.0 | 2.0 | 2419 | $3,100 | $1.28 | 12d | 1 | 0.87mi |
| 7006 Pickford Ct Arlington, TX | 3.0 | 2.0 | 1765 | $2,250 | $1.27 | 12d | 1 | 0.88mi |
| 629 Rosarita Rd Arlington, TX | 4.0 | 2.0 | 1932 | $2,650 | $1.37 | 17d | 1 | 0.89mi |
| 8107 Young Ct Arlington, TX | 3.0 | 2.5 | 2661 | $2,500 | $0.94 | 43d | 1 | 0.89mi |
| 8103 Zephyr Ct Arlington, TX | 3.0 | 2.0 | 1539 | $2,395 | $1.56 | 43d | 1 | 0.91mi |
| 618 Rosarita Rd Arlington, TX | 3.0 | 2.0 | 1997 | $2,395 | $1.20 | 24d | 1 | 0.91mi |
| 8115 Wesson Rd Arlington, TX | 3.0 | 2.0 | 2384 | $2,261 | $0.95 | 43d | 1 | 0.94mi |
| 623 Soledad St Arlington, TX | 3.0 | 2.0 | 1680 | $2,370 | $1.41 | 43d | 1 | 0.94mi |
| 7016 Snowivy Ct Arlington, TX | 3.0 | 2.0 | 1575 | $2,200 | $1.40 | 43d | 1 | 0.95mi |
| 7016 Snowivy Ct Arlington, TX | 3.0 | 2.0 | 1575 | $2,200 | $1.40 | 12d | 1 | 0.95mi |
| 920 Dove Meadows Dr Arlington, TX | 3.0 | 2.0 | 1638 | $2,151 | $1.31 | 24d | 1 | 1.04mi |
Listing history 29 events
-
2026-06-18days on market $272,000 Active 48 DOM
-
2026-06-17price $272,000 Active 47 DOM
-
2026-06-17days on market $340,000 Active 47 DOM
-
2026-06-16days on market $340,000 Active 46 DOM
-
2026-06-15days on market $340,000 Active 45 DOM
-
2026-06-13days on market $340,000 Active 43 DOM
-
2026-06-13days on market $340,000 Active 42 DOM
-
2026-06-09days on market $340,000 Active 39 DOM
-
2026-06-08days on market $340,000 Active 38 DOM
-
2026-06-07days on market $340,000 Active 37 DOM
-
2026-06-04days on market $340,000 Active 34 DOM
-
2026-06-03days on market $340,000 Active 33 DOM
-
2026-06-02days on market $340,000 Active 32 DOM
-
2026-06-01days on market $340,000 Active 31 DOM
-
2026-05-31days on market $340,000 Active 30 DOM
-
2026-05-01$340,000 Active 889-char remark
-
2025-02-05$370,000 Active
-
2025-02-03historical
-
2025-01-19$370,000 Active
-
2022-05-24soldstatus
-
2022-05-23soldstatus Closed
-
2022-05-12price $2,550
-
2022-05-03status Pending
-
2022-04-25historical Active Option Contract
-
2022-03-29$375,000 Active
-
2004-10-19soldstatus
-
2004-09-27historical
-
2004-06-26$144,900
-
1996-01-01soldstatus
ⓘ Source: listings_history table (triggers on properties + properties_extension) + one-shot
backfill from property_details.listing_events for pre-trigger history.
Tax reassessment forecast TX · Resets to sale price
- Current annual tax
- $8,489 · $707/mo
- Projected year-2 tax
- $8,489 · $707/mo
- Expected delta
- $0/yr ($0/mo · 0.0%)
ⓘ Screening estimate from a state-policy table — verify with the county assessor before closing.
Climate risk First Street
- Flood 1/10 Low FEMA zone X (unshaded) · 0% chance over 30 yrs
- Wildfire 3/10 Moderate
- Heat 7/10 Severe 7 d/yr ≥110°F today · 23 d/yr by 30 yrs out
- Wind 6/10 Major 27% chance of damaging wind over 30 yrs
- Air quality 3/10 Moderate 2 unhealthy d/yr today · 3 by 30 yrs out
Nearby sold comps map
Loading sold comps map…
Walkable amenities ~0.75 mi
Loading nearby amenities…
Taxation est. · year 1
- Rental income
- $32,561
- − Mortgage interest
- −$15,236
- − Property taxes
- −$8,489
- − Insurance
- −$1,360
- − Repairs & maintenance
- −$2,605
- − Management
- −$2,605
- − Depreciation
- −$7,913
- Taxable loss
- −$5,647
- Est. tax savings @ 24.0%
- +$1,355
- After-tax cash flow
- $112/yr
For passive investors: Depreciation is non-cash, so a rental often shows a tax loss while cash-flowing — sheltering income. Rental losses are passive: they offset passive income freely, and up to $25,000/yr can offset ordinary (W-2) income if you actively participate and your MAGI is under $100k (phasing out to $0 by $150k); unused losses carry forward. On sale, claimed depreciation is recaptured at up to 25%, and gains may owe capital-gains tax (a 1031 exchange can defer both). Figures are a year-1 estimate at your 24.0% rate — not tax advice; consult a CPA.
Schools (NCES district)
- District
- Mansfield ISD
- NCES district ID
- 4828920
- Math proficiency
- 47% ▼ -17.00%
- Reading proficiency
- 53% ▼ -6.00%
- Median HH income
- $81,934
- Composite
- 45.82/100
- National rank
- #2558
- State rank
- #125 of 826 in TX
Livability — Arlington
- Score
- 78/100
- State rank
- #75
- US rank
- #2697
Category grades
Schools grade is shown separately in the Schools card above.
Census & demographics
- Census place
- Arlington, TX
- County
- Tarrant County · 2,033,669 people
- City population
- 366,588
- Metro
- Dallas-Fort Worth-Arlington, TX
- Population (ZIP)
- 35,265
- Household income
- $100,667
- Rent vs Own
- Severe rent burden
- 566.0
Population outlook (Tarrant County) Hauer SSP2
- Today (2025)
- 2,380,417 people
- By 2030
- 2,578,900 · +8.3%
- By 2040
- 2,974,995 · +25.0%
- By 2050
- 3,350,489 · +40.8%
- By 2075
- 4,216,909 · +77.2%
- By 2100
- 4,741,527 · +99.2%
Race, ethnicity, and origin ACS 2023
- Neighborhood character
- Highly diverse neighborhood (Simpson 0.74)
- Race & ethnicity
- Black 35% White 26% Hispanic / Latino 24% Asian 11% Two or more races 11%
- Hispanic origin (detail)
- Mexican 16% Puerto Rican 3%
- Common ancestry
- Swedish 1% Slovak 1% Arab 1%
- Foreign-born
- 25% · Canada, Vietnam, China
- Languages at home
- 62% English-only · Spanish 15% Vietnamese 7% Arabic 5%
Political lean MEDSL · Tarrant
- 2024 margin
- Lean R (+5.1) · D 46.7% · R 51.9% · Other 1.4%
- 2008→2024 swing
- +6.6pp toward D · 2008: -11.7pp · 2024: -5.1pp
- All cycles
- 2024: R+5.1 2020: D+0.2 2016: R+8.7 2012: R+15.7 2008: R+11.7
Not yet ingested
- Civics
- —
Market trends
- HPI YoY
- ▼ -12.36%
- Current HPI
- 256.7208
- Rent YoY
- ▲ 3.10%
- Metro
- Dallas-Fort Worth-Arlington, TX
- State GDP YoY
- ▲ 3.95%
- F500 in state
- 110
Industry mix (Fortune 500 HQ in TX)
| Industry | F500 HQs | Revenue |
|---|---|---|
| Energy | 16 | $1,198B |
|
||
| Technology | 5 | $198B |
|
||
| Engineering / Construction | 4 | $72B |
|
||
| Energy Services | 3 | $60B |
|
||
| Utilities | 3 | $41B |
|
||
| Healthcare | 2 | $330B |
|
||
Price history
+87.7% since first listed15 events — show timeline
- 2026-06-17 Price Changed $272,000 NTREIS
- 2026-05-01 Listed $340,000 NTREIS
- 2025-02-05 Listed $370,000 NTREIS
- 2025-02-03 Listing Removed — NTREIS
- 2025-01-19 Listed $370,000 NTREIS
- 2022-05-24 Sold (Public Records) — Public Records
- 2022-05-23 Sold (MLS) — NTREIS
- 2022-05-12 Price Changed $2,550 RENT.
- 2022-05-03 Pending — NTREIS
- 2022-04-25 Contingent — NTREIS
- 2022-03-29 Listed $375,000 NTREIS
- 2004-10-19 Sold (Public Records) — Public Records
- 2004-09-27 Listing Removed — NTREIS
- 2004-06-26 Listed $144,900 NTREIS
- 1996-01-01 Sold (Public Records) — Public Records
Property tax history
+5.6%/yrLatest (2025): $8,489 · +3.6% YoY. Source: county tax records.
Cash-flow waterfall
monthlySold comps — $/sqft
last 12 mo · ≤1 miLoading sold comps…