 Duplex
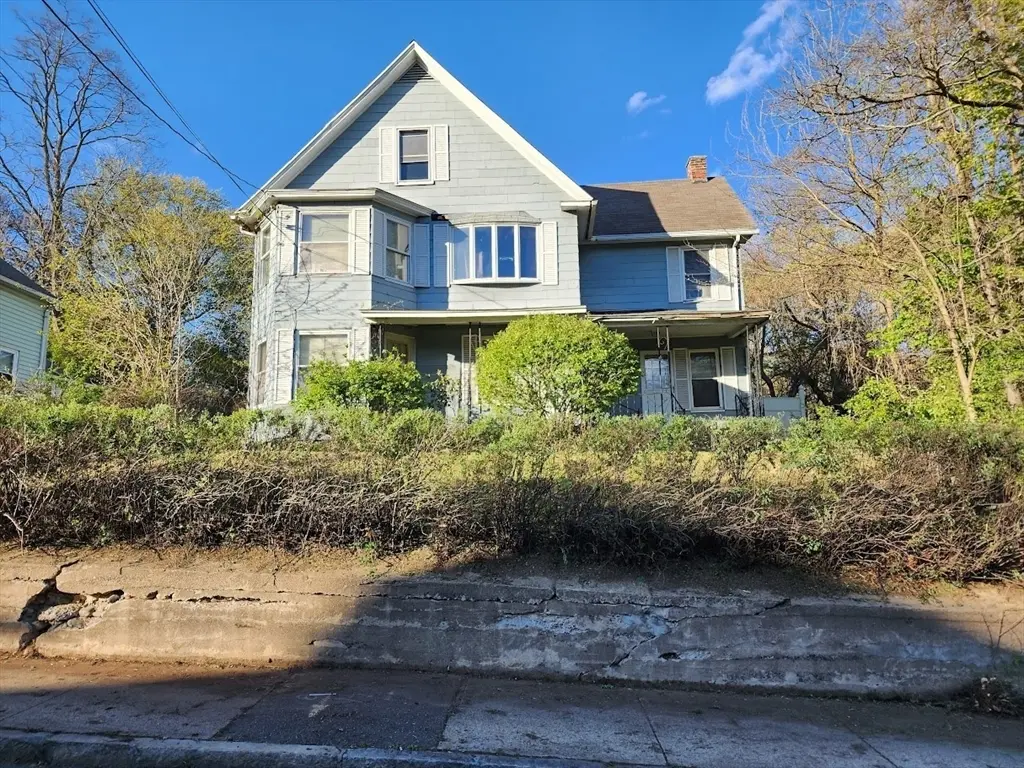
156 Grattan St · Chicopee, MA
Flood risk 1/10 · Minimal
- FEMA flood zone
- X (unshaded)
- Chance of flooding over 30 yrs
- 0.0%
- Est. flood insurance / yr
- $473 – $860
Fire risk 2/10 · Minimal
- Est. fire insurance / yr
- $915 – $1,699
Heat risk 4/10 · Minor
- Hot days now (above 98°F)
- 7 days/yr
- Hot days in 30 yrs
- 16 days/yr
Wind risk 5/10 · Moderate
- Chance of severe wind over 30 yrs
- 23.0%
Air-quality risk 2/10 · Minimal
- Unhealthy air days now
- 1 days/yr
- Unhealthy air days in 30 yrs
- 1 days/yr
Risk factors via First Street. Map © Google.
Why this score? — see what drove the B+ grade
The composite is a weighted blend of 9 inputs, each scored 0–100. Each bar is that input's sub-score; the figure is the points it added to the 100-point composite (weight × sub-score).
- Cash flow +30.0/30.0
- ARV discount +15.0/15.0
- 1% rule +10.0/10.0
- DSCR +10.0/10.0
- Livability +3.8/5.0
- Rent growth +2.5/5.0
- Condition / age +2.5/5.0
- Schools +2.3/10.0
- Appreciation +0.0/10.0
$219,900
🖨 Deal sheet 📄 Offer letter ✓ Due diligence
Multi-family units
County records classify this as Multi-Family (2-4 Unit). Listing-text estimate: 2 units. confirmed
Listing remarks MLS
WOW! Look at these pictures and...in Chicopee! Well maintained, immaculate 2 family with an open floor plan. Private yard with in-ground pool ready for summer fun. Garage is every man's dream with an office and over-sized 2 bay work area for that fix it guy. Leisure living doesn't come at this price!
Key facts
- Separate utilities
- Off street parking
- Two family property
Tags
Property features AI
Finance
- Other: Buyer responsible for smoke certificate, final water reading, and other required certificates
- HOA & community: Community features include public transportation, shopping, highway access, public schools, and sidewalks; Not a senior community
Exterior
- Parking: 2-car garage; 2 covered spaces; 5 open parking spaces; Total of 7 parking spaces; Off-street, paved parking
- Utilities: Public water; Public sewer; Gas available for range
- Home design: 2-family (up/down) multiunit; 3 total stories; Building area approximately 2,111
- Construction: Frame construction; Stone foundation; Shingle roof; Built (year per public records)
- Exterior features: Fenced yard (enclosed); Porch (enclosed); In-ground pool; Cleared, level lot; Paved, public road frontage on a publicly maintained road
Interior
- Bathrooms: 2 full bathrooms
- Interior features: Total of 10 rooms; Full, unfinished basement with bulkhead
Neighborhood map
What this means for you Summary
Snapshot
- This is a 2 × 2-bed/1.0-bath units multifamily listed at $220k.
Deal economics
- At list price, monthly cash flow is $1k ($16k/yr) — positive. Per door: $657/mo.
- The deal already cash-flows at list — no discount required.
- Meets the 1% rule at list price ($4k rent vs $220k).
- Cap rate 13.5% vs local median 4.6% in Chicopee — top-decile yield for the area; either an underpriced asset or a hidden risk that comps aren't pricing in. Stress-test before assuming the spread holds.
Location & tenants
- Location reads 76/100 on livability (#66 in MA, #3,658 nationally) — a middle-class / working-renter tenant base. Strengths: commute A+, housing A+, health & safety A+; Watch: employment D+, schools D, crime F.
- Chicopee (suburban): math 20% / reading 33% proficiency, ranked #270 of 302 in MA (top 89%) — low school quality limits family demand, transient renter base, plan for 1-2y turnover.
- Market conditions: 20 active listings in the ZIP; 1 comparable units currently listed for rent nearby; 453 units permitted in Hampden County in 2024 (116 in 5+ unit buildings).
- At $3,671/mo this rent would consume 67% of the median local household income ($66k/yr) (locally 1153% of renters already pay >50% of income on rent) — very limited rent-growth headroom before tenants either downsize or default.
Forward outlook
- Local home prices are declining (-3.0%/yr); year-one equity from $2k of loan paydown is wiped out by about $7k of value loss. Plan a longer hold.
- Hampden County population projected at +5% by 2050 — modest demand growth; plan on rents tracking national, not racing it.
- At projected returns (-3.0% appreciation + 3.0% rent growth), your $62k cash investment doubles in ~5 years — after that, you're playing with house money.
Negotiation context
- Only 14 days on market — expect competitive offers; lowballing is unlikely to land.
- 2 sale attempts since 17y ago with the ask held roughly flat each time — persistent listings suggest the price (not the market) is what's stuck; bring a comps-based counter.
Risks & watch-outs
- Watch-outs: built in 1880 — expect roof / HVAC / electrical / plumbing capex.
- Climate carrying-cost: moderate wind risk, 23% chance of damaging wind over 30y — expect insurance premiums to compound above CPI over the hold.
Questions for the listing agent
- Can we see the unit-by-unit rent roll, current vacancy, and any below-market leases? What's the average tenancy length?
- What capital expenditures (roof, boiler, parking lot, exteriors) have been made in the last 5 years, and what's planned in the next 2?
- Built in 1880 — when were the roof, HVAC, electrical panel, plumbing, and water heater last replaced?
- Is there a deadline driving the sale (1031 exchange, divorce, estate, relocation)? That informs how much negotiation room exists.
- Schools are D-rated, which usually means shorter tenancies and higher turnover. Who's the typical renter profile here, and what's been the actual vacancy rate?
- Crime grade is F in this area — have there been break-ins, vandalism, or insurance claims at this property in the last 3 years? What carrier currently insures it and at what premium?
- What's the average days-on-market for RENTAL listings here right now (not sales)? A rising rental-DOM trend means longer vacancies and softer asking-rent achievability than the comps imply.
- What's the recent tenant-quality profile in this submarket — average credit score on applications, eviction rate, late-payment / NSF rate, and stable-employment percentage? A property-management company in the area should have these aggregated.
- How much new apartment / multifamily construction is in the pipeline within 1–3 miles? Heavy new supply (>2% of stock underway) typically softens rents 12–24 months out; light construction supports rent growth.
Investment metrics
- 1% rule
- 1.67% ✓
- Cap rate
- 13.47%
- Cash-on-cash
- 25.61%
- DSCR
- 2.14
- GRM
- 5.0
CMA / ARV
- ARV (on-the-fly)
- $430,644
- Comps found
- 4
Show comp detail 4 sales within ~0.75 mi
| Address | Dist | Beds/Ba | Sqft | Sold | Price | $/sf | Match |
|---|---|---|---|---|---|---|---|
| 59-61 Hawthorn St | 0.33mi | 4/3.0 | 2,052 (-3%) | 11mo | $440,000 | $214 | 67 |
| 45 Hastings St | 0.58mi | 5/2.0 (+1) | 2,134 (+1%) | 2mo | $376,000 | $176 | 64 |
| 28 Maple St | 0.52mi | 5/2.0 (+1) | 1,944 (-8%) | 0mo | $347,000 | $178 | 57 |
| 46 Kaveney St | 0.69mi | 4/2.0 | 1,816 (-14%) | 16mo | $370,000 | $204 | 31 |
Match score weights: distance 35% · size 25% · config 20% · recency 20%. Top-matched comps best support the ARV.
Projected returns pro-forma
-3.0% appreciation · 3.0% rent growth · sell at horizon
- IRR
- 19.3%
- Equity multiple
- 1.78×
- Total profit
- $48,170
- Equity at exit
- $32,788
- IRR
- 27.6%
- Equity multiple
- 3.44×
- Total profit
- $150,123
- Equity at exit
- $19,013
Cash invested: $61,572 (down + closing). Projections, not guarantees.
Landlord ↔ Tenant lean methodology
- Overall (STATE)
- 20 Strongly Tenant-Friendly
- State Massachusetts
- 20 Strongly Tenant-Friendly · D+15
- County
- — inherits STATE
- City
- — inherits STATE
ZIP-level market 01020
- Home prices YoY
- -34.5%
- Active inventory
- 20
- Price-to-rent
- 10.0×
Monthly cashflow live
- Estimated rent
- $3,671 high interval (Pro) →
- Mortgage (P&I)
- −$1,153
- Tax from tax record
- −$341 /mo · $4,092/yr
- Insurance
- −$92
- HOA
- −$0
- Vacancy / Maint / Mgmt
- −$771
- Net cashflow
- $1,314
Break-even live
2-unit breakdown (identical units grouped — click to expand)
| Units | Beds | Baths | Est. rent |
|---|---|---|---|
| 2× units | 2 | 1 | $3,672 |
| #1 | 2 | 1 | $1,836 |
| #2 | 2 | 1 | $1,836 |
| Total (2 units) | $3,671 | ||
UW: 25.0% down · 7.5% · 30yr · 1.5% tax · 5.0% vac · 8.0% maint · 8.0% mgmt
Financing live
Cash to close
- Down payment
- $54,975
- Closing costs
- $6,597
- Reserves months
- —
- Total cash needed
- —
Loan-product check · same deal, 3 products live
Conventional
25% down · 7.5% · 30yr
- Down + closing
- —
- Monthly P&I
- —
- Monthly cashflow
- —
- DSCR
- —
- Eligible?
- —
Personal DTI + credit; lowest rate.
DSCR
20% down · 8.5% · 30yr
- Down + closing
- —
- Monthly P&I
- —
- Monthly cashflow
- —
- DSCR
- —
- Eligible?
- —
No personal income docs; deal must DSCR.
Hard money
10% down · 12.0% · 12mo
- Down + closing
- —
- Monthly P&I
- —
- Monthly cashflow
- —
- DSCR
- —
- Eligible?
- —
Short-term bridge; refi at stabilization.
Rent comps 1 comps
| Address | Beds | Baths | Sqft | Rent | $/sqft | DOM | Units | Dist |
|---|---|---|---|---|---|---|---|---|
| 86 Cochran St Unit 3 Chicopee, MA | 3.0 | 1.0 | 1500 | $2,000 | $1.33 | 43d | 1 | 0.79mi |
Listing history 11 events
-
2026-06-18days on market $219,900 Active 14 DOM
-
2026-06-17days on market $219,900 Active 13 DOM
-
2026-06-16days on market $219,900 Active 12 DOM
-
2026-06-15days on market $219,900 Active 11 DOM
-
2026-06-14days on market $219,900 Active 9 DOM
-
2026-06-13days on market $219,900 Active 8 DOM
-
2026-06-10days on market $219,900 Active 6 DOM
-
2026-06-09days on market $219,900 Active 5 DOM
-
2026-06-08statusdays on market $219,900 Active 4 DOM
-
2026-06-07remarks 699-char remark
-
2026-06-07$219,900 New 3 DOM
ⓘ Source: listings_history table (triggers on properties + properties_extension) + one-shot
backfill from property_details.listing_events for pre-trigger history.
Tax reassessment forecast MA · Partial reset (capped growth)
- Current annual tax
- $4,092 · $341/mo
- Projected year-2 tax
- $4,092 · $341/mo
- Expected delta
- $0/yr ($0/mo · 0.0%)
ⓘ Screening estimate from a state-policy table — verify with the county assessor before closing.
Climate risk First Street
- Flood 1/10 Low FEMA zone X (unshaded) · 0% chance over 30 yrs
- Wildfire 2/10 Low
- Heat 4/10 Moderate 7 d/yr ≥98°F today · 16 d/yr by 30 yrs out
- Wind 5/10 Major 23% chance of damaging wind over 30 yrs
- Air quality 2/10 Low 1 unhealthy d/yr today · 1 by 30 yrs out
Nearby sold comps map
Loading sold comps map…
Walkable amenities ~0.75 mi
Loading nearby amenities…
Taxation est. · year 1
- Rental income
- $44,052
- − Mortgage interest
- −$12,318
- − Property taxes
- −$4,092
- − Insurance
- −$1,100
- − Repairs & maintenance
- −$3,524
- − Management
- −$3,524
- − Depreciation
- −$6,397
- Taxable income
- $13,097
- Est. tax owed @ 24.0%
- −$3,143
- After-tax cash flow
- $12,628/yr
For passive investors: Depreciation is non-cash, so a rental often shows a tax loss while cash-flowing — sheltering income. Rental losses are passive: they offset passive income freely, and up to $25,000/yr can offset ordinary (W-2) income if you actively participate and your MAGI is under $100k (phasing out to $0 by $150k); unused losses carry forward. On sale, claimed depreciation is recaptured at up to 25%, and gains may owe capital-gains tax (a 1031 exchange can defer both). Figures are a year-1 estimate at your 24.0% rate — not tax advice; consult a CPA.
Schools (NCES district)
- District
- Chicopee
- NCES district ID
- 2503660
- Math proficiency
- 20% ▼ -22.00%
- Reading proficiency
- 33% ▼ -10.00%
- Median HH income
- $46,414
- Composite
- 22.91/100
- National rank
- #7997
- State rank
- #270 of 302 in MA
Livability — Chicopee
- Score
- 76/100
- State rank
- #66
- US rank
- #3658
Category grades
Schools grade is shown separately in the Schools card above.
Census & demographics
- Census place
- Chicopee, MA
- County
- Hampden County · 230,965 people
- City population
- 53,451
- Metro
- Springfield, MA
- Population (ZIP)
- 30,167
- Household income
- $66,009
- Rent vs Own
- Severe rent burden
- 1153.0
Population outlook (Hampden County) Hauer SSP2
- Today (2025)
- 485,646 people
- By 2030
- 491,517 · +1.2%
- By 2040
- 500,539 · +3.1%
- By 2050
- 508,827 · +4.8%
- By 2075
- 539,167 · +11.0%
- By 2100
- 545,698 · +12.4%
Race, ethnicity, and origin ACS 2023
- Neighborhood character
- Predominantly White (71%)
- Race & ethnicity
- White 71% Hispanic / Latino 21% Two or more races 11% Black 4% Asian 2%
- Hispanic origin (detail)
- Puerto Rican 18% Dominican 2%
- Common ancestry
- Romanian 15% Lithuanian 14% Scotch-Irish 2%
- Foreign-born
- 9% · Canada
- Languages at home
- 80% English-only · Spanish 11% Russian/Polish/Slavic 3% Other Asian/Pacific 2%
Political lean MEDSL · Hampden
- 2024 margin
- Lean D (+8.9) · D 53.4% · R 44.5% · Other 2.1%
- 2008→2024 swing
- -16.4pp toward R · 2008: 25.3pp · 2024: 8.9pp
- All cycles
- 2024: D+8.9 2020: D+17.7 2016: D+16.0 2012: D+25.4 2008: D+25.3
Not yet ingested
- Civics
- —
Market trends
- HPI YoY
- ▼ -150.25%
- Current HPI
- 285.6119
- Rent YoY
- —
- Metro
- Springfield, MA
- State GDP YoY
- ▲ 2.28%
- F500 in state
- 38
Industry mix (Fortune 500 HQ in MA)
| Industry | F500 HQs | Revenue |
|---|---|---|
| Technology | 3 | $17B |
|
||
| Insurance | 2 | $84B |
|
||
| Retail | 2 | $76B |
|
||
| Life Sciences | 1 | $43B |
|
||
| Energy Technology | 1 | $31B |
|
||
| Aerospace / Defense | 1 | $18B |
|
||
Price history
+12.8% since first listed4 events — show timeline
- 2026-06-04 Listed $219,900 MLS PIN
- 2009-10-20 Sold (Public Records) $195,000 Public Records
- 2009-10-20 Sold (MLS) $195,000 MLS PIN
- 2009-06-30 Listed $195,000 MLS PIN
Property tax history
+3.3%/yrLatest (2023): $4,092 · +1.7% YoY. Source: county tax records.
Cash-flow waterfall
monthlySold comps — $/sqft
last 12 mo · ≤1 miLoading sold comps…