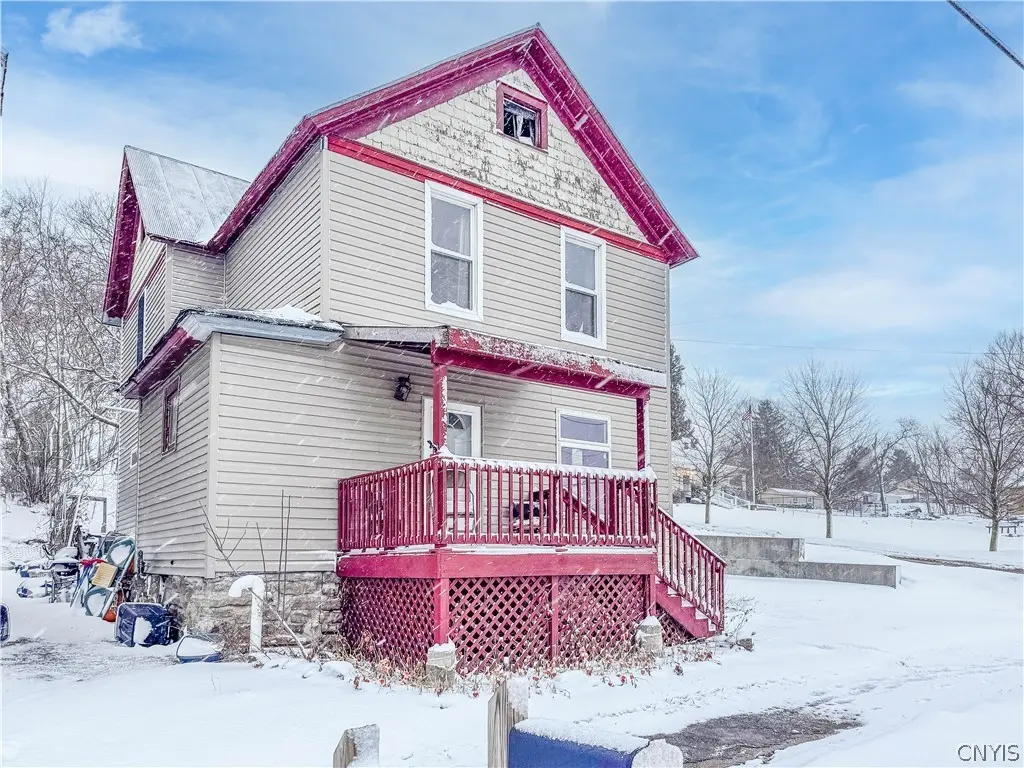
214 Main St · Hammond, NY
Flood risk 1/10 · Minimal
- FEMA flood zone
- —
- Chance of flooding over 30 yrs
- 0.0%
- Est. flood insurance / yr
- —
Fire risk 1/10 · Minimal
- Est. fire insurance / yr
- $691 – $1,283
Heat risk 2/10 · Minimal
- Hot days now (above 93°F)
- 7 days/yr
- Hot days in 30 yrs
- 15 days/yr
Wind risk 1/10 · Minimal
- Chance of severe wind over 30 yrs
- —
Air-quality risk 2/10 · Minimal
- Unhealthy air days now
- 1 days/yr
- Unhealthy air days in 30 yrs
- 1 days/yr
Risk factors via First Street. Map © Google.
Why this score? — see what drove the B grade
The composite is a weighted blend of 9 inputs, each scored 0–100. Each bar is that input's sub-score; the figure is the points it added to the 100-point composite (weight × sub-score).
- Cash flow +30.0/30.0
- 1% rule +10.0/10.0
- DSCR +10.0/10.0
- ARV discount +7.5/15.0
- Schools +3.9/10.0
- Livability +3.0/5.0
- Rent growth +2.5/5.0
- Condition / age +2.5/5.0
- Appreciation +1.9/10.0
$64,900
🖨 Deal sheet (PDF) 📄 Offer letter ✓ Due diligence
Listing remarks MLS
Check out this great find! Solid home ready for some love with impressive views of the St Lawrence River! Renovate this great home today for your home or cottage! Located right across from the river with amazing views and next to Boat Launch for immediate easy access! Would be great for a fishing camp! Also, across the street from an amazing well known Restaurant Ellas! This 3-bedroom 1.5 bath home is very spacious and on a larger corner lot with good parking! Cozy back yard, great location and views! A rare find with this kind of river access and scenery! Home has been winterized and is in excellent structural condition! Do not miss out, call today!
Key facts
- Larger corner lot
- Cozy back yard
- Good parking
Tags
Neighborhood map
What this means for you Summary
Snapshot
- This is a 3-bed/1.5-bath single-family listed at $65k.
Deal economics
- At list price, monthly cash flow is $557 ($7k/yr) — positive.
- The deal already cash-flows at list — no discount required.
- Meets the 1% rule at list price ($1k rent vs $65k).
- Recommended offer: $63k (3.0% below list) — sets the bar for market timing.
- Cap rate 16.6% vs local median 2.4% in Hammond — top-decile yield for the area; either an underpriced asset or a hidden risk that comps aren't pricing in. Stress-test before assuming the spread holds.
Location & tenants
- Location reads 59/100 on livability (#1,028 in NY) — a working-class tenant base; expect higher turnover. Strengths: cost of living A+, housing A+; Watch: schools C-, employment D+, health & safety D.
- Morristown Central School District (rural): math 45% / reading 40% proficiency, ranked #600 of 755 in NY (top 80%) — families likely to look elsewhere, expect single-tenant / working-renter base with shorter leases.
- Market conditions: 17 active listings in the ZIP; 215 units permitted in St. Lawrence County in 2024 (0 in 5+ unit buildings).
Forward outlook
- Local home prices are declining (-3.0%/yr); year-one equity from $449 of loan paydown is wiped out by about $2k of value loss. Plan a longer hold.
- St. Lawrence County population projected at -14% by 2050 — secular population decline; favor cash flow + early exit over multi-decade hold.
- At projected returns (-3.0% appreciation + 3.0% rent growth), your $18k cash investment doubles in ~4 years — after that, you're playing with house money.
Negotiation context
- It's been on market 60 days — a 3% lower offer ($63k) is reasonable based on typical stale-listing flexibility.
- 2 sale attempts; this cycle's ask has dropped $4k (6%) from the opening price — seller is motivated, your offer sets the floor, not the list.
Risks & watch-outs
- Watch-outs: property tax is 3.4% of price; built in 1900 — expect roof / HVAC / electrical / plumbing capex.
Questions for the listing agent
- It's been on market 60 days. Have you received any prior offers? Is the seller open to a 3% concession, seller financing, or rate buy-down credit?
- Built in 1900 — when were the roof, HVAC, electrical panel, plumbing, and water heater last replaced?
- Property tax is high relative to price — has the assessment been appealed recently, and will the sale trigger a re-assessment?
- Is there a deadline driving the sale (1031 exchange, divorce, estate, relocation)? That informs how much negotiation room exists.
- Crime grade is F in this area — have there been break-ins, vandalism, or insurance claims at this property in the last 3 years? What carrier currently insures it and at what premium?
- What's the average days-on-market for RENTAL listings here right now (not sales)? A rising rental-DOM trend means longer vacancies and softer asking-rent achievability than the comps imply.
- What's the recent tenant-quality profile in this submarket — average credit score on applications, eviction rate, late-payment / NSF rate, and stable-employment percentage? A property-management company in the area should have these aggregated.
- How much new for-sale + rental construction is in the pipeline within 1–3 miles? Heavy new supply typically softens prices + rents 12–24 months out; constrained supply supports both.
Investment metrics
- 1% rule
- 2.16% ✓
- Cap rate
- 16.59%
- Cash-on-cash
- 36.76%
- DSCR
- 2.64
- GRM
- 3.9
CMA / ARV
- ARV (median comp)
- $190,683
- List price
- $64,900
- Delta
- -65.96%
- Verdict
- UNDERPRICED
- Comps
- 20 within 1.0 mi
Show comp detail 5 sales within ~0.75 mi
| Address | Dist | Beds/Ba | Sqft | Sold | Price | $/sf | Match |
|---|---|---|---|---|---|---|---|
| 401 Gouverneur St | 0.15mi | 3/2.5 | 1,806 (+3%) | 10mo | $180,000 | $100 | 76 |
| 700 Gouverneur St | 0.35mi | 3/1.5 | 1,675 (-5%) | 16mo | $139,000 | $83 | 62 |
| 405 Gouverneur St | 0.18mi | 4/2.0 (+1) | 1,990 (+13%) | 6mo | $55,000 | $28 | 58 |
| 700 Main St | 0.34mi | 4/1.5 (+1) | 1,590 (-10%) | 20mo | $60,000 | $38 | 47 |
| 700 Main St | 0.34mi | 4/2.0 (+1) | 1,590 (-10%) | 20mo | $60,000 | $38 | 45 |
Match score weights: distance 35% · size 25% · config 20% · recency 20%. Top-matched comps best support the ARV.
Projected returns pro-forma
-3.0% appreciation · 3.0% rent growth · sell at horizon
- IRR
- 32.7%
- Equity multiple
- 2.38×
- Total profit
- $25,020
- Equity at exit
- $9,677
- IRR
- 39.7%
- Equity multiple
- 4.73×
- Total profit
- $67,778
- Equity at exit
- $5,611
Cash invested: $18,172 (down + closing). Projections, not guarantees.
Landlord ↔ Tenant lean methodology
- Overall (STATE)
- 15 Strongly Tenant-Friendly
- State New York
- 15 Strongly Tenant-Friendly · D+10
- County
- — inherits STATE
- City
- — inherits STATE
ZIP-level market 13664
- Home prices YoY
- -2.6%
- Active inventory
- 17
- Price-to-rent
- 3.9×
Monthly cashflow live
- Estimated rent
- $1,401 medium interval (Pro) →
- Mortgage (P&I)
- −$340
- Tax from tax record
- −$183 /mo · $2,196/yr
- Insurance
- −$27
- HOA
- −$0
- Vacancy / Maint / Mgmt
- −$294
- Net cashflow
- $557
Break-even live
Sensitivity live
| Price | -10% $593 | -5% $575 | +0% $557 | +5% $538 | +10% $520 |
|---|---|---|---|---|---|
| Rent | -10% $446 | -5% $501 | +0% $557 | +5% $612 | +10% $667 |
| Rate | -1.0pp $589 | -0.5pp $573 | base $557 | +0.5pp $540 | +1.0pp $523 |
UW: 25.0% down · 7.5% · 30yr · 1.5% tax · 5.0% vac · 8.0% maint · 8.0% mgmt
Financing live
Cash to close
- Down payment
- $16,225
- Closing costs
- $1,947
- Reserves months
- —
- Total cash needed
- —
Loan-product check · same deal, 3 products live
Conventional
25% down · 7.5% · 30yr
- Down + closing
- —
- Monthly P&I
- —
- Monthly cashflow
- —
- DSCR
- —
- Eligible?
- —
Personal DTI + credit; lowest rate.
DSCR
20% down · 8.5% · 30yr
- Down + closing
- —
- Monthly P&I
- —
- Monthly cashflow
- —
- DSCR
- —
- Eligible?
- —
No personal income docs; deal must DSCR.
Hard money
10% down · 12.0% · 12mo
- Down + closing
- —
- Monthly P&I
- —
- Monthly cashflow
- —
- DSCR
- —
- Eligible?
- —
Short-term bridge; refi at stabilization.
Listing history 14 events
-
2026-06-05days on market $64,900 Active 60 DOM
-
2026-06-04days on market $64,900 Active 58 DOM
-
2026-06-02days on market $64,900 Active 57 DOM
-
2026-06-01days on market $64,900 Active 56 DOM
-
2026-05-31days on market $64,900 Active 55 DOM
-
2026-05-13price $64,900 658-char remark
Show marketing remark (658 chars)
Check out this great find! Solid home ready for some love with impressive views of the St Lawrence River! Renovate this great home today for your home or cottage! Located right across from the river with amazing views and next to Boat Launch for immediate easy access! Would be great for a fishing camp! Also, across the street from an amazing well known Restaurant Ellas! This 3-bedroom 1.5 bath home is very spacious and on a larger corner lot with good parking! Cozy back yard, great location and views! A rare find with this kind of river access and scenery! Home has been winterized and is in excellent structural condition! Do not miss out, call today!
-
2026-04-06$69,000 Active 658-char remark
Show marketing remark (658 chars)
Check out this great find! Solid home ready for some love with impressive views of the St Lawrence River! Renovate this great home today for your home or cottage! Located right across from the river with amazing views and next to Boat Launch for immediate easy access! Would be great for a fishing camp! Also, across the street from an amazing well known Restaurant Ellas! This 3-bedroom 1.5 bath home is very spacious and on a larger corner lot with good parking! Cozy back yard, great location and views! A rare find with this kind of river access and scenery! Home has been winterized and is in excellent structural condition! Do not miss out, call today!
-
2026-04-01historical
-
2026-03-30price $69,000
-
2026-03-02price $89,000
-
2026-02-08price $99,000
-
2026-01-20$109,000 Active
-
2019-04-15soldstatus $68,000
-
2001-10-31soldstatus $28,600
ⓘ Source: listings_history table (triggers on properties + properties_extension) + one-shot
backfill from property_details.listing_events for pre-trigger history.
Tax reassessment forecast NY · Partial reset (capped growth)
- Current annual tax
- $2,196 · $183/mo
- Projected year-2 tax
- $2,196 · $183/mo
- Expected delta
- $0/yr ($0/mo · 0.0%)
ⓘ Screening estimate from a state-policy table — verify with the county assessor before closing.
Climate risk First Street
- Flood 1/10 Low 0% chance over 30 yrs
- Wildfire 1/10 Low
- Heat 2/10 Low 7 d/yr ≥93°F today · 15 d/yr by 30 yrs out
- Wind 1/10 Low
- Air quality 2/10 Low 1 unhealthy d/yr today · 1 by 30 yrs out
Nearby sold comps map
Loading sold comps map…
Walkable amenities ~0.75 mi
Loading nearby amenities…
Taxation est. · year 1
- Rental income
- $16,816
- − Mortgage interest
- −$3,635
- − Property taxes
- −$2,196
- − Insurance
- −$324
- − Repairs & maintenance
- −$1,345
- − Management
- −$1,345
- − Depreciation
- −$1,888
- Taxable income
- $6,081
- Est. tax owed @ 24.0%
- −$1,459
- After-tax cash flow
- $5,220/yr
For passive investors: Depreciation is non-cash, so a rental often shows a tax loss while cash-flowing — sheltering income. Rental losses are passive: they offset passive income freely, and up to $25,000/yr can offset ordinary (W-2) income if you actively participate and your MAGI is under $100k (phasing out to $0 by $150k); unused losses carry forward. On sale, claimed depreciation is recaptured at up to 25%, and gains may owe capital-gains tax (a 1031 exchange can defer both). Figures are a year-1 estimate at your 24.0% rate — not tax advice; consult a CPA.
Schools (NCES district)
- District
- Morristown Central School District
- NCES district ID
- 3619890
- Math proficiency
- 45% ▲ 5.00%
- Reading proficiency
- 40% ▬ 0.00%
- Median HH income
- $49,532
- Composite
- 38.86/100
- National rank
- #8336
- State rank
- #600 of 755 in NY
Livability — Hammond
- Score
- 59/100
- State rank
- #1028
- US rank
- #20133
Category grades
Schools grade is shown separately in the Schools card above.
Census & demographics
- City population
- 2,373
- Population (ZIP)
- 401
Population outlook (St. Lawrence County) Hauer SSP2
- Today (2025)
- 110,027 people
- By 2030
- 107,455 · -2.3%
- By 2040
- 100,492 · -8.7%
- By 2050
- 94,254 · -14.3%
- By 2075
- 80,175 · -27.1%
- By 2100
- 63,140 · -42.6%
Race, ethnicity, and origin ACS 2023
- Neighborhood character
- Predominantly White (87%)
- Race & ethnicity
- White 87% Hispanic / Latino 7% Two or more races 7% Black 3%
- Hispanic origin (detail)
- Puerto Rican 5%
- Common ancestry
- Lithuanian 4% German 3% Danish 2%
- Foreign-born
- 4% · Canada
- Languages at home
- 96% English-only · Spanish 2% French/Haitian/Cajun 1% Russian/Polish/Slavic 1%
Political lean MEDSL · St. Lawrence
- 2024 margin
- R (+18.0) · D 41.0% · R 59.0%
- 2008→2024 swing
- -34.3pp toward R · 2008: 16.3pp · 2024: -18.0pp
- All cycles
- 2024: R+18.0 2020: R+11.7 2016: R+10.8 2012: D+16.6 2008: D+16.3
Not yet ingested
- Civics
- —
Market trends
- HPI YoY
- ▼ -6.29%
- Current HPI
- 234.882
- Rent YoY
- —
- Metro
- —
- State GDP YoY
- ▲ 2.60%
- F500 in state
- 92
Industry mix (Fortune 500 HQ in NY)
| Industry | F500 HQs | Revenue |
|---|---|---|
| Financial Services | 10 | $950B |
|
||
| Consumer Goods | 9 | $162B |
|
||
| Insurance | 4 | $225B |
|
||
| Telecommunications | 2 | $144B |
|
||
| Pharmaceuticals | 2 | $112B |
|
||
| Media / Entertainment | 2 | $69B |
|
||
Price history
+126.9% since first listed9 events — show timeline
- 2026-05-13 Price Changed $64,900 CNYIS
- 2026-04-06 Listed $69,000 CNYIS
- 2026-04-01 Listing Removed — CNYIS
- 2026-03-30 Price Changed $69,000 CNYIS
- 2026-03-02 Price Changed $89,000 CNYIS
- 2026-02-08 Price Changed $99,000 CNYIS
- 2026-01-20 Listed $109,000 CNYIS
- 2019-04-15 Sold (Public Records) $68,000 Public Records
- 2001-10-31 Sold (Public Records) $28,600 Public Records
Property tax history
-2.2%/yrLatest (2025): $2,196 · -0.2% YoY. Source: county tax records.
Cash-flow waterfall
monthlySold comps — $/sqft
last 12 mo · ≤1 miLoading sold comps…