7361 Queens Ct Lot : 32 · Pine River, MI
Flood risk 1/10 · Minimal
- FEMA flood zone
- X (unshaded)
- Chance of flooding over 30 yrs
- 0.0%
- Est. flood insurance / yr
- $507 – $1,088
Fire risk 1/10 · Minimal
- Est. fire insurance / yr
- $784 – $1,456
Heat risk 2/10 · Minimal
- Hot days now (above 98°F)
- 7 days/yr
- Hot days in 30 yrs
- 14 days/yr
Wind risk 1/10 · Minimal
- Chance of severe wind over 30 yrs
- —
Air-quality risk 2/10 · Minimal
- Unhealthy air days now
- 1 days/yr
- Unhealthy air days in 30 yrs
- 2 days/yr
Risk factors via First Street. Map © Google.
Why this score? — see what drove the C+ grade
The composite is a weighted blend of 9 inputs, each scored 0–100. Each bar is that input's sub-score; the figure is the points it added to the 100-point composite (weight × sub-score).
- Cash flow +30.0/30.0
- 1% rule +10.0/10.0
- DSCR +10.0/10.0
- Schools +3.0/10.0
- Rent growth +2.5/5.0
- Livability +2.5/5.0
- Condition / age +2.2/5.0
- ARV discount +0.0/15.0
- Appreciation +0.0/10.0
$55,500
🖨 Deal sheet 📄 Offer letter ✓ Due diligence
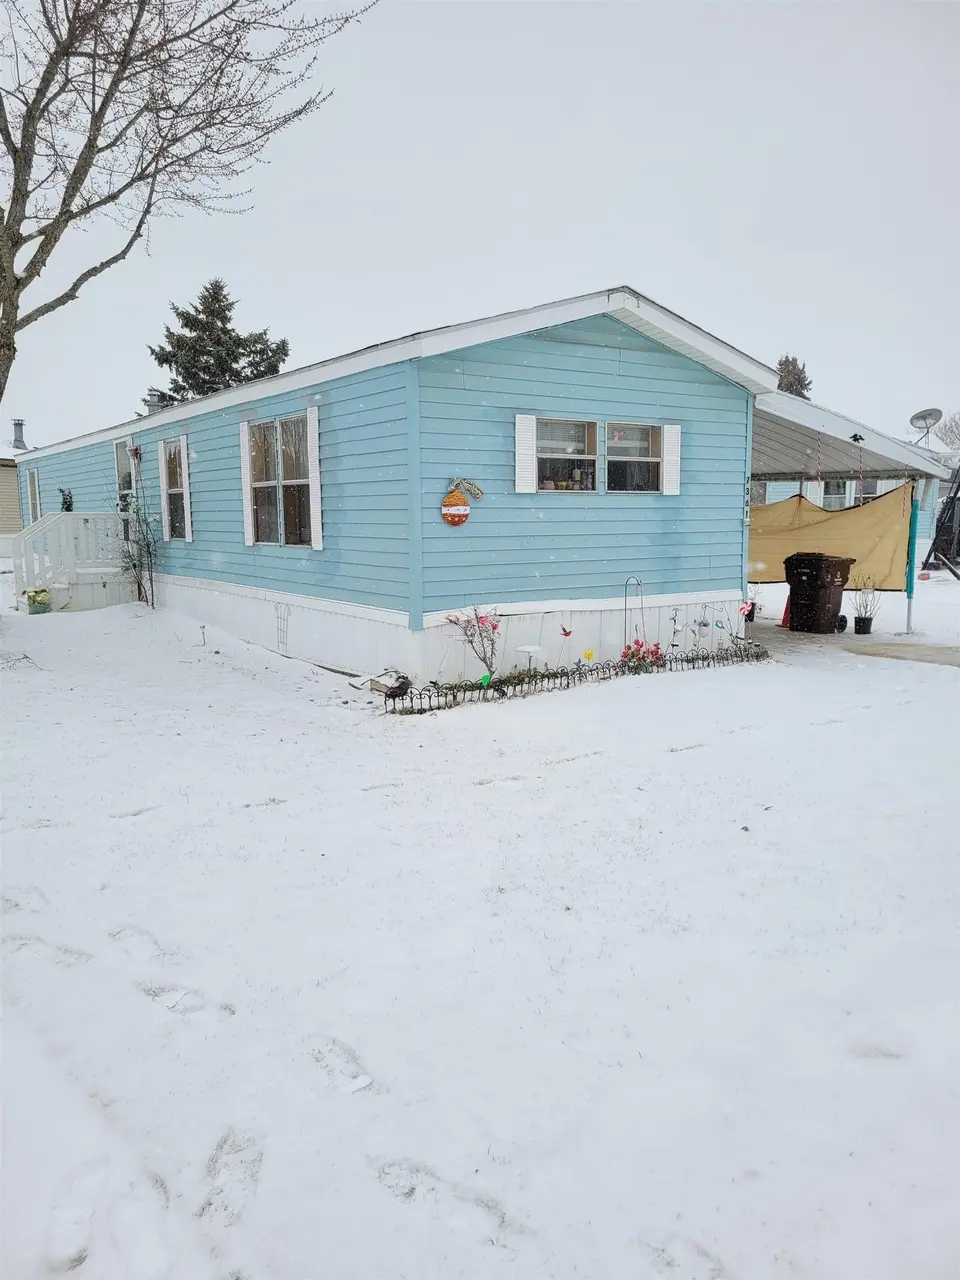
Listing remarks MLS
Beautiful and clean 1991 single-wide trailer in Scottsdale Estates! This 2-bedroom, 1-bath mobile home rounds out at approximately 914 square feet, and features a sizable primary bedroom and open kitchen and living spaces. Driveway and approach are updated as of 2021. Great space for a great price!!
Key facts
- Scottsdale estates
- Open kitchen
- Updated driveway
Tags
Neighborhood map
What this means for you Summary
Snapshot
- This is a 2-bed/1.0-bath single-family listed at $56k. Condition is rated fair.
Deal economics
- At list price, monthly cash flow is $554 ($7k/yr) — positive.
- The deal already cash-flows at list — no discount required.
- Meets the 1% rule at list price ($1k rent vs $56k).
- Recommended offer: $49k (12.0% below list) — sets the bar for market timing.
Location & tenants
- Location reads: area grade C — affects rentability + tenant quality, not the cash-flow math above.
- Alma Public Schools (town): math 28% / reading 44% proficiency, ranked #288 of 540 in MI (top 53%) — families likely to look elsewhere, expect single-tenant / working-renter base with shorter leases.
- Market conditions: 89 active listings in the ZIP; 2 comparable units currently listed for rent nearby; 47 units permitted in Gratiot County in 2024 (0 in 5+ unit buildings).
Forward outlook
- Local home prices are declining (-3.0%/yr); year-one equity from $384 of loan paydown is wiped out by about $2k of value loss. Plan a longer hold.
- Gratiot County population projected at -14% by 2050 — secular population decline; favor cash flow + early exit over multi-decade hold.
- At projected returns (-3.0% appreciation + 3.0% rent growth), your $16k cash investment doubles in ~3 years — after that, you're playing with house money.
Negotiation context
- It's been on market 149 days — a 12% lower offer ($49k) is reasonable based on typical stale-listing flexibility.
Questions for the listing agent
- It's been on market 149 days. Have you received any prior offers? Is the seller open to a 12% concession, seller financing, or rate buy-down credit?
- Have any recent inspections been done? Can we get a copy of the seller's disclosures and any deferred-maintenance estimates?
- Why hasn't it sold? Are there any deal-killer items the seller is aware of (foundation, flood, title, zoning, code violations)?
- Is there a deadline driving the sale (1031 exchange, divorce, estate, relocation)? That informs how much negotiation room exists.
- What's the average days-on-market for RENTAL listings here right now (not sales)? A rising rental-DOM trend means longer vacancies and softer asking-rent achievability than the comps imply.
- What's the recent tenant-quality profile in this submarket — average credit score on applications, eviction rate, late-payment / NSF rate, and stable-employment percentage? A property-management company in the area should have these aggregated.
- How much new for-sale + rental construction is in the pipeline within 1–3 miles? Heavy new supply typically softens prices + rents 12–24 months out; constrained supply supports both.
Investment metrics
- 1% rule
- 2.14% ✓
- Cap rate
- 18.28%
- Cash-on-cash
- 42.80%
- DSCR
- 2.90
- GRM
- 3.9
CMA / ARV
- ARV (median comp)
- $44,000
- List price
- $55,500
- Delta
- 26.14%
- Verdict
- OVERPRICED
- Comps
- 17 within 1.0 mi
Show comp detail 7 sales within ~0.75 mi
| Address | Dist | Beds/Ba | Sqft | Sold | Price | $/sf | Match |
|---|---|---|---|---|---|---|---|
| 7382 Clans St | 0.11mi | 2/1.0 | 896 (-2%) | 2mo | $24,900 | $28 | 90 |
| 3461 Alma Dr | 0.03mi | 2/1.0 | 840 (-8%) | 4mo | $44,000 | $52 | 82 |
| 3461 Alma Dr Lot : 110 | 0.03mi | 2/1.0 | 840 (-8%) | 4mo | $44,000 | $52 | 82 |
| 3331 Lassie Dr | 0.12mi | 3/2.0 (+1) | 980 (+7%) | 6mo | $64,000 | $65 | 68 |
| 3331 Lassie Dr Lot : 124 | 0.12mi | 3/2.0 (+1) | 980 (+7%) | 6mo | $64,000 | $65 | 68 |
| 7337 Pipes Cir | 0.11mi | 2/2.0 | 975 (+7%) | 15mo | $22,000 | $23 | 67 |
| 7341 Pipes Cir | 0.13mi | 2/1.0 | 832 (-9%) | 17mo | $39,600 | $48 | 65 |
Match score weights: distance 35% · size 25% · config 20% · recency 20%. Top-matched comps best support the ARV.
Projected returns pro-forma
-3.0% appreciation · 3.0% rent growth · sell at horizon
- IRR
- 39.6%
- Equity multiple
- 2.69×
- Total profit
- $26,329
- Equity at exit
- $8,275
- IRR
- 46.0%
- Equity multiple
- 5.41×
- Total profit
- $68,460
- Equity at exit
- $4,799
Cash invested: $15,540 (down + closing). Projections, not guarantees.
Landlord ↔ Tenant lean methodology
- Overall (STATE)
- 62 Landlord-Friendly
- State Michigan
- 62 Landlord-Friendly · EVEN
- County
- — inherits STATE
- City
- — inherits STATE
ZIP-level market 48801
- Home prices YoY
- -32.0%
- Active inventory
- 89
- Price-to-rent
- 3.9×
Monthly cashflow live
- Estimated rent
- $1,187 medium interval (Pro) →
- Mortgage (P&I)
- −$291
- Tax est. 1.5%
- −$69 /mo · $832/yr
- Insurance
- −$23
- HOA
- −$0
- Vacancy / Maint / Mgmt
- −$249
- Net cashflow
- $554
Break-even live
UW: 25.0% down · 7.5% · 30yr · 1.5% tax · 5.0% vac · 8.0% maint · 8.0% mgmt
Financing live
Cash to close
- Down payment
- $13,875
- Closing costs
- $1,665
- Reserves months
- —
- Total cash needed
- —
Loan-product check · same deal, 3 products live
Conventional
25% down · 7.5% · 30yr
- Down + closing
- —
- Monthly P&I
- —
- Monthly cashflow
- —
- DSCR
- —
- Eligible?
- —
Personal DTI + credit; lowest rate.
DSCR
20% down · 8.5% · 30yr
- Down + closing
- —
- Monthly P&I
- —
- Monthly cashflow
- —
- DSCR
- —
- Eligible?
- —
No personal income docs; deal must DSCR.
Hard money
10% down · 12.0% · 12mo
- Down + closing
- —
- Monthly P&I
- —
- Monthly cashflow
- —
- DSCR
- —
- Eligible?
- —
Short-term bridge; refi at stabilization.
Rent comps 2 comps
| Address | Beds | Baths | Sqft | Rent | $/sqft | DOM | Units | Dist |
|---|---|---|---|---|---|---|---|---|
| 1589 Mary Ct Alma, MI | 3.0 | 1.5 | 1012 | $1,275 | $1.26 | 43d | 1 | 0.44mi |
| 213 W Downie St Unit B Alma, MI | 2.0 | 1.0 | 580 | $800 | $1.38 | 43d | 1 | 1.36mi |
Listing history 6 events
-
2026-06-04days on market $55,500 Active 149 DOM
-
2026-06-02days on market $55,500 Active 148 DOM
-
2026-06-01days on market $55,500 Active 147 DOM
-
2026-05-31days on market $55,500 Active 146 DOM
-
2026-05-31days on market $55,500 Active 145 DOM
-
2026-01-05$55,500 Active 300-char remark
Show marketing remark (300 chars)
Beautiful and clean 1991 single-wide trailer in Scottsdale Estates! This 2-bedroom, 1-bath mobile home rounds out at approximately 914 square feet, and features a sizable primary bedroom and open kitchen and living spaces. Driveway and approach are updated as of 2021. Great space for a great price!!
ⓘ Source: listings_history table (triggers on properties + properties_extension) + one-shot
backfill from property_details.listing_events for pre-trigger history.
Climate risk First Street
- Flood 1/10 Low FEMA zone X (unshaded) · 0% chance over 30 yrs
- Wildfire 1/10 Low
- Heat 2/10 Low 7 d/yr ≥98°F today · 14 d/yr by 30 yrs out
- Wind 1/10 Low
- Air quality 2/10 Low 1 unhealthy d/yr today · 2 by 30 yrs out
Nearby sold comps map
Loading sold comps map…
Walkable amenities ~0.75 mi
Loading nearby amenities…
Taxation est. · year 1
- Rental income
- $14,246
- − Mortgage interest
- −$3,109
- − Property taxes
- −$832
- − Insurance
- −$278
- − Repairs & maintenance
- −$1,140
- − Management
- −$1,140
- − Depreciation
- −$1,615
- Taxable income
- $6,133
- Est. tax owed @ 24.0%
- −$1,472
- After-tax cash flow
- $5,180/yr
For passive investors: Depreciation is non-cash, so a rental often shows a tax loss while cash-flowing — sheltering income. Rental losses are passive: they offset passive income freely, and up to $25,000/yr can offset ordinary (W-2) income if you actively participate and your MAGI is under $100k (phasing out to $0 by $150k); unused losses carry forward. On sale, claimed depreciation is recaptured at up to 25%, and gains may owe capital-gains tax (a 1031 exchange can defer both). Figures are a year-1 estimate at your 24.0% rate — not tax advice; consult a CPA.
Condition & rehab AI · 12 photos
This 1991 single-wide trailer requires moderate repairs and maintenance to improve its condition and value.
Repairs flagged
- Major exterior siding — Significant wear
- Major flooring — Worn carpet
- Major interior walls — Painted walls, some wear
Value-add opportunities
- Both Paint interior walls — Enhances curb appeal and interior aesthetics
- Both Replace worn carpet — Improves comfort and reduces maintenance
- Both Repair exterior siding — Enhances curb appeal and structural integrity
Renovation cost estimate screening
| Repair item | Severity | Est. cost |
|---|---|---|
| exterior siding · Significant wear | Major | $15,000–50,000 |
| flooring · Worn carpet | Major | $15,000–50,000 |
| interior walls · Painted walls, some wear | Major | $15,000–50,000 |
| Total estimated repair cost · 3 items | $45,000–150,000 |
Value-add ROI direction
- Both Paint interior walls — Enhances curb appeal and interior aesthetics ↑
- Both Replace worn carpet — Improves comfort and reduces maintenance ↑
- Both Repair exterior siding — Enhances curb appeal and structural integrity ↑
ⓘ Cost ranges are severity-bucket heuristics (US national rule-of-thumb). Get contractor quotes + a written scope before underwriting a rehab budget.
Schools (NCES district)
- District
- Alma Public Schools
- NCES district ID
- 2602640
- Math proficiency
- 28% ▼ -9.00%
- Reading proficiency
- 44% ▼ -3.00%
- Median HH income
- $36,651
- Composite
- 29.84/100
- National rank
- #6415
- State rank
- #288 of 540 in MI
Livability — Pine River
No livability data for this city. (Only ~50 U.S. cities are tracked.)
Census & demographics
- Population (ZIP)
- 13,433
Population outlook (Gratiot County) Hauer SSP2
- Today (2025)
- 39,991 people
- By 2030
- 38,944 · -2.6%
- By 2040
- 36,694 · -8.2%
- By 2050
- 34,314 · -14.2%
- By 2075
- 27,693 · -30.8%
- By 2100
- 20,809 · -48.0%
Race, ethnicity, and origin ACS 2023
- Neighborhood character
- Predominantly White (85%)
- Race & ethnicity
- White 85% Hispanic / Latino 10% Two or more races 4% Black 2% Asian 1%
- Hispanic origin (detail)
- Mexican 8%
- Common ancestry
- Romanian 5% Slovak 3% Iranian 2%
- Foreign-born
- 2% · Canada, South Korea
- Languages at home
- 94% English-only · Spanish 4% French/Haitian/Cajun 1%
Political lean MEDSL · Gratiot
- 2024 margin
- Solid R (+31.3) · D 33.7% · R 65.0% · Other 1.4%
- 2008→2024 swing
- -35.7pp toward R · 2008: 4.4pp · 2024: -31.3pp
- All cycles
- 2024: R+31.3 2020: R+28.3 2016: R+25.6 2012: R+3.9 2008: D+4.4
Not yet ingested
- Civics
- —
Market trends
- HPI YoY
- ▼ -99.16%
- Current HPI
- 210.3208
- Rent YoY
- —
- Metro
- —
- State GDP YoY
- ▲ 1.37%
- F500 in state
- 28
Industry mix (Fortune 500 HQ in MI)
| Industry | F500 HQs | Revenue |
|---|---|---|
| Automotive Parts | 3 | $48B |
|
||
| Automotive | 2 | $372B |
|
||
| Chemicals | 1 | $45B |
|
||
| Automotive Retail | 1 | $29B |
|
||
| Healthcare / Medical Devices | 1 | $23B |
|
||
| Automotive Technology | 1 | $20B |
|
||
Price history
1 event — show timeline
- 2026-01-05 Listed $55,500 MiRealSource-MiMLS
Cash-flow waterfall
monthlySold comps — $/sqft
last 12 mo · ≤1 miLoading sold comps…