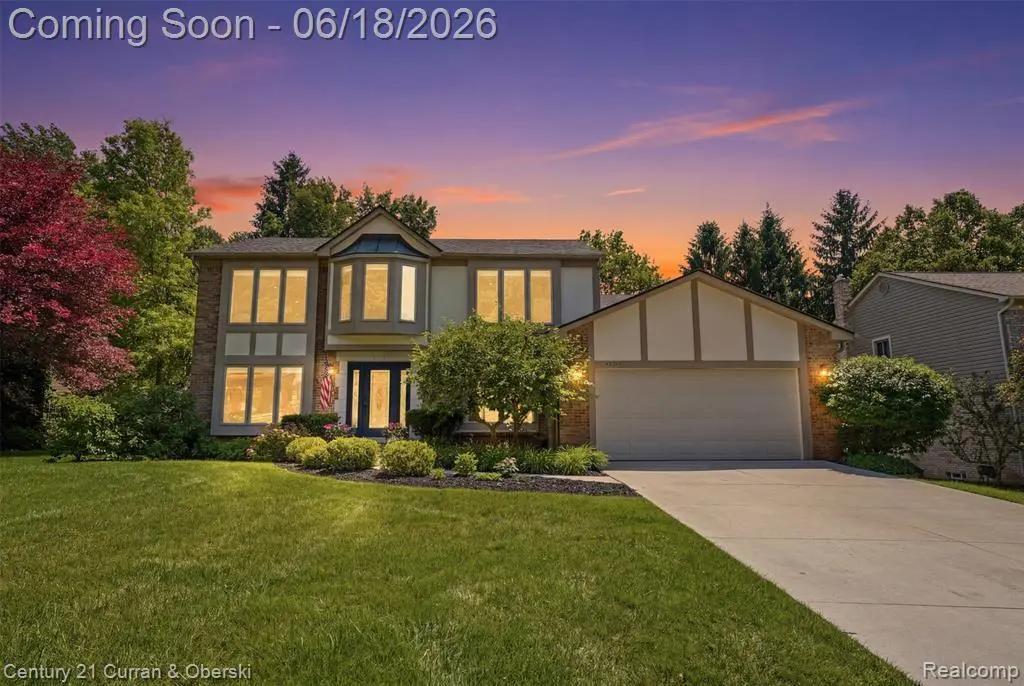
42149 Crestview Cir · Northville, MI
Flood risk 1/10 · Minimal
- FEMA flood zone
- X (unshaded)
- Chance of flooding over 30 yrs
- 0.0%
- Est. flood insurance / yr
- $473 – $860
Fire risk 1/10 · Minimal
- Est. fire insurance / yr
- $784 – $1,456
Heat risk 3/10 · Minor
- Hot days now (above 97°F)
- 7 days/yr
- Hot days in 30 yrs
- 15 days/yr
Wind risk 2/10 · Minimal
- Chance of severe wind over 30 yrs
- —
Air-quality risk 3/10 · Minor
- Unhealthy air days now
- 2 days/yr
- Unhealthy air days in 30 yrs
- 3 days/yr
Risk factors via First Street. Map © Google.
Why this score? — see what drove the D- grade
The composite is a weighted blend of 9 inputs, each scored 0–100. Each bar is that input's sub-score; the figure is the points it added to the 100-point composite (weight × sub-score).
- Cash flow +12.7/30.0
- Schools +6.6/10.0
- Livability +4.4/5.0
- DSCR +3.8/10.0
- 1% rule +3.2/10.0
- Rent growth +2.5/5.0
- Condition / age +2.5/5.0
- ARV discount +0.0/15.0
- Appreciation +0.0/10.0
$825,000
🖨 Deal sheet (PDF) 📄 Offer letter ✓ Due diligence
Listing remarks MLS
Multiple Offers! Beautiful Lakes of Northville Sub updated 4 Bdrm/2.5 baths; Custom island kitchen w/ stainless appliances & granite counters overlooking large family room, formal L/R & D/R, private lib w/ French drs; Large deck overlooking yard w/ mature trees; Premium lot on quiet street. Updated baths, floors, water heater; Newer siding & windows; Whole house painted in 2013. Bay windows; Home is well maintained. Sub has common walking paths to lakes. Northville Schools. Minutes to historic downtown Northville & Plymouth. All M & D approximate.
Key facts
- Spa-inspired baths
- Renovated mud room
- Designer office
Tags
Property features AI
Finance
- HOA & community: Homeowners association with yearly fee of $210
Exterior
- Parking: Attached garage with electric and automatic garage door; 2-car garage
- Utilities: Public water; Natural gas service; Gas water heater; Electric cooling (central A/C) and ceiling fans
- Home design: Residential 2-story home built in 1984; Entry-level kitchen and laundry
- Construction: Brick construction; Basement foundation; Year built: 1984
- Exterior features: Brick exterior; Deck and porch; Finished basement
Interior
- Kitchen: Kitchen on the entry level (19 x 17) with wood flooring; Includes dishwasher, disposal, microwave, range/oven, and refrigerator
- Bedrooms: Four bedrooms on the second floor with wood floors; Fifth bedroom in the finished basement (11 x 14) with wood flooring noted for upper bedrooms
- Flooring: Wood flooring in bedrooms and kitchen; Ceramic flooring in bathrooms and laundry
- Bathrooms: Three full bathrooms and one lavatory (4 total); Basement bath with ceramic flooring; Two second-floor bathrooms with ceramic flooring
- Heating & cooling: Forced air heating; Central air conditioning and ceiling fans; Gas water heater; natural gas heat/fuel
- Interior features: Fireplace in the living room and a finished basement fireplace; Total of 12 rooms
- Laundry & utility: Laundry on the entry level (7 x 6) with ceramic flooring; Washer and dryer included
Neighborhood map
What this means for you Summary
Snapshot
- This is a 5-bed/3.5-bath single-family listed at $825k.
Deal economics
- At list price, monthly cash flow is $-91 ($-1k/yr) — negative.
- To cash-flow at today's rent, offer at most $809k (1.9% below list).
- To meet the 1% rule (rent ≥ 1% of price), the offer needs to be $674k (18.3% below list).
- Recommended offer: $674k (18.3% below list) — sets the bar for 1% rule.
- Cap rate 6.2% vs local median 1.8% in Northville — top-decile yield for the area; either an underpriced asset or a hidden risk that comps aren't pricing in. Stress-test before assuming the spread holds.
Location & tenants
- Location reads 88/100 on livability (#13 in MI, #205 nationally) — a professional / high-income tenant draw. Strengths: crime A+, amenities A+, employment A+; Watch: commute F.
- Northville Public Schools (suburban): math 68% / reading 75% proficiency, ranked #4 of 540 in MI (top 1%) — strong family-tenant draw, lease renewals of 3-5y typical; only 4% free/reduced lunch — higher-income household profile.
- Zoned schools: Winchester Elementary School (math 67% / reading 72%, grade A-, #74 of 1,397 statewide, top 7%, 476 students, 6% FRL); Meads Mill Middle School (math 65% / reading 74%, grade A, #28 of 493 statewide, top 6%, 671 students, 9% FRL); Northville High School (math 68% / reading 86%, grade A-, #11 of 713 statewide, top 2%, 2,499 students, 7% FRL) — zoned schools at 7% FRL track the district average.
- Market conditions: 146 active listings in the ZIP; 2 comparable units currently listed for rent nearby; 2,639 units permitted in Wayne County in 2024 (1,216 in 5+ unit buildings).
Forward outlook
- Local home prices are declining (-3.0%/yr); year-one equity from $6k of loan paydown is wiped out by about $25k of value loss. Plan a longer hold.
- Wayne County population projected at -17% by 2050 — secular population decline; favor cash flow + early exit over multi-decade hold.
Negotiation context
- Only 3 days on market — expect competitive offers; lowballing is unlikely to land.
- 4 sale attempts since 14y ago; this cycle's ask is 110% above the opening price — seller raised mid-cycle; expect resistance to lowballs.
- Current owner paid $411k; list at $825k implies a 101% gain — meaningful room to come down on a strong offer.
Questions for the listing agent
- What do current leases actually rent for vs. the listed asking? Can we see a recent rent roll and the last 12 months of T-12 income?
- What does the HOA fee cover, when was the last increase, and are there any pending special assessments or reserve-fund shortfalls?
- Is there a deadline driving the sale (1031 exchange, divorce, estate, relocation)? That informs how much negotiation room exists.
- Schools are A-rated — typically a magnet for longer-tenancy family renters. What's the average tenant stay here, and is there a school-zone premium baked into asking?
- The area grade is low — what's the realistic commute time and amenity access for the typical tenant pool here? Any planned neighborhood developments (good or bad) we should know about?
- What's the average days-on-market for RENTAL listings here right now (not sales)? A rising rental-DOM trend means longer vacancies and softer asking-rent achievability than the comps imply.
- What's the recent tenant-quality profile in this submarket — average credit score on applications, eviction rate, late-payment / NSF rate, and stable-employment percentage? A property-management company in the area should have these aggregated.
- How much new for-sale + rental construction is in the pipeline within 1–3 miles? Heavy new supply typically softens prices + rents 12–24 months out; constrained supply supports both.
Investment metrics
- 1% rule
- 0.82% ✗
- Cap rate
- 6.16%
- Cash-on-cash
- -0.47%
- DSCR
- 0.98
- GRM
- 10.2
CMA / ARV
- ARV (on-the-fly)
- $618,340
- Comps found
- 12
Show comp detail 12 sales within ~0.75 mi
| Address | Dist | Beds/Ba | Sqft | Sold | Price | $/sf | Match |
|---|---|---|---|---|---|---|---|
| 42505 Bradner Rd | 0.26mi | 4/2.5 (-1) | 2,922 (+2%) | 0mo | $650,000 | $222 | 76 |
| 41973 Waterwheel Rd | 0.23mi | 4/2.5 (-1) | 2,928 (+2%) | 8mo | $585,000 | $200 | 70 |
| 42491 Bradner Rd | 0.27mi | 4/3.5 (-1) | 2,731 (-5%) | 5mo | $600,000 | $220 | 70 |
| 41925 Waterwheel Rd | 0.23mi | 4/2.5 (-1) | 2,710 (-6%) | 9mo | $547,500 | $202 | 63 |
| 18080 Winchester Dr | 0.20mi | 4/2.5 (-1) | 3,074 (+7%) | 13mo | $680,000 | $221 | 59 |
| 17610 Farmcrest Ln | 0.43mi | 4/3.0 (-1) | 3,032 (+5%) | 10mo | $500,000 | $165 | 56 |
| 42331 Beacontree Ct | 0.44mi | 4/2.5 (-1) | 2,750 (-4%) | 10mo | $590,000 | $215 | 55 |
| 41862 Baintree Cir | 0.52mi | 4/2.5 (-1) | 3,176 (+10%) | 1mo | $550,000 | $173 | 49 |
| 17022 Winchester Dr | 0.55mi | 4/2.5 (-1) | 3,018 (+5%) | 12mo | $500,000 | $166 | 47 |
| 16548 Winchester Dr | 0.67mi | 4/2.5 (-1) | 2,851 (-1%) | 15mo | $631,826 | $222 | 46 |
| 42117 Banbury Rd | 0.51mi | 4/2.5 (-1) | 2,563 (-11%) | 10mo | $590,000 | $230 | 41 |
| 16772 Dundalk Ct | 0.65mi | 4/2.5 (-1) | 3,058 (+6%) | 11mo | $650,000 | $213 | 40 |
Match score weights: distance 35% · size 25% · config 20% · recency 20%. Top-matched comps best support the ARV.
Projected returns pro-forma
-3.0% appreciation · 3.0% rent growth · sell at horizon
- IRR
- -17.1%
- Equity multiple
- 0.40×
- Total profit
- $-139,555
- Equity at exit
- $123,010
- IRR
- -9.0%
- Equity multiple
- 0.44×
- Total profit
- $-129,288
- Equity at exit
- $71,331
Cash invested: $231,000 (down + closing). Projections, not guarantees.
Landlord ↔ Tenant lean methodology
- Overall (STATE)
- 62 Landlord-Friendly
- State Michigan
- 62 Landlord-Friendly · EVEN
- County
- — inherits STATE
- City
- — inherits STATE
ZIP-level market 48168
- Active inventory
- 146
- Price-to-rent
- 10.2×
Monthly cashflow live
- Estimated rent
- $6,738 medium interval (Pro) →
- Mortgage (P&I)
- −$4,326
- Tax from tax record
- −$726 /mo · $8,714/yr
- Insurance
- −$344
- HOA
- −$18
- Vacancy / Maint / Mgmt
- −$1,415
- Net cashflow
- $-91
Break-even live
Sensitivity live
| Price | -10% $376 | -5% $143 | +0% $-91 | +5% $-324 | +10% $-558 |
|---|---|---|---|---|---|
| Rent | -10% $-623 | -5% $-357 | +0% $-91 | +5% $175 | +10% $441 |
| Rate | -1.0pp $324 | -0.5pp $119 | base $-91 | +0.5pp $-305 | +1.0pp $-522 |
UW: 25.0% down · 7.5% · 30yr · 1.5% tax · 5.0% vac · 8.0% maint · 8.0% mgmt
Financing live
Cash to close
- Down payment
- $206,250
- Closing costs
- $24,750
- Reserves months
- —
- Total cash needed
- —
Loan-product check · same deal, 3 products live
Conventional
25% down · 7.5% · 30yr
- Down + closing
- —
- Monthly P&I
- —
- Monthly cashflow
- —
- DSCR
- —
- Eligible?
- —
Personal DTI + credit; lowest rate.
DSCR
20% down · 8.5% · 30yr
- Down + closing
- —
- Monthly P&I
- —
- Monthly cashflow
- —
- DSCR
- —
- Eligible?
- —
No personal income docs; deal must DSCR.
Hard money
10% down · 12.0% · 12mo
- Down + closing
- —
- Monthly P&I
- —
- Monthly cashflow
- —
- DSCR
- —
- Eligible?
- —
Short-term bridge; refi at stabilization.
Rent comps 2 comps
| Address | Beds | Baths | Sqft | Rent | $/sqft | DOM | Units | Dist |
|---|---|---|---|---|---|---|---|---|
| 42021 Banbury Ct Northville, MI | 5.0 | 3.0 | 2600 | $3,503 | $1.35 | 0d | 1 | 0.53mi |
| 16646 Brooklane Blvd Northville, MI | 4.0 | 4.5 | 3282 | $13,300 | $4.05 | 18d | 1 | 1.04mi |
HOA detail
- Monthly dues
- $18 · $216/yr
- Likely covers
- water
Listing history 4 events
-
2026-06-21statusdays on market $825,000 Pending 3 DOM
-
2026-06-18status $825,000 Active 1 DOM
-
2026-06-17remarks 699-char remark
-
2026-06-17$825,000 Coming Soon 1 DOM
ⓘ Source: listings_history table (triggers on properties + properties_extension) + one-shot
backfill from property_details.listing_events for pre-trigger history.
Tax reassessment forecast MI · Partial reset (capped growth)
- Current annual tax
- $8,714 · $726/mo
- Projected year-2 tax
- $10,709 · $892/mo
- Expected delta
- +$1,996/yr (+$166/mo · 22.9%)
ⓘ Screening estimate from a state-policy table — verify with the county assessor before closing.
Climate risk First Street
- Flood 1/10 Low FEMA zone X (unshaded) · 0% chance over 30 yrs
- Wildfire 1/10 Low
- Heat 3/10 Moderate 7 d/yr ≥97°F today · 15 d/yr by 30 yrs out
- Wind 2/10 Low
- Air quality 3/10 Moderate 2 unhealthy d/yr today · 3 by 30 yrs out
Nearby sold comps map
Loading sold comps map…
Walkable amenities ~0.75 mi
Loading nearby amenities…
Taxation est. · year 1
- Rental income
- $80,860
- − Mortgage interest
- −$46,213
- − Property taxes
- −$8,714
- − Insurance
- −$4,125
- − Repairs & maintenance
- −$6,469
- − Management
- −$6,469
- − HOA
- −$216
- − Depreciation
- −$24,000
- Taxable loss
- −$15,345
- Est. tax savings @ 24.0%
- +$3,683
- After-tax cash flow
- $2,591/yr
For passive investors: Depreciation is non-cash, so a rental often shows a tax loss while cash-flowing — sheltering income. Rental losses are passive: they offset passive income freely, and up to $25,000/yr can offset ordinary (W-2) income if you actively participate and your MAGI is under $100k (phasing out to $0 by $150k); unused losses carry forward. On sale, claimed depreciation is recaptured at up to 25%, and gains may owe capital-gains tax (a 1031 exchange can defer both). Figures are a year-1 estimate at your 24.0% rate — not tax advice; consult a CPA.
Schools (NCES district)
- District
- Northville Public Schools
- NCES district ID
- 2625980
- Math proficiency
- 68% ▼ -5.00%
- Reading proficiency
- 75% ▼ -4.00%
- Median HH income
- $108,824
- Composite
- 66.21/100
- National rank
- #431
- State rank
- #4 of 540 in MI
Livability — Northville
- Score
- 88/100
- State rank
- #13
- US rank
- #205
Category grades
Schools grade is shown separately in the Schools card above.
Census & demographics
- City population
- 24,713
- Population (ZIP)
- 25,039
Population outlook (Wayne County) Hauer SSP2
- Today (2025)
- 1,675,273 people
- By 2030
- 1,620,300 · -3.3%
- By 2040
- 1,502,341 · -10.3%
- By 2050
- 1,384,039 · -17.4%
- By 2075
- 1,124,592 · -32.9%
- By 2100
- 881,193 · -47.4%
Race, ethnicity, and origin ACS 2023
- Neighborhood character
- Predominantly White (72%)
- Race & ethnicity
- White 72% Asian 19% Two or more races 5% Hispanic / Latino 4% Black 2%
- Common ancestry
- Romanian 9% Italian 3% Lithuanian 3%
- Foreign-born
- 20% · Canada, China, Jamaica
- Languages at home
- 77% English-only · Other Indo-European 7% Other Asian/Pacific 5% Chinese 3%
Political lean MEDSL · Wayne
- 2024 margin
- Strong D (+29.0) · D 62.7% · R 33.7% · Other 3.6%
- 2008→2024 swing
- -20.5pp toward R · 2008: 49.5pp · 2024: 29.0pp
- All cycles
- 2024: D+29.0 2020: D+38.1 2016: D+37.3 2012: D+46.9 2008: D+49.5
Not yet ingested
- Civics
- —
Market trends
- HPI YoY
- ▼ -198.06%
- Current HPI
- 176.9122
- Rent YoY
- —
- Metro
- —
- State GDP YoY
- ▲ 1.37%
- F500 in state
- 28
Industry mix (Fortune 500 HQ in MI)
| Industry | F500 HQs | Revenue |
|---|---|---|
| Automotive Parts | 3 | $48B |
|
||
| Automotive | 2 | $372B |
|
||
| Chemicals | 1 | $45B |
|
||
| Automotive Retail | 1 | $29B |
|
||
| Healthcare / Medical Devices | 1 | $23B |
|
||
| Automotive Technology | 1 | $20B |
|
||
Price history
+175.9% since first listed14 events — show timeline
- 2026-06-16 Coming Soon $825,000 MiRealSource-MiMLS
- 2017-06-13 Sold (Public Records) $411,000 Public Records
- 2017-05-31 Sold (MLS) $411,000 MiRealSource-MiMLS
- 2017-05-31 Sold (MLS) $411,000 REALCOMP
- 2017-05-01 Pending — MiRealSource-MiMLS
- 2017-05-01 Pending — REALCOMP
- 2017-04-27 Listed $392,000 MiRealSource-MiMLS
- 2017-04-27 Listed $392,000 REALCOMP
- 2012-08-31 Sold (Public Records) $305,500 Public Records
- 2012-08-08 Sold (MLS) $305,500 MiRealSource-MiMLS
- 2012-08-08 Sold (MLS) $305,500 REALCOMP
- 2012-07-30 Listing Removed — MiRealSource-MiMLS
- 2012-06-22 Listed $299,000 MiRealSource-MiMLS
- 2012-06-22 Listed $299,000 REALCOMP
Property tax history
+4.7%/yrLatest (2025): $8,714 · -0.4% YoY. Source: county tax records.
Cash-flow waterfall
monthlySold comps — $/sqft
last 12 mo · ≤1 miLoading sold comps…