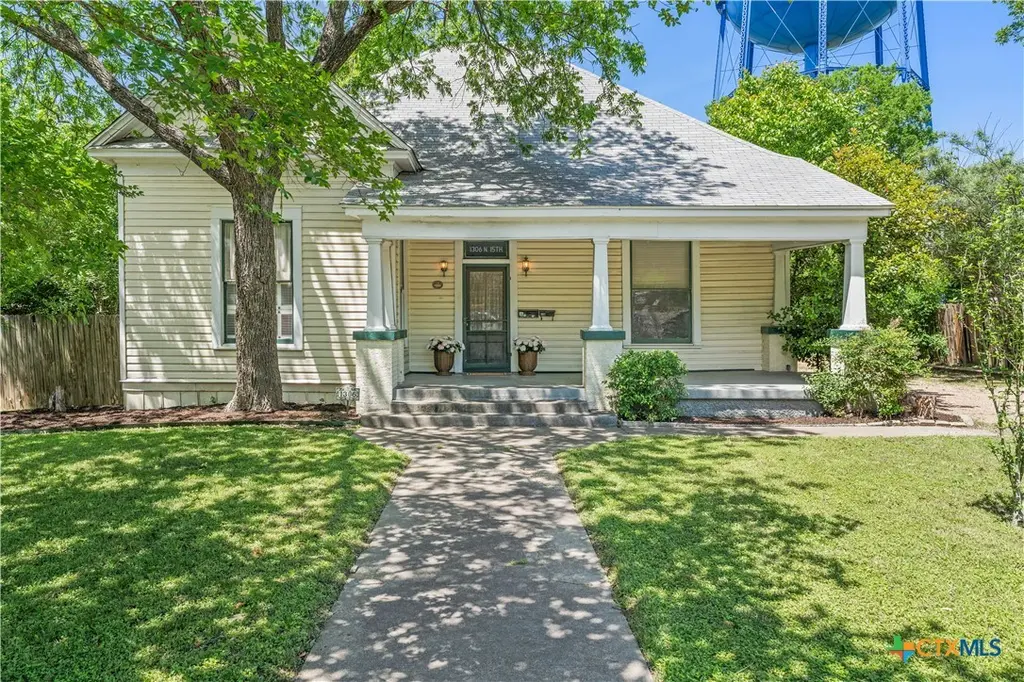
1306 N 15th St · Temple, TX
Flood risk 1/10 · Minimal
- FEMA flood zone
- X (unshaded)
- Chance of flooding over 30 yrs
- 0.0%
- Est. flood insurance / yr
- $507 – $1,088
Fire risk 4/10 · Minor
- Est. fire insurance / yr
- $1,222 – $2,270
Heat risk 7/10 · Major
- Hot days now (above 108°F)
- 7 days/yr
- Hot days in 30 yrs
- 24 days/yr
Wind risk 6/10 · Moderate
- Chance of severe wind over 30 yrs
- 77.0%
Air-quality risk 1/10 · Minimal
- Unhealthy air days now
- 0 days/yr
- Unhealthy air days in 30 yrs
- 0 days/yr
Risk factors via First Street. Map © Google.
Why this score? — see what drove the D grade
The composite is a weighted blend of 9 inputs, each scored 0–100. Each bar is that input's sub-score; the figure is the points it added to the 100-point composite (weight × sub-score).
- ARV discount +15.0/15.0
- Cash flow +10.6/30.0
- Livability +3.8/5.0
- 1% rule +3.6/10.0
- Rent growth +3.4/5.0
- DSCR +3.0/10.0
- Schools +2.7/10.0
- Condition / age +2.5/5.0
- Appreciation +0.0/10.0
$210,000
🖨 Deal sheet (PDF) 📄 Offer letter ✓ Due diligence
Listing remarks
Located in the heart of North Temple, this property features a 2,028+/- square-foot home plus a 483+/- square-foot efficiency apartment and shop/storage space, all with direct access to Optimist Park from the backyard. The main residence provides a spacious layout highlighted by timeless hardwood floors and a screened-in back porch. The detached structure offers a 1-car garage and generous storage/workshop area on the first story, with a garage apartment on the second. Equipped with a kitchen, bathroom, and closet, this addition presents a unique opportunity for guests, multi-generational living, rental income, or a private workspace. Situated in an ideal location, instant park access throu
Key facts
- Detached structure
- Instant park access
- Garage apartment
Tags
Property features AI
Exterior
- Parking: Detached garage with garage door opener (1 car)
- Utilities: Cable available; Electricity available; Natural gas available; Public water; Public sewer
- Home design: Single-story; Resale property
- Construction: Wood siding; Composition/shingle roof; Pillar/post/pier foundation; Built (year per assessor)
- Exterior features: Enclosed porch; Porch (screened); Back yard with wood fencing; City lot on an asphalt city street; Less than quarter acre
Interior
- Kitchen: Dishwasher; Disposal; Gas range; Range; Refrigerator
- Flooring: Carpet; Vinyl; Wood
- Bathrooms: 2 full bathrooms
- Heating & cooling: Central heating (natural gas); Central electric air conditioning
- Interior features: Ceiling fans; Dining area and separate/formal dining room; Breakfast area; Pantry; Laminate counters; Soaking tub; Separate shower; Vanity; Walk-in closet(s); See remarks
- Laundry & utility: Washer hookup inside (laundry closet); Electric dryer hookup; Washer; Dryer; Gas water heater
Neighborhood map
What this means for you Summary
Snapshot
- This is a 3-bed/2.0-bath single-family listed at $210k.
Deal economics
- At list price, monthly cash flow is $-105 ($-1k/yr) — negative.
- To cash-flow at today's rent, offer at most $191k (8.8% below list).
- To meet the 1% rule (rent ≥ 1% of price), the offer needs to be $181k (14.0% below list).
- Recommended offer: $181k (14.0% below list) — sets the bar for 1% rule.
- Cap rate 5.7% vs local median 3.6% in Temple — top-decile yield for the area; either an underpriced asset or a hidden risk that comps aren't pricing in. Stress-test before assuming the spread holds.
Location & tenants
- Location reads 75/100 on livability (#122 in TX, #3,814 nationally) — a middle-class / working-renter tenant base. Strengths: cost of living A+, housing A+, health & safety A+; Watch: schools C-, commute C-, crime D+.
- Temple ISD (urban): math 32% / reading 31% proficiency, ranked #590 of 826 in TX (top 71%) — families likely to look elsewhere, expect single-tenant / working-renter base with shorter leases; 66% free/reduced lunch — lower-income household profile, screen leases tightly.
- Market conditions: Rents rising (+3.4%/yr); 337 active listings in the ZIP; 4 comparable units currently listed for rent nearby; rentals lingering (median 46d on market — plan ~5-8 weeks vacancy on turnover, expect pricing pressure); 50% of comp listings sitting > 30 days — soft ceiling on asking rent; 3,222 units permitted in Bell County in 2024 (246 in 5+ unit buildings).
- This rent runs 35% of the median local income ($63k/yr) — at the standard rent-burdened threshold; future hikes will face affordability resistance.
Forward outlook
- Local home prices are declining (-3.0%/yr); year-one equity from $1k of loan paydown is wiped out by about $6k of value loss. Plan a longer hold.
- Bell County population projected at +21% by 2050 — long-run rental-demand tailwind backs the buy-and-hold thesis.
Negotiation context
- It's been on market 49 days — a 3% lower offer ($204k) is reasonable based on typical stale-listing flexibility.
- 2 sale attempts with the ask held roughly flat each time — persistent listings suggest the price (not the market) is what's stuck; bring a comps-based counter.
Risks & watch-outs
- Watch-outs: built in 1935 — expect roof / HVAC / electrical / plumbing capex.
- Climate carrying-cost: major wind risk, 77% chance of damaging wind over 30y; extreme-heat days projected 7→24/yr by 2055 (HVAC capex compounding) — expect insurance premiums to compound above CPI over the hold.
Questions for the listing agent
- What do current leases actually rent for vs. the listed asking? Can we see a recent rent roll and the last 12 months of T-12 income?
- It's been on market 49 days. Have you received any prior offers? Is the seller open to a 14% concession, seller financing, or rate buy-down credit?
- Built in 1935 — when were the roof, HVAC, electrical panel, plumbing, and water heater last replaced?
- Is there a deadline driving the sale (1031 exchange, divorce, estate, relocation)? That informs how much negotiation room exists.
- Crime grade is D in this area — have there been break-ins, vandalism, or insurance claims at this property in the last 3 years? What carrier currently insures it and at what premium?
- The area grade is low — what's the realistic commute time and amenity access for the typical tenant pool here? Any planned neighborhood developments (good or bad) we should know about?
- What's the average days-on-market for RENTAL listings here right now (not sales)? A rising rental-DOM trend means longer vacancies and softer asking-rent achievability than the comps imply.
- What's the recent tenant-quality profile in this submarket — average credit score on applications, eviction rate, late-payment / NSF rate, and stable-employment percentage? A property-management company in the area should have these aggregated.
- How much new for-sale + rental construction is in the pipeline within 1–3 miles? Heavy new supply typically softens prices + rents 12–24 months out; constrained supply supports both.
Investment metrics
- 1% rule
- 0.86% ✗
- Cap rate
- 5.69%
- Cash-on-cash
- -2.15%
- DSCR
- 0.90
- GRM
- 9.7
CMA / ARV
- ARV (median comp)
- $261,710
- List price
- $210,000
- Delta
- -19.76%
- Verdict
- UNDERPRICED
- Comps
- 20 within 1.0 mi
Show comp detail 6 sales within ~0.75 mi
| Address | Dist | Beds/Ba | Sqft | Sold | Price | $/sf | Match |
|---|---|---|---|---|---|---|---|
| 1308 N 13th St | 0.06mi | 3/2.0 | 2,409 (-9%) | 12mo | $389,900 | $162 | 72 |
| 510 W Royal Ave | 0.35mi | 3/2.0 | 2,739 (+3%) | 7mo | $325,000 | $119 | 72 |
| 504 W Park Ave | 0.28mi | 3/2.0 | 2,362 (-11%) | 4mo | $150,000 | $64 | 66 |
| 902 N 1st St | 0.52mi | 4/2.0 (+1) | 2,522 (-5%) | 0mo | $147,000 | $58 | 62 |
| 2306 N 13th St | 0.61mi | 3/2.0 | 2,810 (+6%) | 2mo | $265,000 | $94 | 60 |
| 505 N 7th St | 0.64mi | 4/3.0 (+1) | 2,392 (-10%) | 7mo | $379,000 | $158 | 39 |
Match score weights: distance 35% · size 25% · config 20% · recency 20%. Top-matched comps best support the ARV.
Projected returns pro-forma
-3.0% appreciation · 3.44% rent growth · sell at horizon
- IRR
- -19.3%
- Equity multiple
- 0.32×
- Total profit
- $-39,847
- Equity at exit
- $31,312
- IRR
- -11.0%
- Equity multiple
- 0.33×
- Total profit
- $-39,689
- Equity at exit
- $18,157
Cash invested: $58,800 (down + closing). Projections, not guarantees.
Landlord ↔ Tenant lean methodology
- Overall (STATE)
- 87 Strongly Landlord-Friendly
- State Texas
- 87 Strongly Landlord-Friendly · R+5
- County
- — inherits STATE
- City
- — inherits STATE
ZIP-level market 76501
- Rents YoY
- 3.4%
- Active inventory
- 337
- Price-to-rent
- 9.7×
Monthly cashflow live
- Estimated rent
- $1,805 medium interval (Pro) →
- Mortgage (P&I)
- −$1,101
- Tax from tax record
- −$343 /mo · $4,111/yr
- Insurance
- −$88
- HOA
- −$0
- Vacancy / Maint / Mgmt
- −$379
- Net cashflow
- $-105
Break-even live
Sensitivity live
| Price | -10% $14 | -5% $-46 | +0% $-105 | +5% $-165 | +10% $-224 |
|---|---|---|---|---|---|
| Rent | -10% $-248 | -5% $-176 | +0% $-105 | +5% $-34 | +10% $37 |
| Rate | -1.0pp $1 | -0.5pp $-52 | base $-105 | +0.5pp $-160 | +1.0pp $-215 |
UW: 25.0% down · 7.5% · 30yr · 1.5% tax · 5.0% vac · 8.0% maint · 8.0% mgmt
Financing live
Cash to close
- Down payment
- $52,500
- Closing costs
- $6,300
- Reserves months
- —
- Total cash needed
- —
Loan-product check · same deal, 3 products live
Conventional
25% down · 7.5% · 30yr
- Down + closing
- —
- Monthly P&I
- —
- Monthly cashflow
- —
- DSCR
- —
- Eligible?
- —
Personal DTI + credit; lowest rate.
DSCR
20% down · 8.5% · 30yr
- Down + closing
- —
- Monthly P&I
- —
- Monthly cashflow
- —
- DSCR
- —
- Eligible?
- —
No personal income docs; deal must DSCR.
Hard money
10% down · 12.0% · 12mo
- Down + closing
- —
- Monthly P&I
- —
- Monthly cashflow
- —
- DSCR
- —
- Eligible?
- —
Short-term bridge; refi at stabilization.
Rent comps 4 comps
| Address | Beds | Baths | Sqft | Rent | $/sqft | DOM | Units | Dist |
|---|---|---|---|---|---|---|---|---|
| 917 Crockett Ct Temple, TX | 3.0 | 2.0 | 1917 | $1,550 | $0.81 | 15d | 1 | 0.46mi |
| 1919 N 7th St Temple, TX | 3.0 | 3.0 | 2000 | $1,975 | $0.99 | 45d | 1 | 0.47mi |
| 2305 N 15th St Temple, TX | 3.0 | 2.0 | 2122 | $2,000 | $0.94 | 45d | 1 | 0.58mi |
| 2408 N 15th St Temple, TX | 3.0 | 2.0 | 1832 | $1,650 | $0.90 | 15d | 1 | 0.65mi |
Listing history 14 events
-
2026-06-14status $210,000 Pending 49 DOM
-
2026-06-10days on market $210,000 Active Under Contract 49 DOM
-
2026-06-09days on market $210,000 Active Under Contract 48 DOM
-
2026-06-08days on market $210,000 Active Under Contract 47 DOM
-
2026-06-07days on market $210,000 Active Under Contract 46 DOM
-
2026-06-03days on market $210,000 Active Under Contract 42 DOM
-
2026-06-02days on market $210,000 Active Under Contract 41 DOM
-
2026-06-01days on market $210,000 Active Under Contract 40 DOM
-
2026-05-31days on market $210,000 Active Under Contract 39 DOM
-
2026-05-30days on market $210,000 Active Under Contract 38 DOM
-
2026-05-05status Active 925-char remark
-
2026-04-27historical Active Under Contract 925-char remark
-
2026-04-22$210,000 Active 925-char remark
-
2001-04-11soldstatus
ⓘ Source: listings_history table (triggers on properties + properties_extension) + one-shot
backfill from property_details.listing_events for pre-trigger history.
Tax reassessment forecast TX · Resets to sale price
- Current annual tax
- $4,111 · $343/mo
- Projected year-2 tax
- $4,111 · $343/mo
- Expected delta
- $0/yr ($0/mo · 0.0%)
ⓘ Screening estimate from a state-policy table — verify with the county assessor before closing.
Climate risk First Street
- Flood 1/10 Low FEMA zone X (unshaded) · 0% chance over 30 yrs
- Wildfire 4/10 Moderate
- Heat 7/10 Severe 7 d/yr ≥108°F today · 24 d/yr by 30 yrs out
- Wind 6/10 Major 77% chance of damaging wind over 30 yrs
- Air quality 1/10 Low 0 unhealthy d/yr today · 0 by 30 yrs out
Nearby sold comps map
Loading sold comps map…
Walkable amenities ~0.75 mi
Loading nearby amenities…
Taxation est. · year 1
- Rental income
- $21,663
- − Mortgage interest
- −$11,763
- − Property taxes
- −$4,111
- − Insurance
- −$1,050
- − Repairs & maintenance
- −$1,733
- − Management
- −$1,733
- − Depreciation
- −$6,109
- Taxable loss
- −$4,836
- Est. tax savings @ 24.0%
- +$1,161
- After-tax cash flow
- $-101/yr
For passive investors: Depreciation is non-cash, so a rental often shows a tax loss while cash-flowing — sheltering income. Rental losses are passive: they offset passive income freely, and up to $25,000/yr can offset ordinary (W-2) income if you actively participate and your MAGI is under $100k (phasing out to $0 by $150k); unused losses carry forward. On sale, claimed depreciation is recaptured at up to 25%, and gains may owe capital-gains tax (a 1031 exchange can defer both). Figures are a year-1 estimate at your 24.0% rate — not tax advice; consult a CPA.
Schools (NCES district)
- District
- Temple ISD
- NCES district ID
- 4842330
- Math proficiency
- 32% ▼ -8.00%
- Reading proficiency
- 31% ▼ -4.00%
- Median HH income
- $43,120
- Composite
- 26.8/100
- National rank
- #7123
- State rank
- #590 of 826 in TX
Livability — Temple
- Score
- 75/100
- State rank
- #122
- US rank
- #3814
Category grades
Schools grade is shown separately in the Schools card above.
Census & demographics
- Census place
- Temple, TX
- County
- Bell County · 345,090 people
- City population
- 96,587
- Metro
- Killeen-Temple, TX
- Population (ZIP)
- 17,752
- Household income
- $62,532
- Rent vs Own
- Severe rent burden
- 466.0
Population outlook (Bell County) Hauer SSP2
- Today (2025)
- 371,114 people
- By 2030
- 389,104 · +4.8%
- By 2040
- 420,592 · +13.3%
- By 2050
- 447,779 · +20.7%
- By 2075
- 499,130 · +34.5%
- By 2100
- 505,680 · +36.3%
Race, ethnicity, and origin ACS 2023
- Neighborhood character
- Diverse neighborhood (Simpson 0.67)
- Race & ethnicity
- White 42% Hispanic / Latino 36% Two or more races 18% Black 17% Native American 2%
- Hispanic origin (detail)
- Mexican 31% Puerto Rican 2%
- Common ancestry
- Romanian 3% Italian 2% Slovak 1%
- Foreign-born
- 6% · Canada
- Languages at home
- 79% English-only · Spanish 20%
Political lean MEDSL · Bell
- 2024 margin
- R (+16.2) · D 41.3% · R 57.6% · Other 1.1%
- 2008→2024 swing
- -6.5pp toward R · 2008: -9.8pp · 2024: -16.2pp
- All cycles
- 2024: R+16.2 2020: R+8.5 2016: R+15.1 2012: R+16.4 2008: R+9.8
Not yet ingested
- Civics
- —
Market trends
- HPI YoY
- ▼ -113.09%
- Current HPI
- 177.0555
- Rent YoY
- ▲ 3.44%
- Metro
- Killeen-Temple, TX
- State GDP YoY
- ▲ 3.95%
- F500 in state
- 110
Industry mix (Fortune 500 HQ in TX)
| Industry | F500 HQs | Revenue |
|---|---|---|
| Energy | 16 | $1,198B |
|
||
| Technology | 5 | $198B |
|
||
| Engineering / Construction | 4 | $72B |
|
||
| Energy Services | 3 | $60B |
|
||
| Utilities | 3 | $41B |
|
||
| Healthcare | 2 | $330B |
|
||
Price history
6 events — show timeline
- 2026-06-10 Pending — CTXMLS
- 2026-05-21 Contingent — CTXMLS
- 2026-05-05 Relisted — CTXMLS
- 2026-04-27 Contingent — CTXMLS
- 2026-04-22 Listed $210,000 CTXMLS
- 2001-04-11 Sold (Public Records) — Public Records
Property tax history
+5.5%/yrLatest (2026): $4,111 · +10.0% YoY. Source: county tax records.
Cash-flow waterfall
monthlySold comps — $/sqft
last 12 mo · ≤1 miLoading sold comps…