1434 Levato Ln · Minooka, IL
Flood risk 1/10 · Minimal
- FEMA flood zone
- X (unshaded)
- Chance of flooding over 30 yrs
- 0.0%
- Est. flood insurance / yr
- $473 – $860
Fire risk 1/10 · Minimal
- Est. fire insurance / yr
- $804 – $1,492
Heat risk 3/10 · Minor
- Hot days now (above 102°F)
- 7 days/yr
- Hot days in 30 yrs
- 16 days/yr
Wind risk 2/10 · Minimal
- Chance of severe wind over 30 yrs
- 1.0%
Air-quality risk 2/10 · Minimal
- Unhealthy air days now
- 1 days/yr
- Unhealthy air days in 30 yrs
- 2 days/yr
Risk factors via First Street. Map © Google.
Why this score? — see what drove the D+ grade
The composite is a weighted blend of 9 inputs, each scored 0–100. Each bar is that input's sub-score; the figure is the points it added to the 100-point composite (weight × sub-score).
- Cash flow +17.8/30.0
- ARV discount +7.5/15.0
- DSCR +5.6/10.0
- 1% rule +4.8/10.0
- Livability +3.7/5.0
- Schools +3.1/10.0
- Rent growth +2.5/5.0
- Condition / age +2.5/5.0
- Appreciation +0.0/10.0
$269,900
🖨 Deal sheet (PDF) 📄 Offer letter ✓ Due diligence
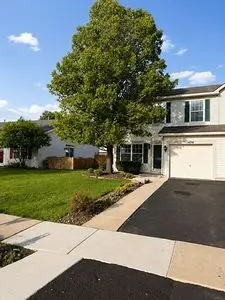
Listing remarks
Welcome to this beautifully maintained two-story duplex located in the desirable Lakewood Trails community, known for its resort-style amenities including a clubhouse, pool, and tennis courts, along with year-round community activities. This charming home offers three spacious bedrooms and a bright, functional kitchen complete with all appliances and a dining area perfect for everyday meals. Enjoy the convenience of an attached one-car garage and unwind in the fully fenced backyard, featuring an inviting stamp concrete paver patio ideal for entertaining or relaxing. Don & acirc; & euro; & trade; t miss this opportunity & acirc; & euro; & rdquo; schedule your showing
Key facts
- Clubhouse
- Tennis courts
- Pool
Tags
Neighborhood map
What this means for you Summary
Snapshot
- This is a 6-bed/4.0-bath single-family listed at $270k.
Deal economics
- At list price, monthly cash flow is $224 ($3k/yr) — positive.
- The deal already cash-flows at list — no discount required.
- To meet the 1% rule (rent ≥ 1% of price), the offer needs to be $265k (1.8% below list).
- Recommended offer: $262k (3.0% below list) — sets the bar for market timing.
- Cap rate 7.3% vs local median 3.4% in Minooka — top-decile yield for the area; either an underpriced asset or a hidden risk that comps aren't pricing in. Stress-test before assuming the spread holds.
Location & tenants
- Location reads 73/100 on livability (#286 in IL) — a middle-class / working-renter tenant base. Strengths: crime A+, employment A+, housing A+; Watch: health & safety C-, amenities F, commute F.
- Minooka Chsd 111 (suburban): math 28% / reading 36% proficiency, ranked #187 of 620 in IL (top 30%) — families likely to look elsewhere, expect single-tenant / working-renter base with shorter leases.
- Zoned schools: Minooka Elem School (math 27% / reading 22%, grade F, #850 of 2,056 statewide, top 45%, 503 students, 0% FRL); Minooka Jr High School (math 23% / reading 34%, grade F, #277 of 665 statewide, top 42%, 1,058 students, 0% FRL); Minooka Community High School (math 28% / reading 36%, grade F, #157 of 693 statewide, top 25%, 2,930 students, 0% FRL).
- Market conditions: 71 active listings in the ZIP; 84 units permitted in Grundy County in 2024 (0 in 5+ unit buildings).
Forward outlook
- Local home prices are declining (-3.0%/yr); year-one equity from $2k of loan paydown is wiped out by about $8k of value loss. Plan a longer hold.
- Grundy County population projected to shrink 9% by 2050 — rents likely to lag national; underwrite the cash flow, not the appreciation.
Negotiation context
- It's been on market 40 days — a 3% lower offer ($262k) is reasonable based on typical stale-listing flexibility.
Questions for the listing agent
- It's been on market 40 days. Have you received any prior offers? Is the seller open to a 3% concession, seller financing, or rate buy-down credit?
- Is there a deadline driving the sale (1031 exchange, divorce, estate, relocation)? That informs how much negotiation room exists.
- Schools are D-rated, which usually means shorter tenancies and higher turnover. Who's the typical renter profile here, and what's been the actual vacancy rate?
- The area grade is low — what's the realistic commute time and amenity access for the typical tenant pool here? Any planned neighborhood developments (good or bad) we should know about?
- What's the average days-on-market for RENTAL listings here right now (not sales)? A rising rental-DOM trend means longer vacancies and softer asking-rent achievability than the comps imply.
- What's the recent tenant-quality profile in this submarket — average credit score on applications, eviction rate, late-payment / NSF rate, and stable-employment percentage? A property-management company in the area should have these aggregated.
- How much new for-sale + rental construction is in the pipeline within 1–3 miles? Heavy new supply typically softens prices + rents 12–24 months out; constrained supply supports both.
Investment metrics
- 1% rule
- 0.98% ✗
- Cap rate
- 7.29%
- Cash-on-cash
- 3.56%
- DSCR
- 1.16
- GRM
- 8.5
CMA / ARV
No comps found within radius.
Projected returns pro-forma
-3.0% appreciation · 3.0% rent growth · sell at horizon
- IRR
- -10.7%
- Equity multiple
- 0.61×
- Total profit
- $-29,415
- Equity at exit
- $40,243
- IRR
- -1.4%
- Equity multiple
- 0.91×
- Total profit
- $-7,058
- Equity at exit
- $23,336
Cash invested: $75,572 (down + closing). Projections, not guarantees.
Landlord ↔ Tenant lean methodology
- Overall (STATE)
- 43 Moderately Tenant-Leaning
- State Illinois
- 43 Moderately Tenant-Leaning · D+7
- County
- — inherits STATE
- City
- — inherits STATE
ZIP-level market 60447
- Home prices YoY
- -15.8%
- Active inventory
- 71
- Price-to-rent
- 8.5×
Monthly cashflow live
- Estimated rent
- $2,650 medium interval (Pro) →
- Mortgage (P&I)
- −$1,415
- Tax from tax record
- −$341 /mo · $4,093/yr
- Insurance
- −$112
- HOA
- −$0
- Vacancy / Maint / Mgmt
- −$556
- Net cashflow
- $224
Break-even live
Sensitivity live
| Price | -10% $377 | -5% $301 | +0% $224 | +5% $148 | +10% $71 |
|---|---|---|---|---|---|
| Rent | -10% $15 | -5% $120 | +0% $224 | +5% $329 | +10% $433 |
| Rate | -1.0pp $360 | -0.5pp $293 | base $224 | +0.5pp $154 | +1.0pp $83 |
UW: 25.0% down · 7.5% · 30yr · 1.5% tax · 5.0% vac · 8.0% maint · 8.0% mgmt
Financing live
Cash to close
- Down payment
- $67,475
- Closing costs
- $8,097
- Reserves months
- —
- Total cash needed
- —
Loan-product check · same deal, 3 products live
Conventional
25% down · 7.5% · 30yr
- Down + closing
- —
- Monthly P&I
- —
- Monthly cashflow
- —
- DSCR
- —
- Eligible?
- —
Personal DTI + credit; lowest rate.
DSCR
20% down · 8.5% · 30yr
- Down + closing
- —
- Monthly P&I
- —
- Monthly cashflow
- —
- DSCR
- —
- Eligible?
- —
No personal income docs; deal must DSCR.
Hard money
10% down · 12.0% · 12mo
- Down + closing
- —
- Monthly P&I
- —
- Monthly cashflow
- —
- DSCR
- —
- Eligible?
- —
Short-term bridge; refi at stabilization.
Listing history 15 events
-
2026-06-21days on market $269,900 Active 40 DOM
-
2026-06-18days on market $269,900 Active 37 DOM
-
2026-06-17days on market $269,900 Active 36 DOM
-
2026-06-16days on market $269,900 Active 35 DOM
-
2026-06-15days on market $269,900 Active 34 DOM
-
2026-06-13days on market $269,900 Active 32 DOM
-
2026-06-09days on market $269,900 Active 28 DOM
-
2026-06-08days on market $269,900 Active 27 DOM
-
2026-06-07days on market $269,900 Active 26 DOM
-
2026-06-04days on market $269,900 Active 23 DOM
-
2026-06-03days on market $269,900 Active 22 DOM
-
2026-06-02days on market $269,900 Active 21 DOM
-
2026-06-01days on market $269,900 Active 20 DOM
-
2026-05-31days on market $269,900 Active 19 DOM
-
2026-05-12$269,900 Active
ⓘ Source: listings_history table (triggers on properties + properties_extension) + one-shot
backfill from property_details.listing_events for pre-trigger history.
Tax reassessment forecast IL · Partial reset (capped growth)
- Current annual tax
- $4,093 · $341/mo
- Projected year-2 tax
- $5,110 · $426/mo
- Expected delta
- +$1,017/yr (+$85/mo · 24.8%)
ⓘ Screening estimate from a state-policy table — verify with the county assessor before closing.
Climate risk First Street
- Flood 1/10 Low FEMA zone X (unshaded) · 0% chance over 30 yrs
- Wildfire 1/10 Low
- Heat 3/10 Moderate 7 d/yr ≥102°F today · 16 d/yr by 30 yrs out
- Wind 2/10 Low 100% chance of damaging wind over 30 yrs
- Air quality 2/10 Low 1 unhealthy d/yr today · 2 by 30 yrs out
Nearby sold comps map
Loading sold comps map…
Walkable amenities ~0.75 mi
Loading nearby amenities…
Taxation est. · year 1
- Rental income
- $31,794
- − Mortgage interest
- −$15,119
- − Property taxes
- −$4,093
- − Insurance
- −$1,350
- − Repairs & maintenance
- −$2,544
- − Management
- −$2,544
- − Depreciation
- −$7,852
- Taxable loss
- −$1,706
- Est. tax savings @ 24.0%
- +$409
- After-tax cash flow
- $3,099/yr
For passive investors: Depreciation is non-cash, so a rental often shows a tax loss while cash-flowing — sheltering income. Rental losses are passive: they offset passive income freely, and up to $25,000/yr can offset ordinary (W-2) income if you actively participate and your MAGI is under $100k (phasing out to $0 by $150k); unused losses carry forward. On sale, claimed depreciation is recaptured at up to 25%, and gains may owe capital-gains tax (a 1031 exchange can defer both). Figures are a year-1 estimate at your 24.0% rate — not tax advice; consult a CPA.
Schools (NCES district)
- District
- Minooka Chsd 111
- NCES district ID
- 1726340
- Math proficiency
- 28% ▼ -8.00%
- Reading proficiency
- 36% ▼ -7.00%
- Median HH income
- $81,260
- Composite
- 30.82/100
- National rank
- #6138
- State rank
- #187 of 620 in IL
Livability — Minooka
- Score
- 73/100
- State rank
- #286
- US rank
- #5553
Category grades
Schools grade is shown separately in the Schools card above.
Census & demographics
- Census place
- Minooka, IL
- Population (ZIP)
- 16,099
Population outlook (Grundy County) Hauer SSP2
- Today (2025)
- 50,716 people
- By 2030
- 50,218 · -1.0%
- By 2040
- 48,599 · -4.2%
- By 2050
- 46,212 · -8.9%
- By 2075
- 40,033 · -21.1%
- By 2100
- 32,966 · -35.0%
Race, ethnicity, and origin ACS 2023
- Neighborhood character
- Predominantly White (77%)
- Race & ethnicity
- White 77% Hispanic / Latino 17% Two or more races 11% Black 4%
- Hispanic origin (detail)
- Mexican 13% Puerto Rican 3%
- Common ancestry
- Romanian 16% Italian 6% Lithuanian 2%
- Foreign-born
- 5% · Canada
- Languages at home
- 90% English-only · Spanish 8% French/Haitian/Cajun 1%
Political lean MEDSL · Grundy
- 2024 margin
- Strong R (+29.6) · D 34.5% · R 64.0% · Other 1.5%
- 2008→2024 swing
- -31.3pp toward R · 2008: 1.7pp · 2024: -29.6pp
- All cycles
- 2024: R+29.6 2020: R+25.8 2016: R+23.6 2012: R+9.0 2008: D+1.7
Not yet ingested
- Civics
- —
Market trends
- HPI YoY
- ▼ -49.68%
- Current HPI
- 263.7065
- Rent YoY
- —
- Metro
- —
- State GDP YoY
- ▲ 1.59%
- F500 in state
- 60
Industry mix (Fortune 500 HQ in IL)
| Industry | F500 HQs | Revenue |
|---|---|---|
| Insurance | 4 | $201B |
|
||
| Consumer Goods | 4 | $87B |
|
||
| Industrial Machinery | 3 | $64B |
|
||
| Healthcare | 2 | $55B |
|
||
| Retail / Pharmacy | 1 | $148B |
|
||
| Agriculture / Food | 1 | $86B |
|
||
Price history
1 event — show timeline
- 2026-05-12 Listed $269,900 FSBO.com
Property tax history
+6.2%/yrLatest (2024): $4,093 · +9.3% YoY. Source: county tax records.
Cash-flow waterfall
monthlySold comps — $/sqft
last 12 mo · ≤1 miLoading sold comps…