27112 SR 30 · Spencer, TN
Flood risk 1/10 · Minimal
- FEMA flood zone
- X (unshaded)
- Chance of flooding over 30 yrs
- 0.0%
- Est. flood insurance / yr
- $507 – $1,088
Fire risk 8/10 · Major
- Est. fire insurance / yr
- $949 – $1,763
Heat risk 4/10 · Minor
- Hot days now (above 101°F)
- 7 days/yr
- Hot days in 30 yrs
- 20 days/yr
Wind risk 4/10 · Minor
- Chance of severe wind over 30 yrs
- 10.0%
Air-quality risk 3/10 · Minor
- Unhealthy air days now
- 2 days/yr
- Unhealthy air days in 30 yrs
- 2 days/yr
Risk factors via First Street. Map © Google.
Why this score? — see what drove the A- grade
The composite is a weighted blend of 9 inputs, each scored 0–100. Each bar is that input's sub-score; the figure is the points it added to the 100-point composite (weight × sub-score).
- Cash flow +28.8/30.0
- ARV discount +15.0/15.0
- DSCR +10.0/10.0
- Appreciation +10.0/10.0
- 1% rule +6.6/10.0
- Livability +3.4/5.0
- Rent growth +2.5/5.0
- Condition / age +2.5/5.0
- Schools +2.0/10.0
$215,000
🖨 Deal sheet 📄 Offer letter ✓ Due diligence
Listing remarks
Conveniently located just minutes from Fall Creek Falls State Park, this home offers the perfect blend of comfort and accessibility. Featuring 3 bedrooms and 2 full bathrooms, the home provides a functional layout with plenty of space to enjoy. Relax and take in the surroundings from both the covered front porch and the covered back deck, ideal for morning coffee or evening unwinding. Whether you're looking for a full-time residence, a weekend getaway, or an investment opportunity, this property checks all the boxes. Its close proximity to Fall Creek Falls makes it especially appealing as a potential short-term rental. Camper/RV hookup available with septic and electric connections. Great
Key facts
- 1.75 acre lot
- Built 1992
- Listed 39 days
Property features AI
Finance
- Other: Pets allowed; Lot size approximately 1.75 acres
Exterior
- Parking: Gravel parking
- Security: Smoke detectors
- Utilities: Private water; Septic tank; Electricity available; Water available; Cable connected
- Home design: Manufactured on land (residential); One level; Renovated
- Construction: Vinyl siding; Metal roof; Block foundation; Built/renovated (year not specified)
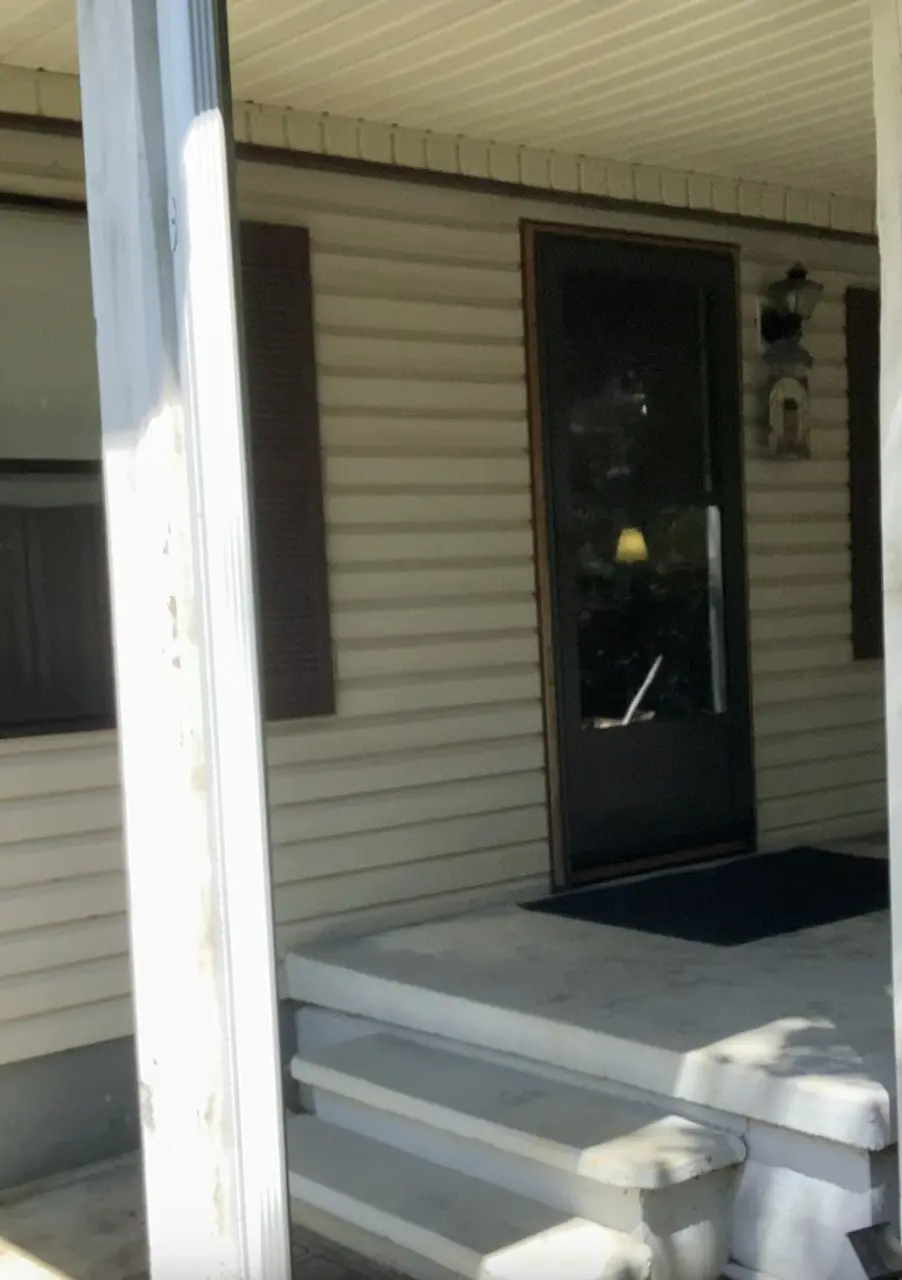
- Exterior features: Covered porch; Covered deck; Deck; Sloped lot
Interior
- Kitchen: Electric oven; Electric range; Microwave; Refrigerator
- Bedrooms: 3 bedrooms (all on main level); Primary bedroom approx. 14 x 13; Secondary bedrooms approx. 12 x 11 and 12 x 11; All bedrooms include walk-in closets
- Flooring: Carpet; Wood; Tile; Vinyl
- Bathrooms: 2 full bathrooms; Master bathroom
- Heating & cooling: Central heating (propane); Central electric air conditioning; Ceiling fans
- Interior features: Ceiling fans; Walk-in closets; Wood burning fireplace (1)
- Laundry & utility: Washer hookup; Electric dryer hookup; Washer and dryer included
Neighborhood map
What this means for you Summary
Snapshot
- This is a 3-bed/2.0-bath manufactured listed at $215k.
Deal economics
- At list price, monthly cash flow is $720 ($9k/yr) — positive.
- The deal already cash-flows at list — no discount required.
- Meets the 1% rule at list price ($2k rent vs $215k).
- Recommended offer: $209k (3.0% below list) — sets the bar for market timing.
- Cap rate 10.3% vs local median 2.5% in Spencer — top-decile yield for the area; either an underpriced asset or a hidden risk that comps aren't pricing in. Stress-test before assuming the spread holds.
Location & tenants
- Location reads 67/100 on livability (#99 in TN) — a middle-class / working-renter tenant base. Strengths: crime A+, cost of living A+, housing A+; Watch: health & safety C-, amenities F, commute F.
- Van Buren County (rural): math 28% / reading 21% proficiency, ranked #96 of 139 in TN (top 69%) — low school quality limits family demand, transient renter base, plan for 1-2y turnover.
- Zoned schools: Spencer Elementary (math 32% / reading 27%, grade F, #423 of 952 statewide, top 48%, 394 students, 0% FRL); Van Buren Co High School (math 25% / reading 18%, grade F, #172 of 332 statewide, top 52%, 400 students, 0% FRL) — zoned schools average 0% FRL vs 52% district-wide (52 pts lower); this property's tenant base skews higher-income than the district average.
- Market conditions: 155 active listings in the ZIP; 8 units permitted in Van Buren County in 2024 (0 in 5+ unit buildings).
- At $2,497/mo this rent would consume 55% of the median local household income ($55k/yr) — very limited rent-growth headroom before tenants either downsize or default.
Forward outlook
- In year one you build about $23k of equity ($1k loan paydown + $22k appreciation (10.0% local appreciation)).
- Van Buren County population projected to shrink 3% by 2050 — rents likely to lag national; underwrite the cash flow, not the appreciation.
- At projected returns (10.0% appreciation + 3.0% rent growth), your $60k cash investment doubles in ~2 years — after that, you're playing with house money.
- By year 2, paydown + projected appreciation supports a ~$37k cash-out refi (75% LTV) — recoverable capital for the next deal without selling this one.
Negotiation context
- It's been on market 40 days — a 3% lower offer ($209k) is reasonable based on typical stale-listing flexibility.
- Current owner paid $62k; list at $215k implies a 244% gain — meaningful room to come down on a strong offer.
Risks & watch-outs
- Climate carrying-cost: severe wildfire risk — expect insurance premiums to compound above CPI over the hold.
Questions for the listing agent
- It's been on market 40 days. Have you received any prior offers? Is the seller open to a 3% concession, seller financing, or rate buy-down credit?
- Is there a deadline driving the sale (1031 exchange, divorce, estate, relocation)? That informs how much negotiation room exists.
- Schools are F-rated, which usually means shorter tenancies and higher turnover. Who's the typical renter profile here, and what's been the actual vacancy rate?
- What's the average days-on-market for RENTAL listings here right now (not sales)? A rising rental-DOM trend means longer vacancies and softer asking-rent achievability than the comps imply.
- What's the recent tenant-quality profile in this submarket — average credit score on applications, eviction rate, late-payment / NSF rate, and stable-employment percentage? A property-management company in the area should have these aggregated.
- How much new for-sale + rental construction is in the pipeline within 1–3 miles? Heavy new supply typically softens prices + rents 12–24 months out; constrained supply supports both.
Investment metrics
- 1% rule
- 1.16% ✓
- Cap rate
- 10.31%
- Cash-on-cash
- 14.35%
- DSCR
- 1.64
- GRM
- 7.2
CMA / ARV
- ARV (median comp)
- $305,321
- List price
- $215,000
- Delta
- -29.58%
- Verdict
- UNDERPRICED
- Comps
- 1 within 2.0 mi
Show comp detail 1 sale within ~0.75 mi
| Address | Dist | Beds/Ba | Sqft | Sold | Price | $/sf | Match |
|---|---|---|---|---|---|---|---|
| 13529 Park Rd | 0.51mi | 3/2.0 | 1,512 (0%) | 11mo | $305,000 | $202 | 67 |
Match score weights: distance 35% · size 25% · config 20% · recency 20%. Top-matched comps best support the ARV.
Projected returns pro-forma
10.0% appreciation · 3.0% rent growth · sell at horizon
- IRR
- 34.8%
- Equity multiple
- 3.71×
- Total profit
- $162,851
- Equity at exit
- $193,689
- IRR
- 30.0%
- Equity multiple
- 8.36×
- Total profit
- $443,294
- Equity at exit
- $417,698
Cash invested: $60,200 (down + closing). Projections, not guarantees.
Landlord ↔ Tenant lean methodology
- Overall (STATE)
- 87 Strongly Landlord-Friendly
- State Tennessee
- 87 Strongly Landlord-Friendly · R+13
- County
- — inherits STATE
- City
- — inherits STATE
ZIP-level market 37367
- Home prices YoY
- 34.5%
- Active inventory
- 155
- Price-to-rent
- 7.2×
Monthly cashflow live
- Estimated rent
- $2,497 medium interval (Pro) →
- Mortgage (P&I)
- −$1,127
- Tax from tax record
- −$36 /mo · $430/yr
- Insurance
- −$90
- HOA
- −$0
- Vacancy / Maint / Mgmt
- −$524
- Net cashflow
- $720
Break-even live
UW: 25.0% down · 7.5% · 30yr · 1.5% tax · 5.0% vac · 8.0% maint · 8.0% mgmt
Financing live
Cash to close
- Down payment
- $53,750
- Closing costs
- $6,450
- Reserves months
- —
- Total cash needed
- —
Loan-product check · same deal, 3 products live
Conventional
25% down · 7.5% · 30yr
- Down + closing
- —
- Monthly P&I
- —
- Monthly cashflow
- —
- DSCR
- —
- Eligible?
- —
Personal DTI + credit; lowest rate.
DSCR
20% down · 8.5% · 30yr
- Down + closing
- —
- Monthly P&I
- —
- Monthly cashflow
- —
- DSCR
- —
- Eligible?
- —
No personal income docs; deal must DSCR.
Hard money
10% down · 12.0% · 12mo
- Down + closing
- —
- Monthly P&I
- —
- Monthly cashflow
- —
- DSCR
- —
- Eligible?
- —
Short-term bridge; refi at stabilization.
Listing history 20 events
-
2026-06-19days on market $215,000 Active 40 DOM
-
2026-06-18days on market $215,000 Active 39 DOM
-
2026-06-17days on market $215,000 Active 38 DOM
-
2026-06-16days on market $215,000 Active 37 DOM
-
2026-06-15days on market $215,000 Active 36 DOM
-
2026-06-14days on market $215,000 Active 34 DOM
-
2026-06-12days on market $215,000 Active 33 DOM
-
2026-06-09days on market $215,000 Active 30 DOM
-
2026-06-08days on market $215,000 Active 29 DOM
-
2026-06-07days on market $215,000 Active 28 DOM
-
2026-06-05days on market $215,000 Active 25 DOM
-
2026-06-03days on market $215,000 Active 24 DOM
-
2026-06-03price $215,000 Active 23 DOM
-
2026-06-02days on market $230,000 Active 23 DOM
-
2026-06-01days on market $230,000 Active 22 DOM
-
2026-05-31days on market $230,000 Active 21 DOM
-
2026-05-30days on market $230,000 Active 20 DOM
-
2026-05-11$230,000 Active 802-char remark
-
2026-05-04historical $230,000 802-char remark
-
2005-10-04soldstatus $62,500
ⓘ Source: listings_history table (triggers on properties + properties_extension) + one-shot
backfill from property_details.listing_events for pre-trigger history.
Tax reassessment forecast TN · Resets to sale price
- Current annual tax
- $430 · $36/mo
- Projected year-2 tax
- $1,526 · $127/mo
- Expected delta
- +$1,096/yr (+$91/mo · 255.0%)
ⓘ Screening estimate from a state-policy table — verify with the county assessor before closing.
Climate risk First Street
- Flood 1/10 Low FEMA zone X (unshaded) · 0% chance over 30 yrs
- Wildfire 8/10 Severe
- Heat 4/10 Moderate 7 d/yr ≥101°F today · 20 d/yr by 30 yrs out
- Wind 4/10 Moderate 10% chance of damaging wind over 30 yrs
- Air quality 3/10 Moderate 2 unhealthy d/yr today · 2 by 30 yrs out
Nearby sold comps map
Loading sold comps map…
Walkable amenities ~0.75 mi
Loading nearby amenities…
Taxation est. · year 1
- Rental income
- $29,969
- − Mortgage interest
- −$12,043
- − Property taxes
- −$430
- − Insurance
- −$1,075
- − Repairs & maintenance
- −$2,398
- − Management
- −$2,398
- − Depreciation
- −$6,255
- Taxable income
- $5,371
- Est. tax owed @ 24.0%
- −$1,289
- After-tax cash flow
- $7,352/yr
For passive investors: Depreciation is non-cash, so a rental often shows a tax loss while cash-flowing — sheltering income. Rental losses are passive: they offset passive income freely, and up to $25,000/yr can offset ordinary (W-2) income if you actively participate and your MAGI is under $100k (phasing out to $0 by $150k); unused losses carry forward. On sale, claimed depreciation is recaptured at up to 25%, and gains may owe capital-gains tax (a 1031 exchange can defer both). Figures are a year-1 estimate at your 24.0% rate — not tax advice; consult a CPA.
Schools (NCES district)
- District
- Van Buren County
- NCES district ID
- 4704320
- Math proficiency
- 28% ▼ -12.00%
- Reading proficiency
- 21% ▼ -9.00%
- Median HH income
- $35,459
- Composite
- 20.29/100
- National rank
- #8617
- State rank
- #96 of 139 in TN
Livability — Spencer
- Score
- 67/100
- State rank
- #99
- US rank
- #10391
Category grades
Schools grade is shown separately in the Schools card above.
Census & demographics
- County
- Bledsoe · 11,736 people
- Population (ZIP)
- 11,736
- Household income
- $54,696
- Rent vs Own
- Severe rent burden
- 2.1
Population outlook (Van Buren County) Hauer SSP2
- Today (2025)
- 5,883 people
- By 2030
- 5,925 · +0.7%
- By 2040
- 5,877 · -0.1%
- By 2050
- 5,706 · -3.0%
- By 2075
- 5,162 · -12.3%
- By 2100
- 4,450 · -24.4%
Race, ethnicity, and origin ACS 2023
- Neighborhood character
- Predominantly White (86%)
- Race & ethnicity
- White 86% Black 7% Two or more races 6% Hispanic / Latino 2%
- Common ancestry
- Italian 1% Slovak 1% Lithuanian 1%
- Foreign-born
- 2% · Canada
- Languages at home
- 97% English-only · German/W. Germanic 1% Spanish 1%
Political lean MEDSL · Van Buren
- 2024 margin
- Solid R (+67.2) · D 16.1% · R 83.2%
- 2008→2024 swing
- -46.8pp toward R · 2008: -20.4pp · 2024: -67.2pp
- All cycles
- 2024: R+67.2 2020: R+61.6 2016: R+53.0 2012: R+22.1 2008: R+20.4
Not yet ingested
- Civics
- —
Market trends
- HPI YoY
- ▲ 106.44%
- Current HPI
- 415.344
- Rent YoY
- —
- Metro
- —
- State GDP YoY
- ▲ 2.78%
- F500 in state
- 22
Industry mix (Fortune 500 HQ in TN)
| Industry | F500 HQs | Revenue |
|---|---|---|
| Healthcare | 3 | $91B |
|
||
| Retail | 3 | $72B |
|
||
| Transportation / Logistics | 1 | $88B |
|
||
| Paper / Packaging | 1 | $19B |
|
||
| Insurance | 1 | $13B |
|
||
| Energy | 1 | $12B |
|
||
Price history
+244.0% since first listed4 events — show timeline
- 2026-06-02 Price Changed $215,000 REALTRACS as Distributed by MLS Grid
- 2026-05-11 Listed $230,000 REALTRACS as Distributed by MLS Grid
- 2026-05-04 Coming Soon $230,000 REALTRACS as Distributed by MLS Grid
- 2005-10-04 Sold (Public Records) $62,500 Public Records
Property tax history
+7.1%/yrLatest (2025): $430 · +0.0% YoY. Source: county tax records.
Cash-flow waterfall
monthlySold comps — $/sqft
last 12 mo · ≤1 miLoading sold comps…