26340 Strickland Rd · Picayune, MS
Flood risk 1/10 · Minimal
- FEMA flood zone
- X (unshaded)
- Chance of flooding over 30 yrs
- 0.0%
- Est. flood insurance / yr
- $507 – $1,088
Fire risk 6/10 · Moderate
- Est. fire insurance / yr
- $1,241 – $2,305
Heat risk 9/10 · Severe
- Hot days now (above 109°F)
- 7 days/yr
- Hot days in 30 yrs
- 21 days/yr
Wind risk 9/10 · Severe
- Chance of severe wind over 30 yrs
- 99.0%
Air-quality risk 1/10 · Minimal
- Unhealthy air days now
- 0 days/yr
- Unhealthy air days in 30 yrs
- 0 days/yr
Risk factors via First Street. Map © Google.
Why this score? — see what drove the B- grade
The composite is a weighted blend of 9 inputs, each scored 0–100. Each bar is that input's sub-score; the figure is the points it added to the 100-point composite (weight × sub-score).
- Cash flow +25.0/30.0
- ARV discount +15.0/15.0
- DSCR +8.1/10.0
- 1% rule +6.1/10.0
- Schools +3.9/10.0
- Livability +3.8/5.0
- Rent growth +2.5/5.0
- Condition / age +2.5/5.0
- Appreciation +0.0/10.0
$99,000
🖨 Deal sheet 📄 Offer letter ✓ Due diligence
Listing remarks MLS
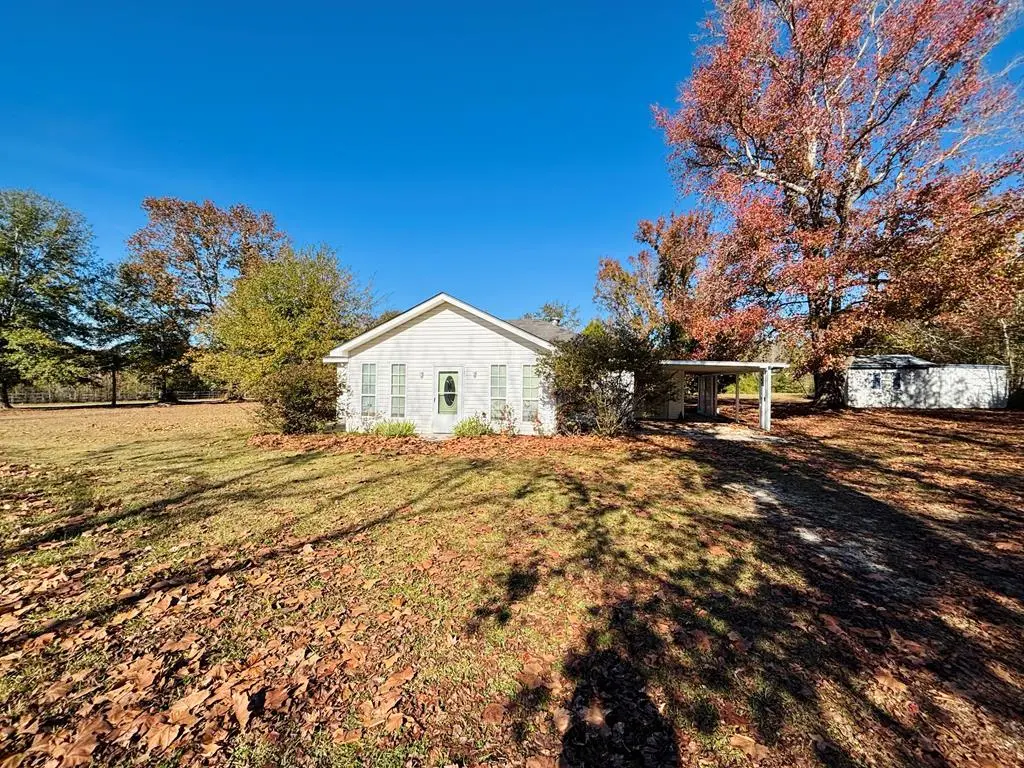
Cute and affordable home in the country on a quiet acre! Large living area, 2 bedrooms, carport, shed, and more. Gorgeous mature oak trees surround property. Feels like country, but less than 15 minutes from town. Needs a little TLC, but has great bones!
Key facts
- Large living area
- Mature oak trees
- Quiet acre
Tags
Neighborhood map
What this means for you Summary
Snapshot
- This is a 2-bed/1.0-bath single-family listed at $99k.
Deal economics
- At list price, monthly cash flow is $215 ($3k/yr) — positive.
- The deal already cash-flows at list — no discount required.
- Meets the 1% rule at list price ($1k rent vs $99k).
- Recommended offer: $87k (12.0% below list) — sets the bar for market timing.
- Cap rate 8.9% vs local median 3.3% in Picayune — top-decile yield for the area; either an underpriced asset or a hidden risk that comps aren't pricing in. Stress-test before assuming the spread holds.
Location & tenants
- Location reads 76/100 on livability (#11 in MS, #3,748 nationally) — a middle-class / working-renter tenant base. Strengths: cost of living A+, health & safety A+, amenities A; Watch: schools C-, commute F, employment F.
- Hancock County School District (rural): math 47% / reading 44% proficiency, ranked #23 of 130 in MS (top 18%) — families likely to look elsewhere, expect single-tenant / working-renter base with shorter leases.
- Market conditions: 344 active listings in the ZIP; 248 units permitted in Hancock County in 2024 (0 in 5+ unit buildings).
Forward outlook
- Local home prices are declining (-3.0%/yr); year-one equity from $684 of loan paydown is wiped out by about $3k of value loss. Plan a longer hold.
- Hancock County population projected at +20% by 2050 — long-run rental-demand tailwind backs the buy-and-hold thesis.
Negotiation context
- It's been on market 188 days — a 12% lower offer ($87k) is reasonable based on typical stale-listing flexibility.
Risks & watch-outs
- Climate carrying-cost: severe wind risk, 99% chance of damaging wind over 30y; major wildfire risk; extreme-heat days projected 7→21/yr by 2055 (HVAC capex compounding) — expect insurance premiums to compound above CPI over the hold.
Questions for the listing agent
- It's been on market 188 days. Have you received any prior offers? Is the seller open to a 12% concession, seller financing, or rate buy-down credit?
- Why hasn't it sold? Are there any deal-killer items the seller is aware of (foundation, flood, title, zoning, code violations)?
- Is there a deadline driving the sale (1031 exchange, divorce, estate, relocation)? That informs how much negotiation room exists.
- What's the average days-on-market for RENTAL listings here right now (not sales)? A rising rental-DOM trend means longer vacancies and softer asking-rent achievability than the comps imply.
- What's the recent tenant-quality profile in this submarket — average credit score on applications, eviction rate, late-payment / NSF rate, and stable-employment percentage? A property-management company in the area should have these aggregated.
- How much new for-sale + rental construction is in the pipeline within 1–3 miles? Heavy new supply typically softens prices + rents 12–24 months out; constrained supply supports both.
Investment metrics
- 1% rule
- 1.11% ✓
- Cap rate
- 8.90%
- Cash-on-cash
- 9.32%
- DSCR
- 1.41
- GRM
- 7.5
CMA / ARV
- ARV (median comp)
- $166,566
- List price
- $99,000
- Delta
- -40.56%
- Verdict
- UNDERPRICED
- Comps
- 2 within 2.0 mi
Projected returns pro-forma
-3.0% appreciation · 3.0% rent growth · sell at horizon
- IRR
- -2.2%
- Equity multiple
- 0.92×
- Total profit
- $-2,326
- Equity at exit
- $14,761
- IRR
- 7.5%
- Equity multiple
- 1.56×
- Total profit
- $15,632
- Equity at exit
- $8,560
Cash invested: $27,720 (down + closing). Projections, not guarantees.
Landlord ↔ Tenant lean methodology
- Overall (STATE)
- 90 Strongly Landlord-Friendly
- State Mississippi
- 90 Strongly Landlord-Friendly · R+11
- County
- — inherits STATE
- City
- — inherits STATE
ZIP-level market 39466
- Home prices YoY
- -26.3%
- Active inventory
- 344
- Price-to-rent
- 7.5×
Monthly cashflow live
- Estimated rent
- $1,102 medium interval (Pro) →
- Mortgage (P&I)
- −$519
- Tax from tax record
- −$94 /mo · $1,134/yr
- Insurance
- −$41
- HOA
- −$0
- Vacancy / Maint / Mgmt
- −$231
- Net cashflow
- $215
Break-even live
UW: 25.0% down · 7.5% · 30yr · 1.5% tax · 5.0% vac · 8.0% maint · 8.0% mgmt
Financing live
Cash to close
- Down payment
- $24,750
- Closing costs
- $2,970
- Reserves months
- —
- Total cash needed
- —
Loan-product check · same deal, 3 products live
Conventional
25% down · 7.5% · 30yr
- Down + closing
- —
- Monthly P&I
- —
- Monthly cashflow
- —
- DSCR
- —
- Eligible?
- —
Personal DTI + credit; lowest rate.
DSCR
20% down · 8.5% · 30yr
- Down + closing
- —
- Monthly P&I
- —
- Monthly cashflow
- —
- DSCR
- —
- Eligible?
- —
No personal income docs; deal must DSCR.
Hard money
10% down · 12.0% · 12mo
- Down + closing
- —
- Monthly P&I
- —
- Monthly cashflow
- —
- DSCR
- —
- Eligible?
- —
Short-term bridge; refi at stabilization.
Listing history 20 events
-
2026-06-18days on market $99,000 Active 188 DOM
-
2026-06-17days on market $99,000 Active 187 DOM
-
2026-06-16days on market $99,000 Active 186 DOM
-
2026-06-15days on market $99,000 Active 185 DOM
-
2026-06-14days on market $99,000 Active 183 DOM
-
2026-06-13days on market $99,000 Active 182 DOM
-
2026-06-10days on market $99,000 Active 180 DOM
-
2026-06-09days on market $99,000 Active 179 DOM
-
2026-06-08days on market $99,000 Active 178 DOM
-
2026-06-07days on market $99,000 Active 177 DOM
-
2026-06-05days on market $99,000 Active 174 DOM
-
2026-06-03days on market $99,000 Active 173 DOM
-
2026-06-02days on market $99,000 Active 172 DOM
-
2026-06-01days on market $99,000 Active 171 DOM
-
2026-05-31days on market $99,000 Active 170 DOM
-
2026-05-30days on market $99,000 Active 169 DOM
-
2026-05-04price $99,000 254-char remark
Show marketing remark (254 chars)
Cute and affordable home in the country on a quiet acre! Large living area, 2 bedrooms, carport, shed, and more. Gorgeous mature oak trees surround property. Feels like country, but less than 15 minutes from town. Needs a little TLC, but has great bones!
-
2026-01-06price $120,000 254-char remark
Show marketing remark (254 chars)
Cute and affordable home in the country on a quiet acre! Large living area, 2 bedrooms, carport, shed, and more. Gorgeous mature oak trees surround property. Feels like country, but less than 15 minutes from town. Needs a little TLC, but has great bones!
-
2025-12-12$151,000 Active 254-char remark
Show marketing remark (254 chars)
Cute and affordable home in the country on a quiet acre! Large living area, 2 bedrooms, carport, shed, and more. Gorgeous mature oak trees surround property. Feels like country, but less than 15 minutes from town. Needs a little TLC, but has great bones!
-
1997-11-14soldstatus
ⓘ Source: listings_history table (triggers on properties + properties_extension) + one-shot
backfill from property_details.listing_events for pre-trigger history.
Tax reassessment forecast MS · Resets to sale price
- Current annual tax
- $1,134 · $94/mo
- Projected year-2 tax
- $1,134 · $94/mo
- Expected delta
- $0/yr ($0/mo · 0.0%)
ⓘ Screening estimate from a state-policy table — verify with the county assessor before closing.
Climate risk First Street
- Flood 1/10 Low FEMA zone X (unshaded) · 0% chance over 30 yrs
- Wildfire 6/10 Major
- Heat 9/10 Extreme 7 d/yr ≥109°F today · 21 d/yr by 30 yrs out
- Wind 9/10 Extreme 99% chance of damaging wind over 30 yrs
- Air quality 1/10 Low 0 unhealthy d/yr today · 0 by 30 yrs out
Nearby sold comps map
Loading sold comps map…
Walkable amenities ~0.75 mi
Loading nearby amenities…
Taxation est. · year 1
- Rental income
- $13,220
- − Mortgage interest
- −$5,546
- − Property taxes
- −$1,134
- − Insurance
- −$495
- − Repairs & maintenance
- −$1,058
- − Management
- −$1,058
- − Depreciation
- −$2,880
- Taxable income
- $1,050
- Est. tax owed @ 24.0%
- −$252
- After-tax cash flow
- $2,333/yr
For passive investors: Depreciation is non-cash, so a rental often shows a tax loss while cash-flowing — sheltering income. Rental losses are passive: they offset passive income freely, and up to $25,000/yr can offset ordinary (W-2) income if you actively participate and your MAGI is under $100k (phasing out to $0 by $150k); unused losses carry forward. On sale, claimed depreciation is recaptured at up to 25%, and gains may owe capital-gains tax (a 1031 exchange can defer both). Figures are a year-1 estimate at your 24.0% rate — not tax advice; consult a CPA.
Schools (NCES district)
- District
- Hancock County School District
- NCES district ID
- 2801740
- Math proficiency
- 47% ▼ -11.00%
- Reading proficiency
- 44% ▼ -9.00%
- Median HH income
- $47,971
- Composite
- 38.88/100
- National rank
- #4099
- State rank
- #23 of 130 in MS
Livability — Picayune
- Score
- 76/100
- State rank
- #11
- US rank
- #3748
Category grades
Schools grade is shown separately in the Schools card above.
Census & demographics
- Population (ZIP)
- 28,292
Population outlook (Hancock County) Hauer SSP2
- Today (2025)
- 52,161 people
- By 2030
- 54,753 · +5.0%
- By 2040
- 59,242 · +13.6%
- By 2050
- 62,417 · +19.7%
- By 2075
- 68,168 · +30.7%
- By 2100
- 69,212 · +32.7%
Race, ethnicity, and origin ACS 2023
- Neighborhood character
- Predominantly White (72%)
- Race & ethnicity
- White 72% Black 18% Two or more races 6% Hispanic / Latino 6%
- Hispanic origin (detail)
- Mexican 1%
- Common ancestry
- Lithuanian 9% Iranian 1% Slovak 1%
- Foreign-born
- 2% · Canada
- Languages at home
- 96% English-only · Spanish 3%
Political lean MEDSL · Hancock
- 2024 margin
- Solid R (+58.7) · D 20.1% · R 78.8% · Other 1.1%
- 2008→2024 swing
- -4.4pp toward R · 2008: -54.2pp · 2024: -58.7pp
- All cycles
- 2024: R+58.7 2020: R+55.5 2016: R+59.4 2012: R+52.8 2008: R+54.2
Not yet ingested
- Civics
- —
Market trends
- HPI YoY
- ▼ -69.32%
- Current HPI
- 194.6541
- Rent YoY
- —
- Metro
- —
- State GDP YoY
- —
- F500 in state
- 0
Price history
-34.4% since first listed4 events — show timeline
- 2026-05-04 Price Changed $99,000 PRCBOR
- 2026-01-06 Price Changed $120,000 PRCBOR
- 2025-12-12 Listed $151,000 PRCBOR
- 1997-11-14 Sold (Public Records) — Public Records
Property tax history
+0.4%/yrLatest (2025): $1,134 · +0.4% YoY. Source: county tax records.
Cash-flow waterfall
monthlySold comps — $/sqft
last 12 mo · ≤1 miLoading sold comps…