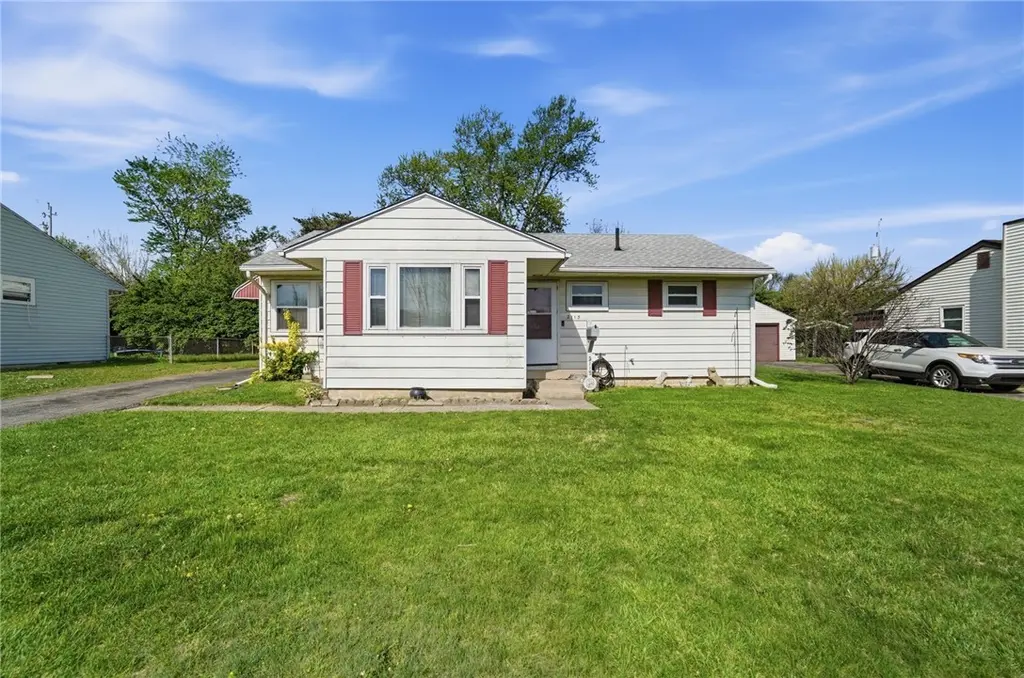
2113 Pittsfield St · Kettering, OH
Flood risk 1/10 · Minimal
- FEMA flood zone
- X (unshaded)
- Chance of flooding over 30 yrs
- 0.0%
- Est. flood insurance / yr
- $507 – $1,088
Fire risk 1/10 · Minimal
- Est. fire insurance / yr
- $713 – $1,323
Heat risk 3/10 · Minor
- Hot days now (above 100°F)
- 7 days/yr
- Hot days in 30 yrs
- 18 days/yr
Wind risk 2/10 · Minimal
- Chance of severe wind over 30 yrs
- 0.0%
Air-quality risk 3/10 · Minor
- Unhealthy air days now
- 2 days/yr
- Unhealthy air days in 30 yrs
- 3 days/yr
Risk factors via First Street. Map © Google.
Why this score? — see what drove the F grade
The composite is a weighted blend of 9 inputs, each scored 0–100. Each bar is that input's sub-score; the figure is the points it added to the 100-point composite (weight × sub-score).
- Cash flow +11.4/30.0
- Schools +5.2/10.0
- Livability +4.2/5.0
- Rent growth +3.7/5.0
- DSCR +3.3/10.0
- 1% rule +2.8/10.0
- Condition / age +2.5/5.0
- ARV discount +1.6/15.0
- Appreciation +0.0/10.0
$191,000
🖨 Deal sheet 📄 Offer letter ✓ Due diligence
Listing remarks
Here's a great Kettering ranch that has been loved by the same family for decades that has a brand new roof (03/26) with a transferrable warranty and is in a great neighborhood close to shopping, parks, restaurants and schools. This cozy single story lifestyle home features 3 bedrooms, 1 bathroom a fabulous fenced backyard with a covered patio that's perfect for entertaining outdoors! Use your code, key, phone or keyfob to enter through the recently upgraded front doorknob and enjoy the larger than average living room. The dining room is right off of the kitchen making for more easy entertaining or cozy & convenient meals. There are original hardwood floors in the bedrooms & vi
Key facts
- Covered patio
- Detached garage
- Additional shed
Tags
Property features AI
Finance
- Financial info: Offered for sale
Exterior
- Parking: Detached one-car garage
- Utilities: Public utilities (water/sewer not specified); Electric service not specified
- Home design: Single-story home; Frame construction; Residential zoning; Lot roughly 125 x 63
- Construction: Frame construction
- Exterior features: Fenced yard; Patio; Outdoor storage; Shed(s)
Interior
- Kitchen: Kitchen on main level (12 x 8)
- Bedrooms: Three bedrooms (all on the main level): 12 x 7, 12 x 12, 12 x 9
- Bathrooms: One full bathroom (main level)
- Heating & cooling: Natural gas heating; Central air conditioning
- Interior features: Vinyl windows; Crawl space basement
- Laundry & utility: Washer and Dryer; Main-level utility room (12 x 7)
Neighborhood map
What this means for you Summary
Snapshot
- This is a 3-bed/1.0-bath single-family listed at $191k.
Deal economics
- At list price, monthly cash flow is $-67 ($-807/yr) — negative.
- To cash-flow at today's rent, offer at most $179k (6.2% below list).
- To meet the 1% rule (rent ≥ 1% of price), the offer needs to be $149k (22.1% below list).
- Recommended offer: $149k (22.1% below list) — sets the bar for 1% rule.
- Cap rate 5.9% vs local median 4.4% in Kettering — top-decile yield for the area; either an underpriced asset or a hidden risk that comps aren't pricing in. Stress-test before assuming the spread holds.
Location & tenants
- Location reads 83/100 on livability (#61 in OH, #922 nationally) — a professional / high-income tenant draw. Strengths: schools A+, crime A+, cost of living A+; Watch: commute F.
- Kettering City School District (suburban): math 54% / reading 68% proficiency, ranked #277 of 656 in OH (top 42%) — acceptable for families but not a draw, mixed tenant base, ~2y average lease.
- Market conditions: Rents rising fast (+4.8%/yr); 106 active listings in the ZIP; 27 comparable units currently listed for rent nearby; rentals at typical pace (median 19d on market — plan ~3-4 weeks tenant-placement turnaround); 907 units permitted in Montgomery County in 2024 (416 in 5+ unit buildings).
Forward outlook
- Local home prices are declining (-3.0%/yr); year-one equity from $1k of loan paydown is wiped out by about $6k of value loss. Plan a longer hold.
- Montgomery County population projected at -10% by 2050 — secular population decline; favor cash flow + early exit over multi-decade hold.
Negotiation context
- Only 14 days on market — expect competitive offers; lowballing is unlikely to land.
Risks & watch-outs
- Watch-outs: built in 1954 — expect roof / HVAC / electrical / plumbing capex.
Questions for the listing agent
- What do current leases actually rent for vs. the listed asking? Can we see a recent rent roll and the last 12 months of T-12 income?
- Built in 1954 — when were the roof, HVAC, electrical panel, plumbing, and water heater last replaced?
- Is there a deadline driving the sale (1031 exchange, divorce, estate, relocation)? That informs how much negotiation room exists.
- Schools are A-rated — typically a magnet for longer-tenancy family renters. What's the average tenant stay here, and is there a school-zone premium baked into asking?
- The area grade is low — what's the realistic commute time and amenity access for the typical tenant pool here? Any planned neighborhood developments (good or bad) we should know about?
- What's the average days-on-market for RENTAL listings here right now (not sales)? A rising rental-DOM trend means longer vacancies and softer asking-rent achievability than the comps imply.
- What's the recent tenant-quality profile in this submarket — average credit score on applications, eviction rate, late-payment / NSF rate, and stable-employment percentage? A property-management company in the area should have these aggregated.
- How much new for-sale + rental construction is in the pipeline within 1–3 miles? Heavy new supply typically softens prices + rents 12–24 months out; constrained supply supports both.
Investment metrics
- 1% rule
- 0.78% ✗
- Cap rate
- 5.87%
- Cash-on-cash
- -1.51%
- DSCR
- 0.93
- GRM
- 10.7
CMA / ARV
- ARV (on-the-fly)
- $168,960
- Comps found
- 12
Show comp detail 12 sales within ~0.75 mi
| Address | Dist | Beds/Ba | Sqft | Sold | Price | $/sf | Match |
|---|---|---|---|---|---|---|---|
| 2113 Pittsfield St | 0.00mi | 3/1.0 | 1,056 (0%) | 1mo | $185,000 | $175 | 100 |
| 2009 Hazel Ave | 0.13mi | 3/1.0 | 966 (-8%) | 0mo | $80,500 | $83 | 80 |
| 1841 Courtland Ave | 0.32mi | 2/1.0 (-1) | 1,024 (-3%) | 3mo | $145,000 | $142 | 73 |
| 2112 Patterson Rd | 0.42mi | 3/1.0 | 1,008 (-4%) | 2mo | $160,000 | $159 | 71 |
| 2151 S Smithville Rd | 0.37mi | 3/1.5 | 1,114 (+6%) | 2mo | $160,000 | $144 | 70 |
| 1525 Patterson Rd | 0.50mi | 3/1.0 | 1,142 (+8%) | 0mo | $183,000 | $160 | 63 |
| 1629 Beaver Creek Ln | 0.57mi | 3/1.5 | 1,120 (+6%) | 2mo | $210,000 | $188 | 60 |
| 1804 Culver Ave | 0.41mi | 2/1.5 (-1) | 928 (-12%) | 1mo | $205,000 | $221 | 53 |
| 2051 S Smithville Rd | 0.37mi | 4/1.0 (+1) | 1,205 (+14%) | 3mo | $205,000 | $170 | 52 |
| 2817 Kennedy Ave | 0.58mi | 2/2.0 (-1) | 960 (-9%) | 1mo | $125,000 | $130 | 48 |
| 2167 W Bataan Dr | 0.73mi | 4/2.0 (+1) | 1,008 (-4%) | 3mo | $125,000 | $124 | 47 |
| 2384 Woodman Dr | 0.73mi | 3/1.0 | 936 (-11%) | 1mo | $198,000 | $212 | 46 |
Match score weights: distance 35% · size 25% · config 20% · recency 20%. Top-matched comps best support the ARV.
Projected returns pro-forma
-3.0% appreciation · 4.82% rent growth · sell at horizon
- IRR
- -16.9%
- Equity multiple
- 0.39×
- Total profit
- $-32,486
- Equity at exit
- $28,479
- IRR
- -6.0%
- Equity multiple
- 0.59×
- Total profit
- $-22,098
- Equity at exit
- $16,514
Cash invested: $53,480 (down + closing). Projections, not guarantees.
Landlord ↔ Tenant lean methodology
- Overall (STATE)
- 73 Landlord-Friendly
- State Ohio
- 73 Landlord-Friendly · R+6
- County
- — inherits STATE
- City
- — inherits STATE
ZIP-level market 45420
- Rents YoY
- 4.8%
- Active inventory
- 106
- Price-to-rent
- 10.7×
Monthly cashflow live
- Estimated rent
- $1,487 high interval (Pro) →
- Mortgage (P&I)
- −$1,002
- Tax from tax record
- −$161 /mo · $1,930/yr
- Insurance
- −$80
- HOA
- −$0
- Vacancy / Maint / Mgmt
- −$312
- Net cashflow
- $-67
Break-even live
UW: 25.0% down · 7.5% · 30yr · 1.5% tax · 5.0% vac · 8.0% maint · 8.0% mgmt
Financing live
Cash to close
- Down payment
- $47,750
- Closing costs
- $5,730
- Reserves months
- —
- Total cash needed
- —
Loan-product check · same deal, 3 products live
Conventional
25% down · 7.5% · 30yr
- Down + closing
- —
- Monthly P&I
- —
- Monthly cashflow
- —
- DSCR
- —
- Eligible?
- —
Personal DTI + credit; lowest rate.
DSCR
20% down · 8.5% · 30yr
- Down + closing
- —
- Monthly P&I
- —
- Monthly cashflow
- —
- DSCR
- —
- Eligible?
- —
No personal income docs; deal must DSCR.
Hard money
10% down · 12.0% · 12mo
- Down + closing
- —
- Monthly P&I
- —
- Monthly cashflow
- —
- DSCR
- —
- Eligible?
- —
Short-term bridge; refi at stabilization.
Rent comps 27 comps
| Address | Beds | Baths | Sqft | Rent | $/sqft | DOM | Units | Dist |
|---|---|---|---|---|---|---|---|---|
| 3603 S Smithville Rd Kettering, OH | 2.0 | 1.0 | 950 | $1,100 | $1.16 | 23d | 1 | 0.36mi |
| 1828 Hazel Ave Dayton, OH | 2.0 | 1.0 | 960 | $1,435 | $1.49 | 2d | 1 | 0.37mi |
| 2112 Patterson Rd Dayton, OH | 3.0 | 1.0 | 1008 | $1,425 | $1.41 | 2d | 1 | 0.43mi |
| 3311 S Smithville Rd Dayton, OH | 3.0 | 1.0 | 1019 | $1,295 | $1.27 | 43d | 1 | 0.49mi |
| 2850 Hazel Ave Unit 1496064P Dayton, OH | 3.0 | 2.0 | 850 | $6,259 | $7.36 | 18d | 1 | 0.57mi |
| 1238 Colwick Dr Dayton, OH | 2.0 | 1.0 | 786 | $1,250 | $1.59 | 11d | 1 | 0.70mi |
| 1121 Colwick Dr Dayton, OH | 3.0 | 2.0 | 1272 | $1,875 | $1.47 | 21d | 1 | 0.83mi |
| 2212 Farmside Dr Dayton, OH | 3.0 | 1.0 | 1008 | $1,395 | $1.38 | 43d | 1 | 0.84mi |
| 2526 Kennedy Ave Dayton, OH | 3.0 | 1.0 | 1232 | $1,300 | $1.06 | 43d | 1 | 0.88mi |
| 1934 Farmside Dr Dayton, OH | 3.0 | 1.0 | 1008 | $1,395 | $1.38 | 43d | 1 | 0.90mi |
| 2274 Broadmoor Dr Dayton, OH | 3.0 | 1.5 | 1188 | $2,145 | $1.81 | 2d | 1 | 0.95mi |
| 906 Nordale Ave Dayton, OH | 3.0 | 2.0 | 1262 | $2,200 | $1.74 | 43d | 1 | 0.98mi |
| 2820 Harvey Ave Dayton, OH | 2.0 | 1.0 | 900 | $1,350 | $1.50 | 43d | 1 | 1.12mi |
| 1059 Wilmington Ave Unit 1059 1 Dayton, OH | 3.0 | 1.5 | 1100 | $1,495 | $1.36 | 43d | 1 | 1.17mi |
| 1053 Wilmington Ave Dayton, OH | 2.0–3.0 | 1.0–1.5 | 1025 | $1,495 | $1.46 | 2d | 5 | 1.18mi |
| 2974 Woodman Dr Dayton, OH | 3.0 | 1.0 | 864 | $1,625 | $1.88 | 14d | 1 | 1.19mi |
| 809 Patterson Rd Dayton, OH | 2.0 | 1.0–1.5 | 895 | $1,075 | $1.20 | 2d | 7 | 1.20mi |
| 2212 Fauver Ave Dayton, OH | 3.0 | 1.0 | 1300 | $1,795 | $1.38 | 43d | 1 | 1.31mi |
| 933 Wilmington Ave Dayton, OH | 1.0–2.0 | 1.0–1.5 | 802 | $980 | $1.22 | 3d | 8 | 1.37mi |
| 2416 Brookline Ave Dayton, OH | 2.0 | 1.0 | 806 | $895 | $1.11 | 2d | 1 | 1.37mi |
| 922 Wilmington Ave Dayton, OH | 2.0 | 1.0 | 720 | $1,200 | $1.67 | 23d | 1 | 1.38mi |
| 440 Lonsdale Ave #1 Dayton, OH | 2.0 | 1.0 | 1050 | $1,450 | $1.38 | 11d | 1 | 1.39mi |
| 1901 Shroyer Rd Oakwood, OH | 2.0 | 2.0 | 1262 | $2,000 | $1.58 | 2d | 1 | 1.41mi |
| 2105 Shroyer Rd Oakwood, OH | 3.0 | 2.0 | 1453 | $2,150 | $1.48 | 2d | 1 | 1.44mi |
| 563 Broad Blvd Dayton, OH | 3.0 | 2.0 | 1410 | $2,100 | $1.49 | 11d | 1 | 1.46mi |
| 4253 Pleasant View Ave Dayton, OH | 3.0 | 2.0 | 1440 | $1,695 | $1.18 | 43d | 1 | 1.49mi |
| 4249 Pleasant View Ave Dayton, OH | 3.0 | 2.0 | 1440 | $1,695 | $1.18 | 43d | 1 | 1.49mi |
Listing history 3 events
-
2026-04-29status Pending
-
2026-04-26price $191,000
-
2026-04-15$196,000 Active
ⓘ Source: listings_history table (triggers on properties + properties_extension) + one-shot
backfill from property_details.listing_events for pre-trigger history.
Tax reassessment forecast OH · Partial reset (capped growth)
- Current annual tax
- $1,930 · $161/mo
- Projected year-2 tax
- $2,455 · $205/mo
- Expected delta
- +$525/yr (+$44/mo · 27.2%)
ⓘ Screening estimate from a state-policy table — verify with the county assessor before closing.
Climate risk First Street
- Flood 1/10 Low FEMA zone X (unshaded) · 0% chance over 30 yrs
- Wildfire 1/10 Low
- Heat 3/10 Moderate 7 d/yr ≥100°F today · 18 d/yr by 30 yrs out
- Wind 2/10 Low 0% chance of damaging wind over 30 yrs
- Air quality 3/10 Moderate 2 unhealthy d/yr today · 3 by 30 yrs out
Nearby sold comps map
Loading sold comps map…
Walkable amenities ~0.75 mi
Loading nearby amenities…
Taxation est. · year 1
- Rental income
- $17,845
- − Mortgage interest
- −$10,699
- − Property taxes
- −$1,930
- − Insurance
- −$955
- − Repairs & maintenance
- −$1,428
- − Management
- −$1,428
- − Depreciation
- −$5,556
- Taxable loss
- −$4,151
- Est. tax savings @ 24.0%
- +$996
- After-tax cash flow
- $189/yr
For passive investors: Depreciation is non-cash, so a rental often shows a tax loss while cash-flowing — sheltering income. Rental losses are passive: they offset passive income freely, and up to $25,000/yr can offset ordinary (W-2) income if you actively participate and your MAGI is under $100k (phasing out to $0 by $150k); unused losses carry forward. On sale, claimed depreciation is recaptured at up to 25%, and gains may owe capital-gains tax (a 1031 exchange can defer both). Figures are a year-1 estimate at your 24.0% rate — not tax advice; consult a CPA.
Schools (NCES district)
- District
- Kettering City School District
- NCES district ID
- 3904418
- Math proficiency
- 54% ▼ -21.00%
- Reading proficiency
- 68% ▼ -9.00%
- Median HH income
- $50,353
- Composite
- 51.89/100
- National rank
- #1653
- State rank
- #277 of 656 in OH
Livability — Kettering
- Score
- 83/100
- State rank
- #61
- US rank
- #922
Category grades
Schools grade is shown separately in the Schools card above.
Census & demographics
- Census place
- Kettering, OH
- County
- Montgomery County · 459,541 people
- City population
- 73,116
- Metro
- Dayton-Kettering, OH
- Population (ZIP)
- 24,411
- Household income
- $60,588
- Rent vs Own
- Severe rent burden
- 856.0
Population outlook (Montgomery County) Hauer SSP2
- Today (2025)
- 523,241 people
- By 2030
- 514,948 · -1.6%
- By 2040
- 493,378 · -5.7%
- By 2050
- 469,639 · -10.2%
- By 2075
- 418,360 · -20.0%
- By 2100
- 353,315 · -32.5%
Race, ethnicity, and origin ACS 2023
- Neighborhood character
- Predominantly White (83%)
- Race & ethnicity
- White 83% Black 7% Two or more races 6% Hispanic / Latino 3% Asian 3%
- Common ancestry
- Lithuanian 3% Slovak 2% Italian 2%
- Foreign-born
- 7% · Canada, China
- Languages at home
- 93% English-only · Other Indo-European 2% Spanish 2% Chinese 0%
Political lean MEDSL · Montgomery
- 2024 margin
- Toss-up / Even · D 49.8% · R 49.3%
- 2008→2024 swing
- -5.8pp toward R · 2008: 6.2pp · 2024: 0.5pp
- All cycles
- 2024: D+0.5 2020: D+2.2 2016: R+1.2 2012: D+3.1 2008: D+6.2
Not yet ingested
- Civics
- —
Market trends
- HPI YoY
- ▼ -192.56%
- Current HPI
- 241.6543
- Rent YoY
- ▲ 4.82%
- Metro
- Dayton-Kettering, OH
- State GDP YoY
- ▲ 1.98%
- F500 in state
- 48
Industry mix (Fortune 500 HQ in OH)
| Industry | F500 HQs | Revenue |
|---|---|---|
| Insurance | 3 | $145B |
|
||
| Industrial Machinery | 3 | $49B |
|
||
| Financial Services | 3 | $24B |
|
||
| Consumer Goods | 2 | $93B |
|
||
| Aerospace / Defense | 2 | $47B |
|
||
| Utilities | 2 | $33B |
|
||
Price history
-2.6% since first listed3 events — show timeline
- 2026-04-29 Pending — Dayton MLS
- 2026-04-26 Price Changed $191,000 Dayton MLS
- 2026-04-15 Listed $196,000 Dayton MLS
Property tax history
+2.1%/yrLatest (2025): $1,930 · -1.3% YoY. Source: county tax records.
Cash-flow waterfall
monthlySold comps — $/sqft
last 12 mo · ≤1 miLoading sold comps…