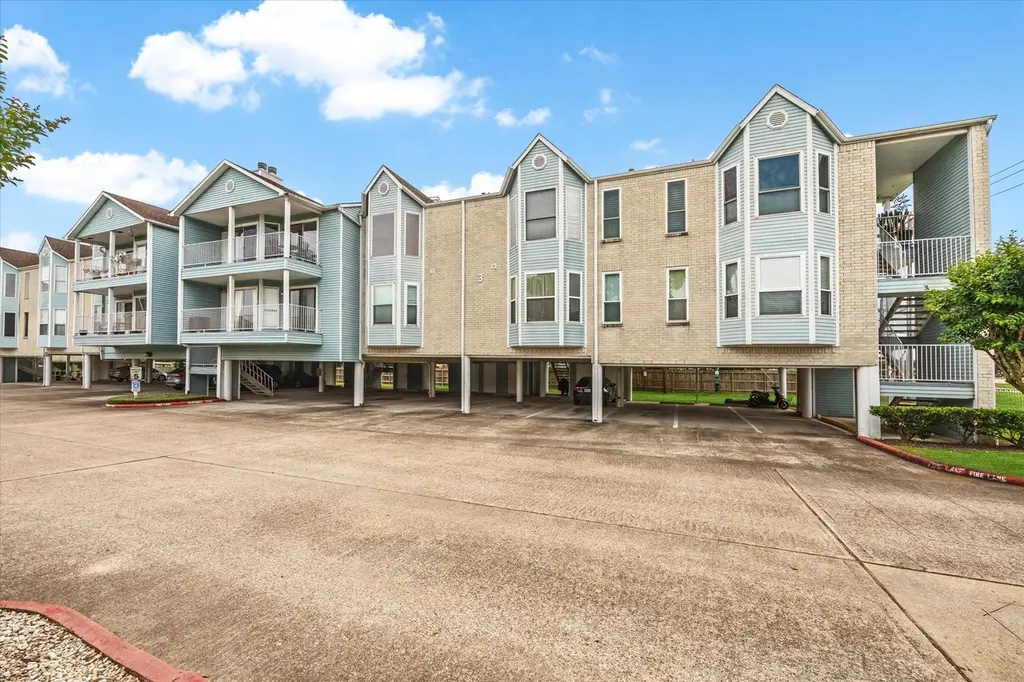
18617 Egret Bay Blvd #308 · Webster, TX
Flood risk 10/10 · Severe
- FEMA flood zone
- AE
- Chance of flooding over 30 yrs
- 0.99%
- Est. flood insurance / yr
- $1,737 – $8,500
Fire risk 1/10 · Minimal
- Est. fire insurance / yr
- $1,222 – $2,270
Heat risk 10/10 · Severe
- Hot days now (above 109°F)
- 7 days/yr
- Hot days in 30 yrs
- 25 days/yr
Wind risk 9/10 · Severe
- Chance of severe wind over 30 yrs
- 99.0%
Air-quality risk 2/10 · Minimal
- Unhealthy air days now
- 1 days/yr
- Unhealthy air days in 30 yrs
- 1 days/yr
Risk factors via First Street. Map © Google.
Why this score? — see what drove the D grade
The composite is a weighted blend of 9 inputs, each scored 0–100. Each bar is that input's sub-score; the figure is the points it added to the 100-point composite (weight × sub-score).
- ARV discount +15.0/15.0
- 1% rule +6.9/10.0
- Cash flow +4.8/30.0
- Schools +4.6/10.0
- Appreciation +4.4/10.0
- Livability +3.5/5.0
- Rent growth +3.0/5.0
- Condition / age +2.5/5.0
- DSCR +0.0/10.0
$92,500
🖨 Deal sheet 📄 Offer letter ✓ Due diligence
Listing remarks MLS
Welcome to 18716 Egret Bay Blvd Unit 308 — a cozy, updated 1-bedroom, 1-bathroom FURNISHED (including washer and dryer) condo perfectly situated in the heart of Clear Lake. Whether you're looking for a low-maintenance home, a weekend getaway, or an investment opportunity, this location offers the best of convenience and leisure. Enjoy close proximity to NASA’s Johnson Space Center, Baybrook Mall, Clear Lake marinas, the Kemah Boardwalk, and a full array of waterfront dining and entertainment options. This third-floor unit offers a comfortable living space, a spacious bedroom, and a private balcony perfect for relaxing after a day exploring all the area has to offer. Community amenities include waterfront access, private boat dock, a sparkling pool, and 2 assigned covered parking spaces. Easy access to major highways makes commuting into Houston or heading to Galveston Island a breeze. Don't miss your chance to own a piece of this vibrant, waterfront community!
Key facts
- Private boat dock
- Updated condo
- Private balcony
Tags
Neighborhood map
What this means for you Summary
Snapshot
- This is a 1-bed/1.0-bath condo listed at $92k.
Deal economics
- At list price, monthly cash flow is $-651 ($-8k/yr) — negative.
- To cash-flow at today's rent, offer at most $10k (89.1% below list).
- Meets the 1% rule at list price ($1k rent vs $92k).
- Recommended offer: $10k (89.1% below list) — sets the bar for cash-flow.
- Cap rate 3.4% vs local median 0.7% in Webster — top-decile yield for the area; either an underpriced asset or a hidden risk that comps aren't pricing in. Stress-test before assuming the spread holds.
Location & tenants
- Location reads 69/100 on livability (#433 in TX) — a middle-class / working-renter tenant base. Strengths: cost of living A+, housing A+, health & safety A-; Watch: schools D+, employment D+, crime F.
- Clear Creek ISD (suburban): math 48% / reading 54% proficiency, ranked #114 of 826 in TX (top 14%) — acceptable for families but not a draw, mixed tenant base, ~2y average lease.
- Market conditions: Rents rising (+1.9%/yr); 133 active listings in the ZIP; 40 comparable units currently listed for rent nearby; rentals leasing fast (median 10d on market — plan ~1-2 weeks tenant-placement turnaround); 29,883 units permitted in Harris County in 2024 (8,621 in 5+ unit buildings).
Forward outlook
- Local home prices are declining (-1.2%/yr); year-one equity from $640 of loan paydown is wiped out by about $1k of value loss. Plan a longer hold.
- Harris County population projected at +47% by 2050 — long-run rental-demand tailwind backs the buy-and-hold thesis.
Negotiation context
- It's been on market 137 days — a 12% lower offer ($81k) is reasonable based on typical stale-listing flexibility.
- 7 sale attempts since 18y ago with the ask held roughly flat each time — persistent listings suggest the price (not the market) is what's stuck; bring a comps-based counter.
Risks & watch-outs
- Watch-outs: property tax is 2.6% of price; flood insurance adds $427/mo; HOA is 34% of rent.
- Climate carrying-cost: in FEMA flood zone AE (mandatory federal flood insurance); severe wind risk, 99% chance of damaging wind over 30y; extreme-heat days projected 7→25/yr by 2055 (HVAC capex compounding) — expect insurance premiums to compound above CPI over the hold.
Questions for the listing agent
- What do current leases actually rent for vs. the listed asking? Can we see a recent rent roll and the last 12 months of T-12 income?
- It's been on market 137 days. Have you received any prior offers? Is the seller open to a 89% concession, seller financing, or rate buy-down credit?
- Property tax is high relative to price — has the assessment been appealed recently, and will the sale trigger a re-assessment?
- What's the actual annual flood-insurance premium (NFIP or private), and is the property in a SFHA with mandatory coverage?
- What does the HOA fee cover, when was the last increase, and are there any pending special assessments or reserve-fund shortfalls?
- Any open or pending special assessments — roof, HVAC, plumbing, elevator, façade? What's the per-unit balance and payoff schedule, and is the seller paying it off at close or rolling it to the buyer?
- Why hasn't it sold? Are there any deal-killer items the seller is aware of (foundation, flood, title, zoning, code violations)?
- Is there a deadline driving the sale (1031 exchange, divorce, estate, relocation)? That informs how much negotiation room exists.
- Schools are D-rated, which usually means shorter tenancies and higher turnover. Who's the typical renter profile here, and what's been the actual vacancy rate?
- Crime grade is F in this area — have there been break-ins, vandalism, or insurance claims at this property in the last 3 years? What carrier currently insures it and at what premium?
- The area grade is low — what's the realistic commute time and amenity access for the typical tenant pool here? Any planned neighborhood developments (good or bad) we should know about?
- What's the average days-on-market for RENTAL listings here right now (not sales)? A rising rental-DOM trend means longer vacancies and softer asking-rent achievability than the comps imply.
- What's the recent tenant-quality profile in this submarket — average credit score on applications, eviction rate, late-payment / NSF rate, and stable-employment percentage? A property-management company in the area should have these aggregated.
- How much new apartment / multifamily construction is in the pipeline within 1–3 miles? Heavy new supply (>2% of stock underway) typically softens rents 12–24 months out; light construction supports rent growth.
Investment metrics
- 1% rule
- 1.19% ✓
- Cap rate
- 3.38%
- Cash-on-cash
- -10.41%
- DSCR
- 0.54
- GRM
- 7.0
CMA / ARV
- ARV (median comp)
- $127,788
- List price
- $92,500
- Delta
- -27.61%
- Verdict
- UNDERPRICED
- Comps
- 20 within 1.0 mi
Projected returns pro-forma
-1.22% appreciation · 1.92% rent growth · sell at horizon
- IRR
- -51.6%
- Equity multiple
- -0.93×
- Total profit
- $-49,982
- Equity at exit
- $21,364
- IRR
- -52.9%
- Equity multiple
- -2.58×
- Total profit
- $-92,823
- Equity at exit
- $21,622
Cash invested: $25,900 (down + closing). Projections, not guarantees.
Landlord ↔ Tenant lean methodology
- Overall (STATE)
- 87 Strongly Landlord-Friendly
- State Texas
- 87 Strongly Landlord-Friendly · R+5
- County
- — inherits STATE
- City
- — inherits STATE
ZIP-level market 77058
- Home prices YoY
- -0.5%
- Rents YoY
- 1.9%
- Active inventory
- 133
- Price-to-rent
- 7.0×
Monthly cashflow live
- Estimated rent
- $1,105 high interval (Pro) →
- Mortgage (P&I)
- −$485
- Tax from tax record
- −$197 /mo · $2,367/yr
- Insurance
- −$39
- Flood insurance flood zone
- −$427 /mo · $5,118/yr
- HOA
- −$377
- Vacancy / Maint / Mgmt
- −$232
- Net cashflow
- $-651
Break-even live
UW: 25.0% down · 7.5% · 30yr · 1.5% tax · 5.0% vac · 8.0% maint · 8.0% mgmt
Financing live
Cash to close
- Down payment
- $23,125
- Closing costs
- $2,775
- Reserves months
- —
- Total cash needed
- —
Loan-product check · same deal, 3 products live
Conventional
25% down · 7.5% · 30yr
- Down + closing
- —
- Monthly P&I
- —
- Monthly cashflow
- —
- DSCR
- —
- Eligible?
- —
Personal DTI + credit; lowest rate.
DSCR
20% down · 8.5% · 30yr
- Down + closing
- —
- Monthly P&I
- —
- Monthly cashflow
- —
- DSCR
- —
- Eligible?
- —
No personal income docs; deal must DSCR.
Hard money
10% down · 12.0% · 12mo
- Down + closing
- —
- Monthly P&I
- —
- Monthly cashflow
- —
- DSCR
- —
- Eligible?
- —
Short-term bridge; refi at stabilization.
Rent comps 40 comps
| Address | Beds | Baths | Sqft | Rent | $/sqft | DOM | Units | Dist |
|---|---|---|---|---|---|---|---|---|
| 18800 Egret Bay Blvd Houston, TX | 1.0 | 1.0 | 656 | $1,148 | $1.75 | 43d | 2 | 0.26mi |
| 900 Henderson Ave Houston, TX | 1.0–2.0 | 1.0–2.0 | 839 | $1,130 | $1.35 | 1d | 43 | 0.37mi |
| 200 Water St Webster, TX | 1.0–3.0 | 1.0–2.0 | 1094 | $1,209 | $1.11 | 1d | 38 | 0.61mi |
| 18101 Point Lookout Dr Houston, TX | 1.0–2.0 | 1.0–2.0 | 1000 | $1,890 | $1.89 | 20d | 15 | 0.63mi |
| 1235 E Nasa Pkwy Houston, TX | 1.0–3.0 | 1.0–3.0 | 1252 | $1,460 | $1.17 | 1d | 31 | 0.64mi |
| 1315 E NASA Pkwy Houston, TX | 1.0–3.0 | 1.0–2.5 | 1214 | $795 | $0.65 | 1d | 37 | 0.67mi |
| 18101 Point Lookout Dr Unit 18122 Houston, TX | 1.0 | 1.0 | 741 | $1,340 | $1.81 | 43d | 1 | 0.69mi |
| 18101 Point Lookout Dr Unit 18116 Houston, TX | 1.0 | 1.0 | 741 | $1,345 | $1.82 | 12d | 1 | 0.69mi |
| 18101 Point Lookout Dr Unit 18116 Houston, TX | 1.0 | 1.0 | 741 | $1,317 | $1.78 | 2d | 1 | 0.69mi |
| 18101 Point Lookout Dr Apt 324 Houston, TX | 1.0 | 1.0 | 741 | $1,320 | $1.78 | 7d | 1 | 0.69mi |
| 18101 Point Lookout Dr Unit 1174 Houston, TX | 1.0 | 1.0 | 741 | $1,309 | $1.77 | 12d | 1 | 0.69mi |
| 1110 El Camino Village Dr Houston, TX | 1.0–3.0 | 1.0–2.5 | 1143 | $840 | $0.73 | 1d | 76 | 0.74mi |
| 17700 El Camino Real Unit 147 Houston, TX | 1.0 | 1.0 | 419 | $940 | $2.24 | 10d | 1 | 0.80mi |
| 801 E Nasa Road 1 Webster, TX | 1.0–2.0 | 1.0 | 827 | $799 | $0.97 | 43d | 39 | 0.83mi |
| 801 E Nasa Pkwy Unit 324 Webster, TX | 1.0 | 1.0 | 730 | $969 | $1.33 | 7d | 1 | 0.87mi |
| 801 E Nasa Pkwy Unit 875 Webster, TX | 1.0 | 1.0 | 730 | $1,008 | $1.38 | 10d | 1 | 0.87mi |
| 801 E Nasa Pkwy Unit 1112 Webster, TX | 1.0 | 1.0 | 730 | $966 | $1.32 | 2d | 1 | 0.87mi |
| 801 E Nasa Pkwy Unit 822 Webster, TX | 1.0 | 1.0 | 669 | $984 | $1.47 | 12d | 1 | 0.87mi |
| 801 E Nasa Pkwy Unit 1162 Webster, TX | 1.0 | 1.0 | 730 | $969 | $1.33 | 5d | 1 | 0.87mi |
| 801 E Nasa Pkwy Unit 852 Webster, TX | 1.0 | 1.0 | 669 | $979 | $1.46 | 43d | 1 | 0.87mi |
| 17700 El Camino Real Houston, TX | 3.0 | 1.0–2.0 | 827 | $1,149 | $1.39 | 19d | 17 | 0.88mi |
| 17700 El Camino Real Unit 17721 Houston, TX | 1.0 | 1.0 | 649 | $919 | $1.42 | 12d | 1 | 0.88mi |
| 17700 El Camino Real Unit 1162 Houston, TX | 1.0 | 1.0 | 649 | $884 | $1.36 | 5d | 1 | 0.88mi |
| 17700 El Camino Real Unit 17751 Houston, TX | 1.0 | 1.0 | 649 | $873 | $1.35 | 12d | 1 | 0.88mi |
| 17700 El Camino Real Unit 324 Houston, TX | 1.0 | 1.0 | 649 | $884 | $1.36 | 7d | 1 | 0.88mi |
| 17700 El Camino Real Unit 17742 Houston, TX | 1.0 | 1.0 | 419 | $897 | $2.14 | 2d | 1 | 0.88mi |
| 17700 El Camino Real Unit 17721 Houston, TX | 1.0 | 1.0 | 649 | $881 | $1.36 | 2d | 1 | 0.88mi |
| 17632 El Camino Real Houston, TX | 1.0 | 1.0 | 649 | $925 | $1.43 | 43d | 1 | 0.89mi |
| 17632 El Camino Real Houston, TX | 1.0 | 1.0 | 649 | $925 | $1.43 | 18d | 1 | 0.89mi |
| 2041 San Sebastian Ct Unit 1047 Houston, TX | 1.0 | 1.0 | 728 | $814 | $1.12 | 10d | 1 | 0.89mi |
| 2041 San Sebastian Ct Unit 2092 Houston, TX | 1.0 | 1.0 | 728 | $763 | $1.05 | 12d | 1 | 0.89mi |
| 2041 San Sebastian Ct Unit 2115 Houston, TX | 1.0 | 1.0 | 728 | $809 | $1.11 | 12d | 1 | 0.89mi |
| 2041 San Sebastian Ct Unit 2115 Houston, TX | 1.0 | 1.0 | 728 | $771 | $1.06 | 2d | 1 | 0.89mi |
| 2041 San Sebastian Ct Unit 1162 Houston, TX | 1.0 | 1.0 | 728 | $774 | $1.06 | 7d | 1 | 0.89mi |
| 2010 San Sebastian Ct Houston, TX | 1.0 | 1.0 | 690 | $1,049 | $1.52 | 43d | 1 | 0.93mi |
| 1400 El Camino Village Dr Houston, TX | 1.0–2.0 | 1.0–2.0 | 1060 | $1,279 | $1.21 | 1d | 34 | 0.94mi |
| 501 Sarah Deel Dr Apt 324 Webster, TX | 1.0 | 1.0 | 737 | $1,301 | $1.77 | 7d | 1 | 1.02mi |
| 501 Sarah Deel Dr Unit 1162 Webster, TX | 1.0 | 1.0 | 737 | $1,301 | $1.77 | 5d | 1 | 1.02mi |
| 501 Sarah Deel Dr Unit 0522 Webster, TX | 1.0 | 1.0 | 737 | $1,298 | $1.76 | 2d | 1 | 1.03mi |
| 501 Sarah Deel Dr Unit 0522 Webster, TX | 1.0 | 1.0 | 737 | $1,336 | $1.81 | 12d | 1 | 1.03mi |
HOA detail condo
- Monthly dues
- $377 · $4,524/yr
- Likely covers
- waterpool
- Assessments
- None detected in remarks — confirm with the listing agent.
Listing history 26 events
-
2026-06-09status $92,500 Pending 137 DOM
-
2026-06-08days on market $92,500 Active 137 DOM
-
2026-06-07days on market $92,500 Active 136 DOM
-
2026-06-04days on market $92,500 Active 133 DOM
-
2026-06-03days on market $92,500 Active 132 DOM
-
2026-06-02days on market $92,500 Active 131 DOM
-
2026-06-01days on market $92,500 Active 130 DOM
-
2026-05-31days on market $92,500 Active 129 DOM
-
2026-01-22$92,500 Active 995-char remark
Show marketing remark (995 chars)
Welcome to 18716 Egret Bay Blvd Unit 308 — a cozy, updated 1-bedroom, 1-bathroom FURNISHED (including washer and dryer) condo perfectly situated in the heart of Clear Lake. Whether you're looking for a low-maintenance home, a weekend getaway, or an investment opportunity, this location offers the best of convenience and leisure. Enjoy close proximity to NASA’s Johnson Space Center, Baybrook Mall, Clear Lake marinas, the Kemah Boardwalk, and a full array of waterfront dining and entertainment options. This third-floor unit offers a comfortable living space, a spacious bedroom, and a private balcony perfect for relaxing after a day exploring all the area has to offer. Community amenities include waterfront access, private boat dock, a sparkling pool, and 2 assigned covered parking spaces. Easy access to major highways makes commuting into Houston or heading to Galveston Island a breeze. Don't miss your chance to own a piece of this vibrant, waterfront community!
-
2025-12-19historical $1,595
-
2025-12-18historical
-
2025-10-09$1,595
-
2025-07-25price $124,900
-
2025-05-02$129,000 Active
-
2025-04-29historical
-
2012-11-29soldstatus
-
2012-10-15historical
-
2012-09-21historical
-
2012-09-20$46,900
-
2012-03-13$70,000
-
2008-10-31historical
-
2008-06-02$64,900
-
2008-05-21historical
-
2008-01-21$64,900
-
2005-11-28soldstatus
-
1988-10-03soldstatus
ⓘ Source: listings_history table (triggers on properties + properties_extension) + one-shot
backfill from property_details.listing_events for pre-trigger history.
Tax reassessment forecast TX · Resets to sale price
- Current annual tax
- $2,367 · $197/mo
- Projected year-2 tax
- $2,367 · $197/mo
- Expected delta
- $0/yr ($0/mo · 0.0%)
ⓘ Screening estimate from a state-policy table — verify with the county assessor before closing.
Climate risk First Street
- Flood 10/10 Extreme FEMA zone AE · 99% chance over 30 yrs
- Wildfire 1/10 Low
- Heat 10/10 Extreme 7 d/yr ≥109°F today · 25 d/yr by 30 yrs out
- Wind 9/10 Extreme 99% chance of damaging wind over 30 yrs
- Air quality 2/10 Low 1 unhealthy d/yr today · 1 by 30 yrs out
Nearby sold comps map
Loading sold comps map…
Walkable amenities ~0.75 mi
Loading nearby amenities…
Taxation est. · year 1
- Rental income
- $13,262
- − Mortgage interest
- −$5,181
- − Property taxes
- −$2,367
- − Insurance
- −$5,581
- − Repairs & maintenance
- −$1,061
- − Management
- −$1,061
- − HOA
- −$4,524
- − Depreciation
- −$2,691
- Taxable loss
- −$9,204
- Est. tax savings @ 24.0%
- +$2,209
- After-tax cash flow
- $-5,607/yr
For passive investors: Depreciation is non-cash, so a rental often shows a tax loss while cash-flowing — sheltering income. Rental losses are passive: they offset passive income freely, and up to $25,000/yr can offset ordinary (W-2) income if you actively participate and your MAGI is under $100k (phasing out to $0 by $150k); unused losses carry forward. On sale, claimed depreciation is recaptured at up to 25%, and gains may owe capital-gains tax (a 1031 exchange can defer both). Figures are a year-1 estimate at your 24.0% rate — not tax advice; consult a CPA.
Schools (NCES district)
- District
- Clear Creek ISD
- NCES district ID
- 4814280
- Math proficiency
- 48% ▼ -10.00%
- Reading proficiency
- 54% ▼ -4.00%
- Median HH income
- $80,240
- Composite
- 46.49/100
- National rank
- #2431
- State rank
- #114 of 826 in TX
Livability — Webster
- Score
- 69/100
- State rank
- #433
- US rank
- #8911
Category grades
Schools grade is shown separately in the Schools card above.
Census & demographics
- Census place
- Webster, TX
- County
- Harris County · 4,702,590 people
- City population
- 26,638
- Metro
- Houston-The Woodlands-Sugar Land, TX
- Population (ZIP)
- 17,850
- Household income
- $68,722
- Rent vs Own
- Severe rent burden
- 1147.0
Population outlook (Harris County) Hauer SSP2
- Today (2025)
- 5,571,493 people
- By 2030
- 6,089,821 · +9.3%
- By 2040
- 7,142,806 · +28.2%
- By 2050
- 8,185,864 · +46.9%
- By 2075
- 10,574,329 · +89.8%
- By 2100
- 12,109,958 · +117.4%
Race, ethnicity, and origin ACS 2023
- Neighborhood character
- Diverse neighborhood (Simpson 0.64)
- Race & ethnicity
- White 55% Hispanic / Latino 21% Two or more races 15% Asian 10% Black 5%
- Hispanic origin (detail)
- Mexican 14% Puerto Rican 1%
- Common ancestry
- Italian 6% Lithuanian 3% Portuguese 2%
- Foreign-born
- 21% · Canada, Vietnam, China
- Languages at home
- 70% English-only · Spanish 15% Other Indo-European 5% Vietnamese 2%
Political lean MEDSL · Harris
- 2024 margin
- Lean D (+5.5) · D 52.0% · R 46.4% · Other 1.6%
- 2008→2024 swing
- +3.9pp toward D · 2008: 1.6pp · 2024: 5.5pp
- All cycles
- 2024: D+5.5 2020: D+13.3 2016: D+12.4 2012: D+0.1 2008: D+1.6
Not yet ingested
- Civics
- —
Market trends
- HPI YoY
- ▼ -1.22%
- Current HPI
- 225.0251
- Rent YoY
- ▲ 1.92%
- Metro
- Houston-The Woodlands-Sugar Land, TX
- State GDP YoY
- ▲ 3.95%
- F500 in state
- 110
Industry mix (Fortune 500 HQ in TX)
| Industry | F500 HQs | Revenue |
|---|---|---|
| Energy | 16 | $1,198B |
|
||
| Technology | 5 | $198B |
|
||
| Engineering / Construction | 4 | $72B |
|
||
| Energy Services | 3 | $60B |
|
||
| Utilities | 3 | $41B |
|
||
| Healthcare | 2 | $330B |
|
||
Price history
+42.5% since first listed18 events — show timeline
- 2026-01-22 Listed $92,500 HARMLS
- 2025-12-19 Rental Removed $1,595 HARMLS
- 2025-12-18 Listing Removed — HARMLS
- 2025-10-09 Listed for Rent $1,595 HARMLS
- 2025-07-25 Price Changed $124,900 HARMLS
- 2025-05-02 Listed $129,000 HARMLS
- 2025-04-29 Coming Soon — HARMLS
- 2012-11-29 Sold (MLS) — HARMLS
- 2012-10-15 Listing Removed — HARMLS
- 2012-09-21 Listing Removed — HARMLS
- 2012-09-20 Listed $46,900 HARMLS
- 2012-03-13 Listed $70,000 HARMLS
- 2008-10-31 Listing Removed — HARMLS
- 2008-06-02 Listed $64,900 HARMLS
- 2008-05-21 Listing Removed — HARMLS
- 2008-01-21 Listed $64,900 HARMLS
- 2005-11-28 Sold (Public Records) — Public Records
- 1988-10-03 Sold (Public Records) — Public Records
Property tax history
+3.7%/yrLatest (2025): $2,367 · -8.5% YoY. Source: county tax records.
Cash-flow waterfall
monthlySold comps — $/sqft
last 12 mo · ≤1 miLoading sold comps…