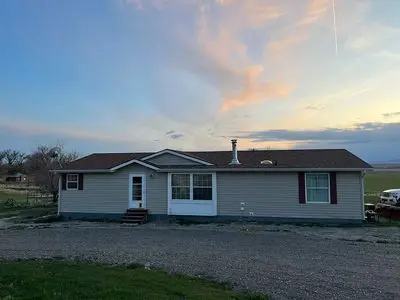
4095 Buffalo Jump Rd · Logan, MT
Flood risk 1/10 · Minimal
- FEMA flood zone
- D
- Chance of flooding over 30 yrs
- 0.0%
- Est. flood insurance / yr
- $544 – $1,084
Fire risk 4/10 · Minor
- Est. fire insurance / yr
- $918 – $1,706
Heat risk 3/10 · Minor
- Hot days now (above 89°F)
- 7 days/yr
- Hot days in 30 yrs
- 16 days/yr
Wind risk 1/10 · Minimal
- Chance of severe wind over 30 yrs
- —
Air-quality risk 5/10 · Moderate
- Unhealthy air days now
- 7 days/yr
- Unhealthy air days in 30 yrs
- 8 days/yr
Risk factors via First Street. Map © Google.
Why this score? — see what drove the B- grade
The composite is a weighted blend of 9 inputs, each scored 0–100. Each bar is that input's sub-score; the figure is the points it added to the 100-point composite (weight × sub-score).
- Cash flow +30.0/30.0
- 1% rule +10.0/10.0
- DSCR +10.0/10.0
- ARV discount +7.5/15.0
- Schools +3.3/10.0
- Rent growth +2.5/5.0
- Livability +2.1/5.0
- Condition / age +1.0/5.0
- Appreciation +0.0/10.0
$135,000
🖨 Deal sheet (PDF) 📄 Offer letter ✓ Due diligence
Key facts
- Updated appliances
- Wood stove
- Walk-in closet
Tags
Neighborhood map
What this means for you Summary
Snapshot
- This is a 3-bed/2.0-bath other listed at $135k. Condition is rated poor.
Deal economics
- At list price, monthly cash flow is $971 ($12k/yr) — positive.
- The deal already cash-flows at list — no discount required.
- Meets the 1% rule at list price ($2k rent vs $135k).
- Recommended offer: $133k (1.5% below list) — sets the bar for market timing.
Location & tenants
- Location reads 42/100 on livability (#354 in MT) — a working-class tenant base; expect higher turnover. Strengths: cost of living A+, crime A; Watch: health & safety C-, schools F, amenities F.
- Three Forks H S (rural): math 20% / reading 50% proficiency, ranked #174 of 339 in MT (top 51%) — families likely to look elsewhere, expect single-tenant / working-renter base with shorter leases.
- Market conditions: 149 active listings in the ZIP; 1,706 units permitted in Gallatin County in 2024 (533 in 5+ unit buildings).
Forward outlook
- Local home prices are declining (-3.0%/yr); year-one equity from $933 of loan paydown is wiped out by about $4k of value loss. Plan a longer hold.
- Gallatin County population projected at +61% by 2050 — long-run rental-demand tailwind backs the buy-and-hold thesis.
- At projected returns (-3.0% appreciation + 3.0% rent growth), your $38k cash investment doubles in ~4 years — after that, you're playing with house money.
Negotiation context
- It's been on market 24 days — a 2% lower offer ($133k) is reasonable based on typical stale-listing flexibility.
Questions for the listing agent
- Have any recent inspections been done? Can we get a copy of the seller's disclosures and any deferred-maintenance estimates?
- Is there a deadline driving the sale (1031 exchange, divorce, estate, relocation)? That informs how much negotiation room exists.
- Schools are F-rated, which usually means shorter tenancies and higher turnover. Who's the typical renter profile here, and what's been the actual vacancy rate?
- What's the average days-on-market for RENTAL listings here right now (not sales)? A rising rental-DOM trend means longer vacancies and softer asking-rent achievability than the comps imply.
- What's the recent tenant-quality profile in this submarket — average credit score on applications, eviction rate, late-payment / NSF rate, and stable-employment percentage? A property-management company in the area should have these aggregated.
- How much new for-sale + rental construction is in the pipeline within 1–3 miles? Heavy new supply typically softens prices + rents 12–24 months out; constrained supply supports both.
Investment metrics
- 1% rule
- 1.78% ✓
- Cap rate
- 14.92%
- Cash-on-cash
- 30.81%
- DSCR
- 2.37
- GRM
- 4.7
CMA / ARV
No comps found within radius.
Projected returns pro-forma
-3.0% appreciation · 3.0% rent growth · sell at horizon
- IRR
- 25.6%
- Equity multiple
- 2.06×
- Total profit
- $39,973
- Equity at exit
- $20,129
- IRR
- 33.3%
- Equity multiple
- 4.03×
- Total profit
- $114,549
- Equity at exit
- $11,672
Cash invested: $37,800 (down + closing). Projections, not guarantees.
Landlord ↔ Tenant lean methodology
- Overall (STATE)
- 82 Strongly Landlord-Friendly
- State Montana
- 82 Strongly Landlord-Friendly · R+11
- County
- — inherits STATE
- City
- — inherits STATE
ZIP-level market 59752
- Home prices YoY
- -27.6%
- Active inventory
- 149
- Price-to-rent
- 4.7×
Monthly cashflow live
- Estimated rent
- $2,409 medium interval (Pro) →
- Mortgage (P&I)
- −$708
- Tax est. 1.5%
- −$169 /mo · $2,025/yr
- Insurance
- −$56
- HOA
- −$0
- Vacancy / Maint / Mgmt
- −$506
- Net cashflow
- $971
Break-even live
Sensitivity live
| Price | -10% $1,064 | -5% $1,017 | +0% $971 | +5% $924 | +10% $877 |
|---|---|---|---|---|---|
| Rent | -10% $780 | -5% $875 | +0% $971 | +5% $1,066 | +10% $1,161 |
| Rate | -1.0pp $1,038 | -0.5pp $1,005 | base $971 | +0.5pp $936 | +1.0pp $900 |
UW: 25.0% down · 7.5% · 30yr · 1.5% tax · 5.0% vac · 8.0% maint · 8.0% mgmt
Financing live
Cash to close
- Down payment
- $33,750
- Closing costs
- $4,050
- Reserves months
- —
- Total cash needed
- —
Loan-product check · same deal, 3 products live
Conventional
25% down · 7.5% · 30yr
- Down + closing
- —
- Monthly P&I
- —
- Monthly cashflow
- —
- DSCR
- —
- Eligible?
- —
Personal DTI + credit; lowest rate.
DSCR
20% down · 8.5% · 30yr
- Down + closing
- —
- Monthly P&I
- —
- Monthly cashflow
- —
- DSCR
- —
- Eligible?
- —
No personal income docs; deal must DSCR.
Hard money
10% down · 12.0% · 12mo
- Down + closing
- —
- Monthly P&I
- —
- Monthly cashflow
- —
- DSCR
- —
- Eligible?
- —
Short-term bridge; refi at stabilization.
Listing history 18 events
-
2026-06-19days on market $135,000 Active 24 DOM
-
2026-06-18days on market $135,000 Active 23 DOM
-
2026-06-17days on market $135,000 Active 22 DOM
-
2026-06-16days on market $135,000 Active 21 DOM
-
2026-06-15days on market $135,000 Active 20 DOM
-
2026-06-14days on market $135,000 Active 18 DOM
-
2026-06-13days on market $135,000 Active 17 DOM
-
2026-06-10days on market $135,000 Active 15 DOM
-
2026-06-09days on market $135,000 Active 14 DOM
-
2026-06-08days on market $135,000 Active 13 DOM
-
2026-06-07days on market $135,000 Active 12 DOM
-
2026-06-05days on market $135,000 Active 9 DOM
-
2026-06-03days on market $135,000 Active 8 DOM
-
2026-06-02days on market $135,000 Active 7 DOM
-
2026-06-01days on market $135,000 Active 6 DOM
-
2026-05-31days on market $135,000 Active 5 DOM
-
2026-05-30days on market $135,000 Active 4 DOM
-
2026-05-26$135,000 Active
ⓘ Source: listings_history table (triggers on properties + properties_extension) + one-shot
backfill from property_details.listing_events for pre-trigger history.
Climate risk First Street
- Flood 1/10 Low FEMA zone D · 0% chance over 30 yrs
- Wildfire 4/10 Moderate
- Heat 3/10 Moderate 7 d/yr ≥89°F today · 16 d/yr by 30 yrs out
- Wind 1/10 Low
- Air quality 5/10 Major 7 unhealthy d/yr today · 8 by 30 yrs out
Nearby sold comps map
Loading sold comps map…
Walkable amenities ~0.75 mi
Loading nearby amenities…
Taxation est. · year 1
- Rental income
- $28,913
- − Mortgage interest
- −$7,562
- − Property taxes
- −$2,025
- − Insurance
- −$675
- − Repairs & maintenance
- −$2,313
- − Management
- −$2,313
- − Depreciation
- −$3,927
- Taxable income
- $10,098
- Est. tax owed @ 24.0%
- −$2,423
- After-tax cash flow
- $9,223/yr
For passive investors: Depreciation is non-cash, so a rental often shows a tax loss while cash-flowing — sheltering income. Rental losses are passive: they offset passive income freely, and up to $25,000/yr can offset ordinary (W-2) income if you actively participate and your MAGI is under $100k (phasing out to $0 by $150k); unused losses carry forward. On sale, claimed depreciation is recaptured at up to 25%, and gains may owe capital-gains tax (a 1031 exchange can defer both). Figures are a year-1 estimate at your 24.0% rate — not tax advice; consult a CPA.
Condition & rehab AI · 2 photos
The property appears to be a large, isolated structure with significant repairs and maintenance needed, including roof, exterior, and landscaping. The satellite image suggests a large footprint, but no interior photos are available to assess the condition of the interior walls, flooring, or systems.
Repairs flagged
- Major roof — The satellite image suggests a large structure with no visible roof damage.
- Major exterior — The satellite image shows a large, isolated structure with no visible landscaping or fencing.
- Major landscaping — No visible landscaping or curb appeal in the satellite image.
Value-add opportunities
- Both landscaping and curb appeal — Enhances the home's appearance and appeal to potential buyers or renters.
- Both exterior repairs — Improves the home's overall appearance and value.
- Both roof repair — Ensures the home's structural integrity and protects the interior from water damage.
Renovation cost estimate screening
| Repair item | Severity | Est. cost |
|---|---|---|
| roof · The satellite image suggests a large structure with no visible roof damage. | Major | $15,000–50,000 |
| exterior · The satellite image shows a large, isolated structure with no visible landscaping or fencing. | Major | $15,000–50,000 |
| landscaping · No visible landscaping or curb appeal in the satellite image. | Major | $15,000–50,000 |
| Total estimated repair cost · 3 items | $45,000–150,000 |
Value-add ROI direction
- Both landscaping and curb appeal — Enhances the home's appearance and appeal to potential buyers or renters. ↑
- Both exterior repairs — Improves the home's overall appearance and value. ↑
- Both roof repair — Ensures the home's structural integrity and protects the interior from water damage. ↑
ⓘ Cost ranges are severity-bucket heuristics (US national rule-of-thumb). Get contractor quotes + a written scope before underwriting a rehab budget.
Schools (NCES district)
- District
- Three Forks H S
- NCES district ID
- 3026190
- Math proficiency
- 20% ▲ 9.00%
- Reading proficiency
- 50% ▬ 0.00%
- Median HH income
- $51,699
- Composite
- 33.08/100
- National rank
- #10644
- State rank
- #174 of 339 in MT
Livability — Logan
- Score
- 42/100
- State rank
- #354
- US rank
- #27011
Category grades
Schools grade is shown separately in the Schools card above.
Census & demographics
- Population (ZIP)
- 4,982
Population outlook (Gallatin County) Hauer SSP2
- Today (2025)
- 129,625 people
- By 2030
- 144,940 · +11.8%
- By 2040
- 176,266 · +36.0%
- By 2050
- 209,250 · +61.4%
- By 2075
- 294,207 · +127.0%
- By 2100
- 360,558 · +178.2%
Race, ethnicity, and origin ACS 2023
- Neighborhood character
- Predominantly White (94%)
- Race & ethnicity
- White 94% Two or more races 3% Hispanic / Latino 3%
- Common ancestry
- Portuguese 6% Iranian 5% Serbian 5%
- Foreign-born
- 1% · China
- Languages at home
- 97% English-only · Spanish 2% Chinese 1%
Political lean MEDSL · Gallatin
- 2024 margin
- Toss-up / Even · D 50.0% · R 46.8% · Other 3.2%
- 2008→2024 swing
- -0.2pp no change · 2008: 3.4pp · 2024: 3.2pp
- All cycles
- 2024: D+3.2 2020: D+7.5 2016: D+1.0 2012: R+5.3 2008: D+3.4
Not yet ingested
- Civics
- —
Market trends
- HPI YoY
- ▼ -109.32%
- Current HPI
- 287.4147
- Rent YoY
- —
- Metro
- —
- State GDP YoY
- ▲ 3.41%
- F500 in state
- 2
Industry mix (Fortune 500 HQ in MT)
| Industry | F500 HQs | Revenue |
|---|---|---|
| Technology / Analytics | 1 | $2B |
|
||
Price history
1 event — show timeline
- 2026-05-26 Listed $135,000 FSBO.com
Cash-flow waterfall
monthlySold comps — $/sqft
last 12 mo · ≤1 miLoading sold comps…