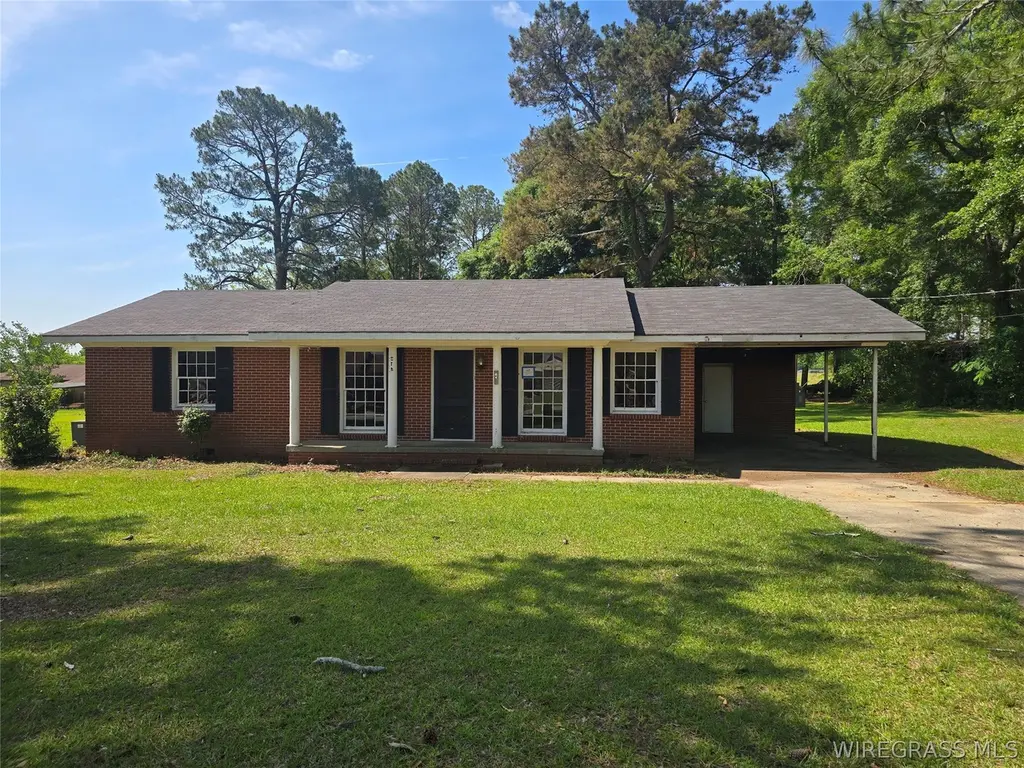
914 Moore Ave · Opp, AL
Flood risk 1/10 · Minimal
- FEMA flood zone
- X (unshaded)
- Chance of flooding over 30 yrs
- 0.0%
- Est. flood insurance / yr
- $507 – $1,088
Fire risk 4/10 · Minor
- Est. fire insurance / yr
- $916 – $1,700
Heat risk 8/10 · Major
- Hot days now (above 107°F)
- 7 days/yr
- Hot days in 30 yrs
- 17 days/yr
Wind risk 8/10 · Major
- Chance of severe wind over 30 yrs
- 99.0%
Air-quality risk 1/10 · Minimal
- Unhealthy air days now
- 0 days/yr
- Unhealthy air days in 30 yrs
- 0 days/yr
Risk factors via First Street. Map © Google.
Why this score? — see what drove the B grade
The composite is a weighted blend of 9 inputs, each scored 0–100. Each bar is that input's sub-score; the figure is the points it added to the 100-point composite (weight × sub-score).
- Cash flow +30.0/30.0
- 1% rule +10.0/10.0
- DSCR +10.0/10.0
- ARV discount +7.5/15.0
- Appreciation +5.0/10.0
- Livability +3.3/5.0
- Schools +3.1/10.0
- Rent growth +2.5/5.0
- Condition / age +2.5/5.0
$52,000
🖨 Deal sheet (PDF) 📄 Offer letter ✓ Due diligence
Listing remarks
3 bedroom 2 bathroom home inside the city limits and is close to amenities, schools, and major highways. This house needs some work and sits on a great lot. This home was built prior to 1978, lead paint potentially exists. Alabama Right of Redemption may affect this asset. This property may qualify for seller financing (Vendee). Seller does not guarantee or warrant title to the property.
Key facts
- Parking
- Built 1965
- Listed 21 days
Property features AI
Exterior
- Parking: Attached carport with 1 carport space
- Utilities: Public water; Public sewer; Electricity available
- Home design: Single-family residence; One story
- Construction: Brick construction
- Exterior features: Covered porch
Interior
- Kitchen: Electric cooktop; Electric oven; Electric range
- Flooring: Wood floors
- Bathrooms: 2 full bathrooms
- Heating & cooling: Hot water heating; Central heating; Central electric cooling
- Interior features: Electric water heater; Electric cooktop, electric oven and electric range
Neighborhood map
What this means for you Summary
Snapshot
- This is a 3-bed/1.0-bath single-family listed at $52k.
Deal economics
- At list price, monthly cash flow is $609 ($7k/yr) — positive.
- The deal already cash-flows at list — no discount required.
- Meets the 1% rule at list price ($1k rent vs $52k).
- Recommended offer: $51k (1.5% below list) — sets the bar for market timing.
- Cap rate 20.4% vs local median 3.9% in Opp — top-decile yield for the area; either an underpriced asset or a hidden risk that comps aren't pricing in. Stress-test before assuming the spread holds.
Location & tenants
- Location reads 66/100 on livability (#107 in AL) — a middle-class / working-renter tenant base. Strengths: cost of living A+, health & safety A+, housing A; Watch: schools D-, amenities F, commute F.
- Opp City (town): math 26% / reading 50% proficiency, ranked #37 of 129 in AL (top 29%) — families likely to look elsewhere, expect single-tenant / working-renter base with shorter leases.
- Market conditions: 1 active listings in the ZIP; 13 units permitted in Covington County in 2024 (0 in 5+ unit buildings).
Forward outlook
- In year one you build about $2k of equity ($360 loan paydown + $2k appreciation (3.0% local appreciation)).
- Covington County population projected to shrink 10% by 2050 — rents likely to lag national; underwrite the cash flow, not the appreciation.
- At projected returns (3.0% appreciation + 3.0% rent growth), your $15k cash investment doubles in ~2 years — after that, you're playing with house money.
Negotiation context
- It's been on market 21 days — a 2% lower offer ($51k) is reasonable based on typical stale-listing flexibility.
Risks & watch-outs
- Climate carrying-cost: severe wind risk, 99% chance of damaging wind over 30y; extreme-heat days projected 7→17/yr by 2055 (HVAC capex compounding) — expect insurance premiums to compound above CPI over the hold.
Questions for the listing agent
- Built in 1965 — when were the roof, HVAC, electrical panel, plumbing, and water heater last replaced?
- Is there a deadline driving the sale (1031 exchange, divorce, estate, relocation)? That informs how much negotiation room exists.
- Schools are D-rated, which usually means shorter tenancies and higher turnover. Who's the typical renter profile here, and what's been the actual vacancy rate?
- What's the average days-on-market for RENTAL listings here right now (not sales)? A rising rental-DOM trend means longer vacancies and softer asking-rent achievability than the comps imply.
- What's the recent tenant-quality profile in this submarket — average credit score on applications, eviction rate, late-payment / NSF rate, and stable-employment percentage? A property-management company in the area should have these aggregated.
- How much new for-sale + rental construction is in the pipeline within 1–3 miles? Heavy new supply typically softens prices + rents 12–24 months out; constrained supply supports both.
Investment metrics
- 1% rule
- 2.37% ✓
- Cap rate
- 20.35%
- Cash-on-cash
- 50.21%
- DSCR
- 3.23
- GRM
- 3.5
CMA / ARV
- ARV (median comp)
- $137,966
- List price
- $52,000
- Delta
- -62.31%
- Verdict
- UNDERPRICED
- Comps
- 20 within 1.0 mi
Show comp detail 6 sales within ~0.75 mi
| Address | Dist | Beds/Ba | Sqft | Sold | Price | $/sf | Match |
|---|---|---|---|---|---|---|---|
| 101 Rae St | 0.37mi | 3/2.0 | 1,150 (-6%) | 12mo | $139,000 | $121 | 58 |
| 906 King Ave | 0.12mi | 3/2.0 | 1,396 (+14%) | 10mo | $134,900 | $97 | 58 |
| 104 Spurlin St | 0.75mi | 2/2.0 (-1) | 1,261 (+3%) | 4mo | $38,000 | $30 | 48 |
| 211 Champion Dr | 0.27mi | 3/2.0 | 1,400 (+15%) | 17mo | $135,000 | $96 | 45 |
| 401 East Hart Ave | 0.70mi | 3/2.0 | 1,279 (+5%) | 20mo | $158,000 | $124 | 39 |
| 401 E Ida Ave | 0.74mi | 3/2.0 | 1,334 (+9%) | 9mo | $45,000 | $34 | 39 |
Match score weights: distance 35% · size 25% · config 20% · recency 20%. Top-matched comps best support the ARV.
Projected returns pro-forma
3.0% appreciation · 3.0% rent growth · sell at horizon
- IRR
- 55.4%
- Equity multiple
- 4.10×
- Total profit
- $45,089
- Equity at exit
- $23,381
- IRR
- 55.0%
- Equity multiple
- 8.29×
- Total profit
- $106,168
- Equity at exit
- $36,034
Cash invested: $14,560 (down + closing). Projections, not guarantees.
Landlord ↔ Tenant lean methodology
- Overall (STATE)
- 90 Strongly Landlord-Friendly
- State Alabama
- 90 Strongly Landlord-Friendly · R+15
- County
- — inherits STATE
- City
- — inherits STATE
ZIP-level market 36347
- Active inventory
- 1
- Price-to-rent
- 3.5×
Monthly cashflow live
- Estimated rent
- $1,231 medium interval (Pro) →
- Mortgage (P&I)
- −$273
- Tax from tax record
- −$69 /mo · $825/yr
- Insurance
- −$22
- HOA
- −$0
- Vacancy / Maint / Mgmt
- −$258
- Net cashflow
- $609
Break-even live
Sensitivity live
| Price | -10% $639 | -5% $624 | +0% $609 | +5% $595 | +10% $580 |
|---|---|---|---|---|---|
| Rent | -10% $512 | -5% $561 | +0% $609 | +5% $658 | +10% $707 |
| Rate | -1.0pp $635 | -0.5pp $622 | base $609 | +0.5pp $596 | +1.0pp $582 |
UW: 25.0% down · 7.5% · 30yr · 1.5% tax · 5.0% vac · 8.0% maint · 8.0% mgmt
Financing live
Cash to close
- Down payment
- $13,000
- Closing costs
- $1,560
- Reserves months
- —
- Total cash needed
- —
Loan-product check · same deal, 3 products live
Conventional
25% down · 7.5% · 30yr
- Down + closing
- —
- Monthly P&I
- —
- Monthly cashflow
- —
- DSCR
- —
- Eligible?
- —
Personal DTI + credit; lowest rate.
DSCR
20% down · 8.5% · 30yr
- Down + closing
- —
- Monthly P&I
- —
- Monthly cashflow
- —
- DSCR
- —
- Eligible?
- —
No personal income docs; deal must DSCR.
Hard money
10% down · 12.0% · 12mo
- Down + closing
- —
- Monthly P&I
- —
- Monthly cashflow
- —
- DSCR
- —
- Eligible?
- —
Short-term bridge; refi at stabilization.
Listing history 7 events
-
2026-06-04statusdays on market $52,000 Pending 21 DOM
-
2026-06-02days on market $52,000 Active 20 DOM
-
2026-06-01days on market $52,000 Active 19 DOM
-
2026-05-31days on market $52,000 Active 18 DOM
-
2026-05-31days on market $52,000 Active 17 DOM
-
2026-05-11$52,000 Active 390-char remark
-
2023-12-11soldstatus $76,450
ⓘ Source: listings_history table (triggers on properties + properties_extension) + one-shot
backfill from property_details.listing_events for pre-trigger history.
Tax reassessment forecast AL · Resets to sale price
- Current annual tax
- $825 · $69/mo
- Projected year-2 tax
- $825 · $69/mo
- Expected delta
- $0/yr ($0/mo · -0.0%)
ⓘ Screening estimate from a state-policy table — verify with the county assessor before closing.
Climate risk First Street
- Flood 1/10 Low FEMA zone X (unshaded) · 0% chance over 30 yrs
- Wildfire 4/10 Moderate
- Heat 8/10 Severe 7 d/yr ≥107°F today · 17 d/yr by 30 yrs out
- Wind 8/10 Severe 99% chance of damaging wind over 30 yrs
- Air quality 1/10 Low 0 unhealthy d/yr today · 0 by 30 yrs out
Nearby sold comps map
Loading sold comps map…
Walkable amenities ~0.75 mi
Loading nearby amenities…
Taxation est. · year 1
- Rental income
- $14,771
- − Mortgage interest
- −$2,913
- − Property taxes
- −$825
- − Insurance
- −$260
- − Repairs & maintenance
- −$1,182
- − Management
- −$1,182
- − Depreciation
- −$1,513
- Taxable income
- $6,896
- Est. tax owed @ 24.0%
- −$1,655
- After-tax cash flow
- $5,656/yr
For passive investors: Depreciation is non-cash, so a rental often shows a tax loss while cash-flowing — sheltering income. Rental losses are passive: they offset passive income freely, and up to $25,000/yr can offset ordinary (W-2) income if you actively participate and your MAGI is under $100k (phasing out to $0 by $150k); unused losses carry forward. On sale, claimed depreciation is recaptured at up to 25%, and gains may owe capital-gains tax (a 1031 exchange can defer both). Figures are a year-1 estimate at your 24.0% rate — not tax advice; consult a CPA.
Schools (NCES district)
- District
- Opp City
- NCES district ID
- 0102610
- Math proficiency
- 26% ▼ -19.00%
- Reading proficiency
- 50% ▲ 5.00%
- Median HH income
- $32,756
- Composite
- 31.09/100
- National rank
- #6073
- State rank
- #37 of 129 in AL
Livability — Opp
- Score
- 66/100
- State rank
- #107
- US rank
- #11901
Category grades
Schools grade is shown separately in the Schools card above.
Census & demographics
- Census place
- Opp, AL
Population outlook (Covington County) Hauer SSP2
- Today (2025)
- 37,007 people
- By 2030
- 36,401 · -1.6%
- By 2040
- 34,983 · -5.5%
- By 2050
- 33,437 · -9.6%
- By 2075
- 29,753 · -19.6%
- By 2100
- 25,109 · -32.2%
Not yet ingested
- Political lean
- —
- Race & ethnicity
- —
- Common origin
- —
- Civics
- —
Market trends
- HPI YoY
- —
- Current HPI
- —
- Rent YoY
- —
- Metro
- —
- State GDP YoY
- ▲ 2.94%
- F500 in state
- 4
Industry mix (Fortune 500 HQ in AL)
| Industry | F500 HQs | Revenue |
|---|---|---|
| Financial Services | 1 | $8B |
|
||
| Healthcare | 1 | $5B |
|
||
Price history
-32.0% since first listed3 events — show timeline
- 2026-06-03 Pending — WBR
- 2026-05-11 Listed $52,000 WBR
- 2023-12-11 Sold (Public Records) $76,450 Public Records
Property tax history
+5.7%/yrLatest (2025): $825 · +12.3% YoY. Source: county tax records.
Cash-flow waterfall
monthlySold comps — $/sqft
last 12 mo · ≤1 miLoading sold comps…