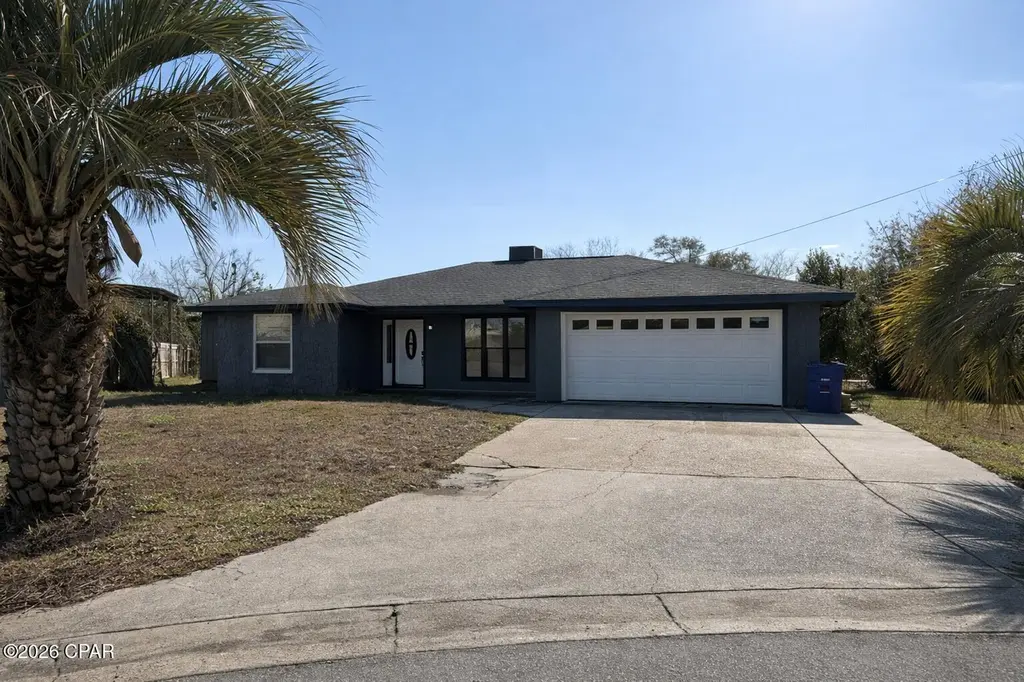
945 Agnes Scott Cir · Panama City, FL
Flood risk 6/10 · Moderate
- FEMA flood zone
- AE
- Chance of flooding over 30 yrs
- 0.74%
- Est. flood insurance / yr
- $1,737 – $8,500
Fire risk 1/10 · Minimal
- Est. fire insurance / yr
- $947 – $1,759
Heat risk 10/10 · Severe
- Hot days now (above 104°F)
- 7 days/yr
- Hot days in 30 yrs
- 21 days/yr
Wind risk 9/10 · Severe
- Chance of severe wind over 30 yrs
- 99.0%
Air-quality risk 1/10 · Minimal
- Unhealthy air days now
- 0 days/yr
- Unhealthy air days in 30 yrs
- 0 days/yr
Risk factors via First Street. Map © Google.
Why this score? — see what drove the C+ grade
The composite is a weighted blend of 9 inputs, each scored 0–100. Each bar is that input's sub-score; the figure is the points it added to the 100-point composite (weight × sub-score).
- Cash flow +22.9/30.0
- ARV discount +15.0/15.0
- DSCR +7.3/10.0
- 1% rule +6.0/10.0
- Schools +4.3/10.0
- Livability +3.6/5.0
- Rent growth +2.8/5.0
- Condition / age +2.5/5.0
- Appreciation +0.0/10.0
$199,900
🖨 Deal sheet (PDF) 📄 Offer letter ✓ Due diligence
Listing remarks MLS
Cash Sale Only | Foundation Repair Required | Investor Opportunity Located in the desirable Forest Park neighborhood, 945 Agens Scott Circle sits at the end of a quiet cul-de-sac and offers convenient access to shopping, dining, schools, and major roadways. This centrally located property presents a strong opportunity for investors or buyers looking to add value. The current owners completed several major improvements following their 2021 purchase, with extensive updates in 2022 including a new roof, LVP flooring, kitchen cabinets, stainless steel appliances, and updated fixtures throughout. The home features a large open-concept layout with spacious living areas, creating a bright and functional flow with flexibility for a variety of living arrangements. Please note: the home has known foundation issues and will require repair, along with additional improvements throughout. A structural engineer has evaluated the foundation, and reports are available upon request. Repair estimates from multiple foundation companies are also available; however, buyers are encouraged to conduct their own due diligence and obtain independent evaluations. Seller and listing brokerage make no representations and have no affiliation with any contractors. Property is being sold strictly as-is, and due to current condition, will require a cash purchase. This is a prime opportunity for an investor, contractor, or buyer seeking a project with upside potential in a well-established location.
Key facts
- New kitchen cabinets
- New lvp flooring
- Cul-de-sac
Tags
Neighborhood map
What this means for you Summary
Snapshot
- This is a 4-bed/2.0-bath single-family listed at $200k.
Deal economics
- At list price, monthly cash flow is $-77 ($-918/yr) — negative.
- To cash-flow at today's rent, offer at most $186k (6.8% below list).
- Meets the 1% rule at list price ($2k rent vs $200k).
- Recommended offer: $176k (12.0% below list) — sets the bar for market timing.
- Cap rate 8.4% vs local median 4.7% in Panama City — top-decile yield for the area; either an underpriced asset or a hidden risk that comps aren't pricing in. Stress-test before assuming the spread holds.
Location & tenants
- Location reads 72/100 on livability (#350 in FL) — a middle-class / working-renter tenant base. Strengths: cost of living A+, housing A+, health & safety A+; Watch: crime F, amenities F, commute F.
- Bay (suburban): math 51% / reading 51% proficiency, ranked #29 of 73 in FL (top 40%) — acceptable for families but not a draw, mixed tenant base, ~2y average lease.
- Zoned schools: Northside Elementary School (math 49% / reading 45%, grade D-, #1,191 of 2,144 statewide, top 57%, 598 students, 59% FRL); Jinks Middle School (math 41% / reading 42%, grade F, #348 of 571 statewide, top 62%, 570 students, 70% FRL); Bay High School (math 37% / reading 34%, grade F, #367 of 667 statewide, top 57%, 1,255 students, 53% FRL).
- Market conditions: Rents rising (+1.2%/yr); 380 active listings in the ZIP; 11 comparable units currently listed for rent nearby; rentals at typical pace (median 23d on market — plan ~3-4 weeks tenant-placement turnaround); 2,473 units permitted in Bay County in 2024 (559 in 5+ unit buildings).
- This rent runs 36% of the median local income ($73k/yr) — at the standard rent-burdened threshold; future hikes will face affordability resistance.
Forward outlook
- Local home prices are declining (-3.0%/yr); year-one equity from $1k of loan paydown is wiped out by about $6k of value loss. Plan a longer hold.
- Bay County population projected at +24% by 2050 — long-run rental-demand tailwind backs the buy-and-hold thesis.
Negotiation context
- It's been on market 134 days — a 12% lower offer ($176k) is reasonable based on typical stale-listing flexibility.
- 10 sale attempts since 10y ago; this cycle's ask has dropped $15k (7%) from the opening price — seller is motivated, your offer sets the floor, not the list.
- Current owner paid $120k; list at $200k implies a 67% gain — meaningful room to come down on a strong offer.
Risks & watch-outs
- Watch-outs: flood insurance adds $427/mo.
- Climate carrying-cost: in FEMA flood zone AE (mandatory federal flood insurance); severe wind risk, 99% chance of damaging wind over 30y; extreme-heat days projected 7→21/yr by 2055 (HVAC capex compounding) — expect insurance premiums to compound above CPI over the hold.
Questions for the listing agent
- What do current leases actually rent for vs. the listed asking? Can we see a recent rent roll and the last 12 months of T-12 income?
- It's been on market 134 days. Have you received any prior offers? Is the seller open to a 12% concession, seller financing, or rate buy-down credit?
- What's the actual annual flood-insurance premium (NFIP or private), and is the property in a SFHA with mandatory coverage?
- Why hasn't it sold? Are there any deal-killer items the seller is aware of (foundation, flood, title, zoning, code violations)?
- Is there a deadline driving the sale (1031 exchange, divorce, estate, relocation)? That informs how much negotiation room exists.
- Schools are B-rated — typically a magnet for longer-tenancy family renters. What's the average tenant stay here, and is there a school-zone premium baked into asking?
- Crime grade is F in this area — have there been break-ins, vandalism, or insurance claims at this property in the last 3 years? What carrier currently insures it and at what premium?
- What's the average days-on-market for RENTAL listings here right now (not sales)? A rising rental-DOM trend means longer vacancies and softer asking-rent achievability than the comps imply.
- What's the recent tenant-quality profile in this submarket — average credit score on applications, eviction rate, late-payment / NSF rate, and stable-employment percentage? A property-management company in the area should have these aggregated.
- How much new for-sale + rental construction is in the pipeline within 1–3 miles? Heavy new supply typically softens prices + rents 12–24 months out; constrained supply supports both.
Investment metrics
- 1% rule
- 1.10% ✓
- Cap rate
- 8.39%
- Cash-on-cash
- 7.50%
- DSCR
- 1.33
- GRM
- 7.6
CMA / ARV
- ARV (median comp)
- $316,085
- List price
- $199,900
- Delta
- -36.76%
- Verdict
- UNDERPRICED
- Comps
- 20 within 1.0 mi
Show comp detail 12 sales within ~0.75 mi
| Address | Dist | Beds/Ba | Sqft | Sold | Price | $/sf | Match |
|---|---|---|---|---|---|---|---|
| 903 Jeremy Ln | 0.31mi | 3/2.0 (-1) | 1,850 (-3%) | 8mo | $325,000 | $176 | 69 |
| 2917 Briarcliff Rd | 0.51mi | 3/2.0 (-1) | 1,797 (-6%) | 1mo | $375,000 | $209 | 60 |
| 1204 Emory Dr | 0.72mi | 3/2.0 (-1) | 1,914 (+0%) | 1mo | $179,000 | $94 | 60 |
| 6 Harvard Cir | 0.46mi | 4/3.0 | 1,725 (-10%) | 0mo | $313,694 | $182 | 59 |
| 1317 W 30th St | 0.65mi | 4/2.0 | 1,824 (-4%) | 6mo | $375,000 | $206 | 57 |
| 2908 Briarcliff Rd | 0.53mi | 3/2.0 (-1) | 2,074 (+9%) | 4mo | $305,000 | $147 | 53 |
| 1211 W 28th Pl | 0.45mi | 3/2.0 (-1) | 1,724 (-10%) | 9mo | $325,000 | $189 | 51 |
| 160 Concord Cir | 0.55mi | 4/3.0 | 2,139 (+12%) | 2mo | $145,000 | $68 | 49 |
| 8 Harvard Cir | 0.44mi | 3/2.0 (-1) | 1,649 (-14%) | 6mo | $295,000 | $179 | 46 |
| 2805 Fairmont Dr | 0.53mi | 4/2.0 | 2,145 (+12%) | 10mo | $382,500 | $178 | 46 |
| 2904 Fairmont Dr | 0.60mi | 4/3.0 | 2,130 (+12%) | 9mo | $390,000 | $183 | 41 |
| 2721 Jenks Ave | 0.61mi | 4/3.0 | 2,172 (+14%) | 6mo | $170,000 | $78 | 40 |
Match score weights: distance 35% · size 25% · config 20% · recency 20%. Top-matched comps best support the ARV.
Projected returns pro-forma
-3.0% appreciation · 1.24% rent growth · sell at horizon
- IRR
- -21.5%
- Equity multiple
- 0.27×
- Total profit
- $-40,788
- Equity at exit
- $29,806
- IRR
- -21.3%
- Equity multiple
- 0.00×
- Total profit
- $-55,714
- Equity at exit
- $17,284
Cash invested: $55,972 (down + closing). Projections, not guarantees.
Landlord ↔ Tenant lean methodology
- Overall (STATE)
- 87 Strongly Landlord-Friendly
- State Florida
- 87 Strongly Landlord-Friendly · R+3
- County
- — inherits STATE
- City
- — inherits STATE
ZIP-level market 32405
- Rents YoY
- 1.2%
- Active inventory
- 380
- Price-to-rent
- 7.6×
Monthly cashflow live
- Estimated rent
- $2,194 high interval (Pro) →
- Mortgage (P&I)
- −$1,048
- Tax from tax record
- −$252 /mo · $3,023/yr
- Insurance
- −$83
- Flood insurance flood zone
- −$427 /mo · $5,118/yr
- HOA
- −$0
- Vacancy / Maint / Mgmt
- −$461
- Net cashflow
- $-77
Break-even live
Sensitivity live
| Price | -10% $37 | -5% $-20 | +0% $-77 | +5% $-133 | +10% $-190 |
|---|---|---|---|---|---|
| Rent | -10% $-250 | -5% $-163 | +0% $-77 | +5% $10 | +10% $97 |
| Rate | -1.0pp $24 | -0.5pp $-26 | base $-77 | +0.5pp $-128 | +1.0pp $-181 |
UW: 25.0% down · 7.5% · 30yr · 1.5% tax · 5.0% vac · 8.0% maint · 8.0% mgmt
Financing live
Cash to close
- Down payment
- $49,975
- Closing costs
- $5,997
- Reserves months
- —
- Total cash needed
- —
Loan-product check · same deal, 3 products live
Conventional
25% down · 7.5% · 30yr
- Down + closing
- —
- Monthly P&I
- —
- Monthly cashflow
- —
- DSCR
- —
- Eligible?
- —
Personal DTI + credit; lowest rate.
DSCR
20% down · 8.5% · 30yr
- Down + closing
- —
- Monthly P&I
- —
- Monthly cashflow
- —
- DSCR
- —
- Eligible?
- —
No personal income docs; deal must DSCR.
Hard money
10% down · 12.0% · 12mo
- Down + closing
- —
- Monthly P&I
- —
- Monthly cashflow
- —
- DSCR
- —
- Eligible?
- —
Short-term bridge; refi at stabilization.
Rent comps 11 comps
| Address | Beds | Baths | Sqft | Rent | $/sqft | DOM | Units | Dist |
|---|---|---|---|---|---|---|---|---|
| 618 Gabriel St Panama City, FL | 3.0 | 2.0 | 1960 | $2,150 | $1.10 | 23d | 1 | 0.50mi |
| 3100 Sweetbay Ave Panama City, FL | 1.0–3.0 | 1.0–2.0 | 957 | $2,168 | $2.26 | 15d | 26 | 0.56mi |
| 1117 Blazing Star St Panama City, FL | 3.0 | 2.0 | 1800 | $2,500 | $1.39 | 23d | 1 | 0.70mi |
| 2870 Harrison Ave Panama City, FL | 1.0–3.0 | 1.0–2.0 | 1230 | $1,770 | $1.44 | 23d | 1 | 0.96mi |
| 2950 Harrison Ave Panama City, FL | 1.0–3.0 | 1.0–2.0 | 1199 | $1,725 | $1.44 | 23d | 6 | 1.05mi |
| 3126 Wood Valley Rd Panama City, FL | 3.0 | 2.0 | 1922 | $2,800 | $1.46 | 23d | 1 | 1.17mi |
| 1827 Balboa Ave Panama City, FL | 3.0 | 2.5 | 1440 | $1,800 | $1.25 | 15d | 1 | 1.18mi |
| 3502 Jenks Ave Panama City, FL | 1.0–3.0 | 1.0–2.0 | 1176 | $1,850 | $1.57 | 15d | 24 | 1.25mi |
| 108 Baldwin Rowe Cir Panama City, FL | 3.0 | 2.5 | 1604 | $2,350 | $1.47 | 23d | 1 | 1.30mi |
| 3900 Arbor Trace Dr Lynn Haven, FL | 2.0–3.0 | 2.0 | 1520 | $1,854 | $1.22 | 15d | 34 | 1.45mi |
| 2002 Wilson Ave Panama City, FL | 1.0–3.0 | 1.0–2.0 | 977 | $2,260 | $2.31 | 15d | 25 | 1.47mi |
Listing history 49 events
-
2026-06-21days on market $199,900 Active 134 DOM
-
2026-06-19days on market $199,900 Active 132 DOM
-
2026-06-18days on market $199,900 Active 131 DOM
-
2026-06-17days on market $199,900 Active 130 DOM
-
2026-06-16days on market $199,900 Active 129 DOM
-
2026-06-15days on market $199,900 Active 128 DOM
-
2026-06-14days on market $199,900 Active 126 DOM
-
2026-06-13days on market $199,900 Active 125 DOM
-
2026-06-10days on market $199,900 Active 123 DOM
-
2026-06-09days on market $199,900 Active 122 DOM
-
2026-06-08days on market $199,900 Active 121 DOM
-
2026-06-07days on market $199,900 Active 120 DOM
-
2026-06-05days on market $199,900 Active 117 DOM
-
2026-06-03days on market $199,900 Active 116 DOM
-
2026-06-02days on market $199,900 Active 115 DOM
-
2026-06-01days on market $199,900 Active 114 DOM
-
2026-05-31days on market $199,900 Active 113 DOM
-
2026-05-30days on market $199,900 Active 112 DOM
-
2026-03-10price $199,900 1492-char remark
Show marketing remark (1492 chars)
Cash Sale Only | Foundation Repair Required | Investor Opportunity Located in the desirable Forest Park neighborhood, 945 Agens Scott Circle sits at the end of a quiet cul-de-sac and offers convenient access to shopping, dining, schools, and major roadways. This centrally located property presents a strong opportunity for investors or buyers looking to add value. The current owners completed several major improvements following their 2021 purchase, with extensive updates in 2022 including a new roof, LVP flooring, kitchen cabinets, stainless steel appliances, and updated fixtures throughout. The home features a large open-concept layout with spacious living areas, creating a bright and functional flow with flexibility for a variety of living arrangements. Please note: the home has known foundation issues and will require repair, along with additional improvements throughout. A structural engineer has evaluated the foundation, and reports are available upon request. Repair estimates from multiple foundation companies are also available; however, buyers are encouraged to conduct their own due diligence and obtain independent evaluations. Seller and listing brokerage make no representations and have no affiliation with any contractors. Property is being sold strictly as-is, and due to current condition, will require a cash purchase. This is a prime opportunity for an investor, contractor, or buyer seeking a project with upside potential in a well-established location.
-
2026-02-16price $209,900 1492-char remark
Show marketing remark (1492 chars)
Cash Sale Only | Foundation Repair Required | Investor Opportunity Located in the desirable Forest Park neighborhood, 945 Agens Scott Circle sits at the end of a quiet cul-de-sac and offers convenient access to shopping, dining, schools, and major roadways. This centrally located property presents a strong opportunity for investors or buyers looking to add value. The current owners completed several major improvements following their 2021 purchase, with extensive updates in 2022 including a new roof, LVP flooring, kitchen cabinets, stainless steel appliances, and updated fixtures throughout. The home features a large open-concept layout with spacious living areas, creating a bright and functional flow with flexibility for a variety of living arrangements. Please note: the home has known foundation issues and will require repair, along with additional improvements throughout. A structural engineer has evaluated the foundation, and reports are available upon request. Repair estimates from multiple foundation companies are also available; however, buyers are encouraged to conduct their own due diligence and obtain independent evaluations. Seller and listing brokerage make no representations and have no affiliation with any contractors. Property is being sold strictly as-is, and due to current condition, will require a cash purchase. This is a prime opportunity for an investor, contractor, or buyer seeking a project with upside potential in a well-established location.
-
2026-02-06$214,999 Active 1492-char remark
Show marketing remark (1492 chars)
Cash Sale Only | Foundation Repair Required | Investor Opportunity Located in the desirable Forest Park neighborhood, 945 Agens Scott Circle sits at the end of a quiet cul-de-sac and offers convenient access to shopping, dining, schools, and major roadways. This centrally located property presents a strong opportunity for investors or buyers looking to add value. The current owners completed several major improvements following their 2021 purchase, with extensive updates in 2022 including a new roof, LVP flooring, kitchen cabinets, stainless steel appliances, and updated fixtures throughout. The home features a large open-concept layout with spacious living areas, creating a bright and functional flow with flexibility for a variety of living arrangements. Please note: the home has known foundation issues and will require repair, along with additional improvements throughout. A structural engineer has evaluated the foundation, and reports are available upon request. Repair estimates from multiple foundation companies are also available; however, buyers are encouraged to conduct their own due diligence and obtain independent evaluations. Seller and listing brokerage make no representations and have no affiliation with any contractors. Property is being sold strictly as-is, and due to current condition, will require a cash purchase. This is a prime opportunity for an investor, contractor, or buyer seeking a project with upside potential in a well-established location.
-
2025-04-14historical
-
2025-03-25$275,000 Active
-
2023-10-02status Active
-
2023-09-27historical Active Under Contract
-
2023-09-15status Active
-
2023-08-30status Pending
-
2023-08-15price $250,000
-
2023-07-11$275,000 Active
-
2023-05-08status Active
-
2023-04-28status Pending
-
2023-04-26price $279,000
-
2023-03-29price $299,999
-
2023-03-21price $305,000
-
2023-02-27price $315,000
-
2023-02-06status Active
-
2023-02-06price $325,000
-
2023-01-06price $349,000
-
2022-12-20price $374,000
-
2022-12-09price $384,000
-
2022-11-21price $389,000
-
2022-11-15$399,000 Active
-
2021-07-28soldstatus $120,000
-
2021-07-26soldstatus $120,000
-
2021-07-08$115,000
-
2017-04-14soldstatus $65,000
-
2016-10-08$79,900
-
1989-04-01soldstatus $79,000
-
1988-01-01soldstatus $55,000
ⓘ Source: listings_history table (triggers on properties + properties_extension) + one-shot
backfill from property_details.listing_events for pre-trigger history.
Tax reassessment forecast FL · Resets to sale price
- Current annual tax
- $3,023 · $252/mo
- Projected year-2 tax
- $3,023 · $252/mo
- Expected delta
- $0/yr ($0/mo · 0.0%)
ⓘ Screening estimate from a state-policy table — verify with the county assessor before closing.
Climate risk First Street
- Flood 6/10 Major FEMA zone AE · 74% chance over 30 yrs
- Wildfire 1/10 Low
- Heat 10/10 Extreme 7 d/yr ≥104°F today · 21 d/yr by 30 yrs out
- Wind 9/10 Extreme 99% chance of damaging wind over 30 yrs
- Air quality 1/10 Low 0 unhealthy d/yr today · 0 by 30 yrs out
Nearby sold comps map
Loading sold comps map…
Walkable amenities ~0.75 mi
Loading nearby amenities…
Taxation est. · year 1
- Rental income
- $26,332
- − Mortgage interest
- −$11,198
- − Property taxes
- −$3,023
- − Insurance
- −$6,118
- − Repairs & maintenance
- −$2,107
- − Management
- −$2,107
- − Depreciation
- −$5,815
- Taxable loss
- −$4,035
- Est. tax savings @ 24.0%
- +$968
- After-tax cash flow
- $50/yr
For passive investors: Depreciation is non-cash, so a rental often shows a tax loss while cash-flowing — sheltering income. Rental losses are passive: they offset passive income freely, and up to $25,000/yr can offset ordinary (W-2) income if you actively participate and your MAGI is under $100k (phasing out to $0 by $150k); unused losses carry forward. On sale, claimed depreciation is recaptured at up to 25%, and gains may owe capital-gains tax (a 1031 exchange can defer both). Figures are a year-1 estimate at your 24.0% rate — not tax advice; consult a CPA.
Schools (NCES district)
- District
- Bay
- NCES district ID
- 1200090
- Math proficiency
- 51% ▼ -8.00%
- Reading proficiency
- 51% ▼ -7.00%
- Median HH income
- $47,740
- Composite
- 43.41/100
- National rank
- #3014
- State rank
- #29 of 73 in FL
Livability — Panama City
- Score
- 72/100
- State rank
- #350
- US rank
- #5823
Category grades
Schools grade is shown separately in the Schools card above.
Census & demographics
- Census place
- Panama City, FL
- County
- Bay County · 163,593 people
- City population
- 91,445
- Metro
- Panama City, FL
- Population (ZIP)
- 29,984
- Household income
- $73,373
- Rent vs Own
- Severe rent burden
- 1008.0
Population outlook (Bay County) Hauer SSP2
- Today (2025)
- 206,264 people
- By 2030
- 217,740 · +5.6%
- By 2040
- 238,738 · +15.7%
- By 2050
- 255,545 · +23.9%
- By 2075
- 288,295 · +39.8%
- By 2100
- 288,638 · +39.9%
Race, ethnicity, and origin ACS 2023
- Neighborhood character
- Predominantly White (67%)
- Race & ethnicity
- White 67% Black 17% Two or more races 8% Hispanic / Latino 7% Native American 1%
- Hispanic origin (detail)
- Mexican 2% Puerto Rican 3%
- Common ancestry
- Slovak 4% Lithuanian 2% Romanian 2%
- Foreign-born
- 7% · Canada
- Languages at home
- 89% English-only · Spanish 6% Arabic 1% French/Haitian/Cajun 1%
Political lean MEDSL · Bay
- 2024 margin
- Solid R (+47.4) · D 25.8% · R 73.1% · Other 1.1%
- 2008→2024 swing
- -6.6pp toward R · 2008: -40.7pp · 2024: -47.4pp
- All cycles
- 2024: R+47.4 2020: R+43.5 2016: R+46.3 2012: R+43.6 2008: R+40.7
Not yet ingested
- Civics
- —
Market trends
- HPI YoY
- ▼ -217.88%
- Current HPI
- 262.7854
- Rent YoY
- ▲ 1.24%
- Metro
- Panama City, FL
- State GDP YoY
- ▲ 3.28%
- F500 in state
- 36
Industry mix (Fortune 500 HQ in FL)
| Industry | F500 HQs | Revenue |
|---|---|---|
| Industrial Technology | 2 | $29B |
|
||
| Insurance | 2 | $17B |
|
||
| Retail | 1 | $60B |
|
||
| Technology Distribution | 1 | $58B |
|
||
| Homebuilding | 1 | $35B |
|
||
| Technology Manufacturing | 1 | $35B |
|
||
Price history
+263.5% since first listed31 events — show timeline
- 2026-03-10 Price Changed $199,900 CPARMLS
- 2026-02-16 Price Changed $209,900 CPARMLS
- 2026-02-06 Listed $214,999 CPARMLS
- 2025-04-14 Listing Removed — CPARMLS
- 2025-03-25 Listed $275,000 CPARMLS
- 2023-10-02 Relisted — CPARMLS
- 2023-09-27 Contingent — CPARMLS
- 2023-09-15 Relisted — CPARMLS
- 2023-08-30 Pending — CPARMLS
- 2023-08-15 Price Changed $250,000 CPARMLS
- 2023-07-11 Listed $275,000 CPARMLS
- 2023-05-08 Relisted — CPARMLS
- 2023-04-28 Pending — CPARMLS
- 2023-04-26 Price Changed $279,000 CPARMLS
- 2023-03-29 Price Changed $299,999 CPARMLS
- 2023-03-21 Price Changed $305,000 CPARMLS
- 2023-02-27 Price Changed $315,000 CPARMLS
- 2023-02-06 Relisted — CPARMLS
- 2023-02-06 Price Changed $325,000 CPARMLS
- 2023-01-06 Price Changed $349,000 CPARMLS
- 2022-12-20 Price Changed $374,000 CPARMLS
- 2022-12-09 Price Changed $384,000 CPARMLS
- 2022-11-21 Price Changed $389,000 CPARMLS
- 2022-11-15 Listed $399,000 CPARMLS
- 2021-07-28 Sold (Public Records) $120,000 Public Records
- 2021-07-26 Sold (MLS) $120,000 CPARMLS
- 2021-07-08 Listed $115,000 CPARMLS
- 2017-04-14 Sold (MLS) $65,000 CPARMLS
- 2016-10-08 Listed $79,900 CPARMLS
- 1989-04-01 Sold (Public Records) $79,000 Public Records
- 1988-01-01 Sold (Public Records) $55,000 Public Records
Property tax history
+11.2%/yrLatest (2025): $3,023 · +8.4% YoY. Source: county tax records.
Cash-flow waterfall
monthlySold comps — $/sqft
last 12 mo · ≤1 miLoading sold comps…