10505 Red Bud · New London, TX
Flood risk No data
- FEMA flood zone
- —
- Chance of flooding over 30 yrs
- —
- Est. flood insurance / yr
- —
Fire risk No data
- Est. fire insurance / yr
- —
Heat risk No data
- Hot days now (above threshold)
- —
- Hot days in 30 yrs
- —
Wind risk No data
- Chance of severe wind over 30 yrs
- —
Air-quality risk No data
- Unhealthy air days now
- —
- Unhealthy air days in 30 yrs
- —
Risk factors via First Street. Map © Google.
Why this score? — see what drove the C- grade
The composite is a weighted blend of 9 inputs, each scored 0–100. Each bar is that input's sub-score; the figure is the points it added to the 100-point composite (weight × sub-score).
- Cash flow +17.4/30.0
- ARV discount +7.5/15.0
- DSCR +5.4/10.0
- Appreciation +5.0/10.0
- 1% rule +4.7/10.0
- Schools +3.6/10.0
- Livability +3.4/5.0
- Rent growth +2.5/5.0
- Condition / age +2.2/5.0
$103,900
🖨 Deal sheet 📄 Offer letter ✓ Due diligence
Listing remarks MLS
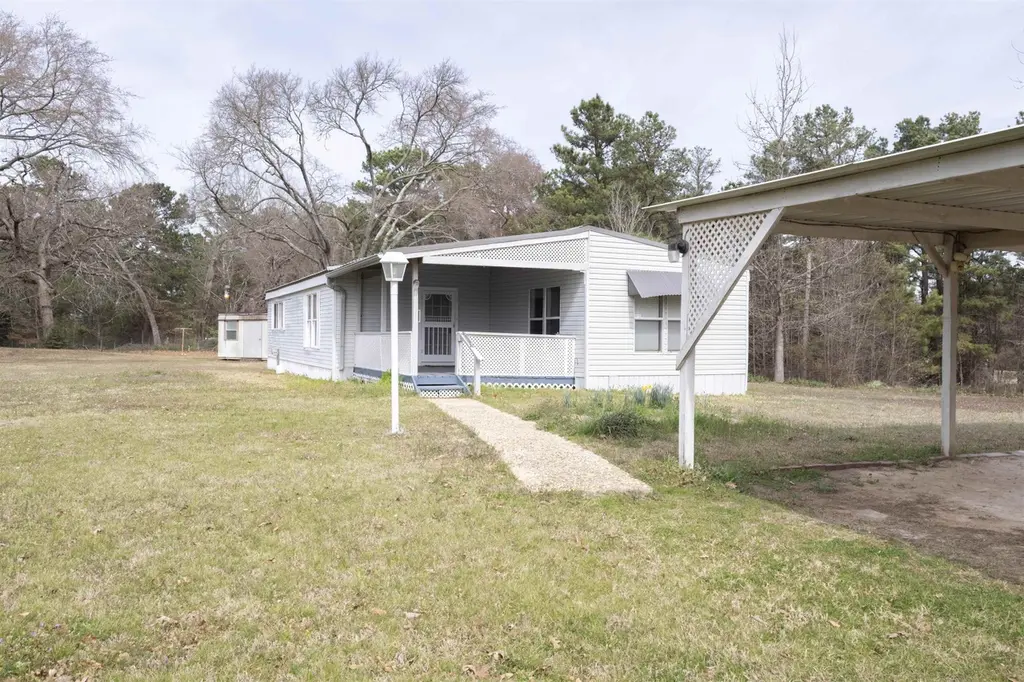
Situated on a spacious . 706-acre lot, this 1,120 sq. ft. home offers the perfect blend of peaceful country living with convenient access to nearby towns. This 2-bedroom, 2-bathroom home features a functional layout and comfortable living space ready for your personal touch. Outside, you'll find a detached 2-car carport and a small storage shed, providing plenty of room for parking, tools, and outdoor equipment. With nearly three-quarters of an acre, there’s space to garden, entertain, or simply enjoy the privacy and open surroundings. Perfect for first-time buyers, downsizers, or investors looking to expand their portfolio- don’t miss this opportunity! This property has also had recent repairs completed and an updated HVAC unit installed. Please see associated documents for a complete list of repairs.
Key facts
- Detached carport
- Spacious lot
- Room for parking
Tags
Neighborhood map
What this means for you Summary
Snapshot
- This is a 2-bed/2.0-bath manufactured listed at $104k. Condition is rated fair.
Deal economics
- At list price, monthly cash flow is $78 ($941/yr) — positive.
- The deal already cash-flows at list — no discount required.
- To meet the 1% rule (rent ≥ 1% of price), the offer needs to be $101k (3.0% below list).
- Recommended offer: $95k (9.0% below list) — sets the bar for market timing.
Location & tenants
- Location reads 68/100 on livability (#475 in TX) — a middle-class / working-renter tenant base. Strengths: crime A+, cost of living A+, housing A+; Watch: employment D, amenities F, commute F.
- West Rusk County Consolidated ISD (rural): math 41% / reading 43% proficiency, ranked #351 of 826 in TX (top 42%) — families likely to look elsewhere, expect single-tenant / working-renter base with shorter leases; 65% free/reduced lunch — lower-income household profile, screen leases tightly.
- Market conditions: 7 active listings in the ZIP; 4 units permitted in Rusk County in 2024 (0 in 5+ unit buildings).
Forward outlook
- In year one you build about $4k of equity ($718 loan paydown + $3k appreciation (3.0% local appreciation)).
- Rusk County population projected to shrink 5% by 2050 — rents likely to lag national; underwrite the cash flow, not the appreciation.
- At projected returns (3.0% appreciation + 3.0% rent growth), your $29k cash investment doubles in ~6 years — after that, you're playing with house money.
- By year 9, paydown + projected appreciation supports a ~$33k cash-out refi (75% LTV) — recoverable capital for the next deal without selling this one.
Negotiation context
- It's been on market 91 days — a 9% lower offer ($95k) is reasonable based on typical stale-listing flexibility.
Questions for the listing agent
- It's been on market 91 days. Have you received any prior offers? Is the seller open to a 9% concession, seller financing, or rate buy-down credit?
- Have any recent inspections been done? Can we get a copy of the seller's disclosures and any deferred-maintenance estimates?
- Why hasn't it sold? Are there any deal-killer items the seller is aware of (foundation, flood, title, zoning, code violations)?
- Is there a deadline driving the sale (1031 exchange, divorce, estate, relocation)? That informs how much negotiation room exists.
- What's the average days-on-market for RENTAL listings here right now (not sales)? A rising rental-DOM trend means longer vacancies and softer asking-rent achievability than the comps imply.
- What's the recent tenant-quality profile in this submarket — average credit score on applications, eviction rate, late-payment / NSF rate, and stable-employment percentage? A property-management company in the area should have these aggregated.
- How much new for-sale + rental construction is in the pipeline within 1–3 miles? Heavy new supply typically softens prices + rents 12–24 months out; constrained supply supports both.
Investment metrics
- 1% rule
- 0.97% ✗
- Cap rate
- 7.20%
- Cash-on-cash
- 3.23%
- DSCR
- 1.14
- GRM
- 8.6
CMA / ARV
No comps found within radius.
Projected returns pro-forma
3.0% appreciation · 3.0% rent growth · sell at horizon
- IRR
- 10.5%
- Equity multiple
- 1.60×
- Total profit
- $17,525
- Equity at exit
- $46,718
- IRR
- 12.8%
- Equity multiple
- 2.91×
- Total profit
- $55,426
- Equity at exit
- $71,998
Cash invested: $29,092 (down + closing). Projections, not guarantees.
Landlord ↔ Tenant lean methodology
- Overall (STATE)
- 87 Strongly Landlord-Friendly
- State Texas
- 87 Strongly Landlord-Friendly · R+5
- County
- — inherits STATE
- City
- — inherits STATE
ZIP-level market 75682
- Active inventory
- 7
- Price-to-rent
- 8.6×
Monthly cashflow live
- Estimated rent
- $1,008 medium interval (Pro) →
- Mortgage (P&I)
- −$545
- Tax est. 1.5%
- −$130 /mo · $1,558/yr
- Insurance
- −$43
- HOA
- −$0
- Vacancy / Maint / Mgmt
- −$212
- Net cashflow
- $78
Break-even live
UW: 25.0% down · 7.5% · 30yr · 1.5% tax · 5.0% vac · 8.0% maint · 8.0% mgmt
Financing live
Cash to close
- Down payment
- $25,975
- Closing costs
- $3,117
- Reserves months
- —
- Total cash needed
- —
Loan-product check · same deal, 3 products live
Conventional
25% down · 7.5% · 30yr
- Down + closing
- —
- Monthly P&I
- —
- Monthly cashflow
- —
- DSCR
- —
- Eligible?
- —
Personal DTI + credit; lowest rate.
DSCR
20% down · 8.5% · 30yr
- Down + closing
- —
- Monthly P&I
- —
- Monthly cashflow
- —
- DSCR
- —
- Eligible?
- —
No personal income docs; deal must DSCR.
Hard money
10% down · 12.0% · 12mo
- Down + closing
- —
- Monthly P&I
- —
- Monthly cashflow
- —
- DSCR
- —
- Eligible?
- —
Short-term bridge; refi at stabilization.
Listing history 4 events
-
2026-06-02status $103,900 Pending 91 DOM
-
2026-06-01days on market $103,900 Active 91 DOM
-
2026-05-31days on market $103,900 Active 90 DOM
-
2026-03-02$103,900 Active 827-char remark
Show marketing remark (827 chars)
Situated on a spacious . 706-acre lot, this 1,120 sq. ft. home offers the perfect blend of peaceful country living with convenient access to nearby towns. This 2-bedroom, 2-bathroom home features a functional layout and comfortable living space ready for your personal touch. Outside, you'll find a detached 2-car carport and a small storage shed, providing plenty of room for parking, tools, and outdoor equipment. With nearly three-quarters of an acre, there’s space to garden, entertain, or simply enjoy the privacy and open surroundings. Perfect for first-time buyers, downsizers, or investors looking to expand their portfolio- don’t miss this opportunity! This property has also had recent repairs completed and an updated HVAC unit installed. Please see associated documents for a complete list of repairs.
ⓘ Source: listings_history table (triggers on properties + properties_extension) + one-shot
backfill from property_details.listing_events for pre-trigger history.
Nearby sold comps map
Loading sold comps map…
Walkable amenities ~0.75 mi
Loading nearby amenities…
Taxation est. · year 1
- Rental income
- $12,098
- − Mortgage interest
- −$5,820
- − Property taxes
- −$1,558
- − Insurance
- −$520
- − Repairs & maintenance
- −$968
- − Management
- −$968
- − Depreciation
- −$3,023
- Taxable loss
- −$759
- Est. tax savings @ 24.0%
- +$182
- After-tax cash flow
- $1,123/yr
For passive investors: Depreciation is non-cash, so a rental often shows a tax loss while cash-flowing — sheltering income. Rental losses are passive: they offset passive income freely, and up to $25,000/yr can offset ordinary (W-2) income if you actively participate and your MAGI is under $100k (phasing out to $0 by $150k); unused losses carry forward. On sale, claimed depreciation is recaptured at up to 25%, and gains may owe capital-gains tax (a 1031 exchange can defer both). Figures are a year-1 estimate at your 24.0% rate — not tax advice; consult a CPA.
Condition & rehab AI · 13 photos
This mobile home requires moderate repairs and maintenance to improve its condition and appeal. Painting the exterior siding and trimming the landscaping can significantly enhance its curb appeal, while cleaning the interiors will attract both buyers and renters.
Repairs flagged
- Moderate Exterior siding — Weathered and may need repainting.
- Moderate Landscaping — Overgrown and in need of trimming.
- Minor Kitchen cabinets — Dated but not severely damaged.
- Minor Bathroom fixtures — Dated but functional and not severely damaged.
Value-add opportunities
- Resale Painting exterior siding — Fresh paint can significantly improve curb appeal.
- Resale Landscaping trimming — A well-maintained yard can enhance the home's appeal.
- Both Kitchen cabinet and fixture cleaning — Fresh and clean interiors can attract both buyers and renters.
- Both Bathroom fixture cleaning — Clean bathrooms are essential for both buyers and renters.
Renovation cost estimate screening
| Repair item | Severity | Est. cost |
|---|---|---|
| Exterior siding · Weathered and may need repainting. | Moderate | $3,000–15,000 |
| Landscaping · Overgrown and in need of trimming. | Moderate | $3,000–15,000 |
| Kitchen cabinets · Dated but not severely damaged. | Minor | $500–3,000 |
| Bathroom fixtures · Dated but functional and not severely damaged. | Minor | $500–3,000 |
| Total estimated repair cost · 4 items | $7,000–36,000 |
Value-add ROI direction
- Resale Painting exterior siding — Fresh paint can significantly improve curb appeal. ↑
- Resale Landscaping trimming — A well-maintained yard can enhance the home's appeal. ↑
- Both Kitchen cabinet and fixture cleaning — Fresh and clean interiors can attract both buyers and renters. ↑
- Both Bathroom fixture cleaning — Clean bathrooms are essential for both buyers and renters. ↑
ⓘ Cost ranges are severity-bucket heuristics (US national rule-of-thumb). Get contractor quotes + a written scope before underwriting a rehab budget.
Schools (NCES district)
- District
- West Rusk County Consolidated ISD
- NCES district ID
- 4845150
- Math proficiency
- 41% ▲ 1.00%
- Reading proficiency
- 43% ▲ 1.00%
- Median HH income
- $43,896
- Composite
- 35.57/100
- National rank
- #4902
- State rank
- #351 of 826 in TX
Livability — New London
- Score
- 68/100
- State rank
- #475
- US rank
- #9545
Category grades
Schools grade is shown separately in the Schools card above.
Census & demographics
- Census place
- New London, TX
- City population
- 8,368
- Population (ZIP)
- 713
Population outlook (Rusk County) Hauer SSP2
- Today (2025)
- 52,498 people
- By 2030
- 52,093 · -0.8%
- By 2040
- 50,866 · -3.1%
- By 2050
- 49,696 · -5.3%
- By 2075
- 48,583 · -7.5%
- By 2100
- 43,265 · -17.6%
Race, ethnicity, and origin ACS 2023
- Neighborhood character
- Predominantly White (77%)
- Race & ethnicity
- White 77% Two or more races 18% Native American 4% Hispanic / Latino 2%
- Common ancestry
- Slovak 2% English 1% Serbian 1%
- Foreign-born
- 1% · Canada
- Languages at home
- 98% English-only · Spanish 2%
Political lean MEDSL · Rusk
- 2024 margin
- Solid R (+59.4) · D 20.0% · R 79.4%
- 2008→2024 swing
- -13.2pp toward R · 2008: -46.3pp · 2024: -59.4pp
- All cycles
- 2024: R+59.4 2020: R+55.7 2016: R+56.5 2012: R+51.1 2008: R+46.3
Not yet ingested
- Civics
- —
Market trends
- HPI YoY
- —
- Current HPI
- —
- Rent YoY
- —
- Metro
- —
- State GDP YoY
- ▲ 3.95%
- F500 in state
- 110
Industry mix (Fortune 500 HQ in TX)
| Industry | F500 HQs | Revenue |
|---|---|---|
| Energy | 16 | $1,198B |
|
||
| Technology | 5 | $198B |
|
||
| Engineering / Construction | 4 | $72B |
|
||
| Energy Services | 3 | $60B |
|
||
| Utilities | 3 | $41B |
|
||
| Healthcare | 2 | $330B |
|
||
Price history
1 event — show timeline
- 2026-03-02 Listed $103,900 LAAR
Cash-flow waterfall
monthlySold comps — $/sqft
last 12 mo · ≤1 miLoading sold comps…