 🔨 Auction
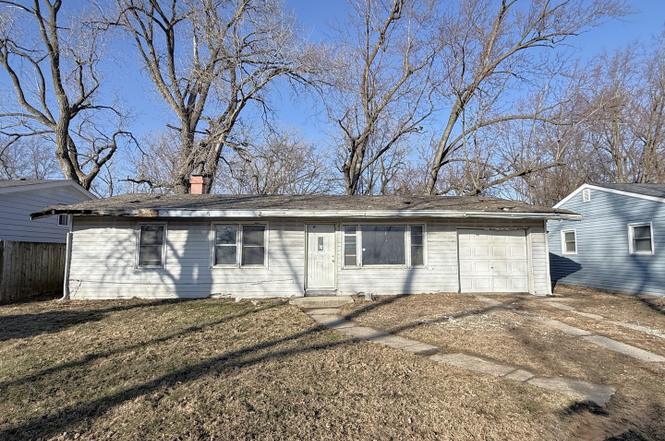
3330 Roesner Dr · Markham, IL
Flood risk 4/10 · Minor
- FEMA flood zone
- X (unshaded)
- Chance of flooding over 30 yrs
- 0.2%
- Est. flood insurance / yr
- $473 – $860
Fire risk 1/10 · Minimal
- Est. fire insurance / yr
- $804 – $1,492
Heat risk 2/10 · Minimal
- Hot days now (above 102°F)
- 7 days/yr
- Hot days in 30 yrs
- 14 days/yr
Wind risk 2/10 · Minimal
- Chance of severe wind over 30 yrs
- —
Air-quality risk 3/10 · Minor
- Unhealthy air days now
- 4 days/yr
- Unhealthy air days in 30 yrs
- 4 days/yr
Risk factors via First Street. Map © Google.
Why this score? — see what drove the D- grade
The composite is a weighted blend of 9 inputs, each scored 0–100. Each bar is that input's sub-score; the figure is the points it added to the 100-point composite (weight × sub-score).
- Appreciation +10.0/10.0
- ARV discount +7.5/15.0
- Cash flow +7.3/30.0
- Livability +3.8/5.0
- Rent growth +2.5/5.0
- Condition / age +2.5/5.0
- 1% rule +2.1/10.0
- DSCR +1.5/10.0
- Schools +1.5/10.0
$37,750
🖨 Deal sheet (PDF) 📄 Offer letter ✓ Due diligence
Listing remarks MLS
HUD FORECLOSURE SALE!CASE#137-062252 SOLD"AS IS". INSURED STATUS:IN. HUD ELEC AUCTION.USE HUD KEY. DISCLSR INCLD LBP, PROP COND REPORT, BIDDING & PROCEDURES SEE SHWNG INSTR. REPLACE FLOORING REPAIR DRYWALL, REPLACE BATH FIXTURES, EVIDENCE OF POSSIBLE MOLD
Key facts
- Quiet street
- 9,147 sq ft lot
- Garage
Tags
Property features AI
Finance
- Other: Home built before 1978
- HOA & community: No master association fee required
Exterior
- Parking: Attached garage (1 garage space, 1 total parking space)
- Utilities: Public water; Public sewer
- Home design: Detached single-family home; One-story layout; Fee simple ownership; Built approximately 61–70 years ago; Property not currently leased
- Construction: Frame construction
- Exterior features: Lot dimensions approximately 60 x 155; Lot is less than 0.25 acre; Subdivision: Country Aire Estates
Interior
- Kitchen: Kitchen on the main level (12 x 10)
- Bedrooms: Three bedrooms (all on the main level); Master bedroom on the main level (11 x 11); Bedroom two on the main level (10 x 10); Bedroom three on the main level (11 x 12)
- Bathrooms: One full bathroom
- Heating & cooling: Natural gas heating with forced air
- Interior features: Six total rooms
- Laundry & utility: Dedicated laundry room
Neighborhood map
What this means for you Summary
Snapshot
- This is a 3-bed/1.0-bath single-family listed at $38k.
Deal economics
- At list price, monthly cash flow is $-274 ($-3k/yr) — negative.
- The deal already cash-flows at list — no discount required.
- Meets the 1% rule at list price ($1k rent vs $38k).
- Recommended offer: $33k (12.0% below list) — sets the bar for market timing.
- Cap rate 4.7% vs local median 10.2% in Markham — below-typical yield; the buyer is paying a premium for something (appreciation thesis, condition, location) that the cap rate doesn't capture.
Location & tenants
- Location reads 76/100 on livability (#186 in IL, #3,539 nationally) — a middle-class / working-renter tenant base. Strengths: commute A+, cost of living A+, housing A+; Watch: crime D, amenities D, employment D.
- Bremen Chsd 228 (suburban): math 15% / reading 17% proficiency, ranked #468 of 620 in IL (top 76%) — low school quality limits family demand, transient renter base, plan for 1-2y turnover.
- Market conditions: 65 active listings in the ZIP; 3 comparable units currently listed for rent nearby; rentals leasing fast (median 7d on market — plan ~1-2 weeks tenant-placement turnaround); 6,272 units permitted in Cook County in 2024 (4,658 in 5+ unit buildings).
Forward outlook
- In year one you build about $22k of equity ($1k loan paydown + $21k appreciation (10.0% local appreciation)).
- By year 2, paydown + projected appreciation supports a ~$36k cash-out refi (75% LTV) — recoverable capital for the next deal without selling this one.
Negotiation context
- It's been on market 148 days — a 12% lower offer ($33k) is reasonable based on typical stale-listing flexibility.
- 4 sale attempts since 19y ago; this cycle's ask has dropped $7k (16%) from the opening price — seller is motivated, your offer sets the floor, not the list.
Risks & watch-outs
- Watch-outs: property tax is 8.2% of price; built in 1959 — expect roof / HVAC / electrical / plumbing capex.
Questions for the listing agent
- What do current leases actually rent for vs. the listed asking? Can we see a recent rent roll and the last 12 months of T-12 income?
- It's been on market 148 days. Have you received any prior offers? Is the seller open to a 12% concession, seller financing, or rate buy-down credit?
- Built in 1959 — when were the roof, HVAC, electrical panel, plumbing, and water heater last replaced?
- Property tax is high relative to price — has the assessment been appealed recently, and will the sale trigger a re-assessment?
- Why hasn't it sold? Are there any deal-killer items the seller is aware of (foundation, flood, title, zoning, code violations)?
- Is there a deadline driving the sale (1031 exchange, divorce, estate, relocation)? That informs how much negotiation room exists.
- Schools are F-rated, which usually means shorter tenancies and higher turnover. Who's the typical renter profile here, and what's been the actual vacancy rate?
- Crime grade is D in this area — have there been break-ins, vandalism, or insurance claims at this property in the last 3 years? What carrier currently insures it and at what premium?
- The area grade is low — what's the realistic commute time and amenity access for the typical tenant pool here? Any planned neighborhood developments (good or bad) we should know about?
- What's the average days-on-market for RENTAL listings here right now (not sales)? A rising rental-DOM trend means longer vacancies and softer asking-rent achievability than the comps imply.
- What's the recent tenant-quality profile in this submarket — average credit score on applications, eviction rate, late-payment / NSF rate, and stable-employment percentage? A property-management company in the area should have these aggregated.
- How much new for-sale + rental construction is in the pipeline within 1–3 miles? Heavy new supply typically softens prices + rents 12–24 months out; constrained supply supports both.
Investment metrics
- 1% rule
- 0.71% ✗
- Cap rate
- 4.71%
- Cash-on-cash
- -5.67%
- DSCR
- 0.75
- GRM
- 11.8
CMA / ARV
- ARV (on-the-fly)
- $207,200
- Comps found
- 12
Show comp detail 12 sales within ~0.75 mi
| Address | Dist | Beds/Ba | Sqft | Sold | Price | $/sf | Match |
|---|---|---|---|---|---|---|---|
| 15313 Cherry Ln | 0.14mi | 3/1.0 | 1,036 (0%) | 3mo | $89,000 | $86 | 91 |
| 15315 Cherry Ln | 0.15mi | 3/1.0 | 1,040 (+0%) | 3mo | $195,000 | $188 | 90 |
| 15422 Cherry Ln | 0.28mi | 3/1.5 | 1,040 (+0%) | 4mo | $175,000 | $168 | 80 |
| 15330 Cherry Ln | 0.23mi | 4/2.0 (+1) | 1,036 (0%) | 2mo | $249,900 | $241 | 79 |
| 14820 Turner Ave | 0.60mi | 3/1.0 | 1,064 (+3%) | 3mo | $150,000 | $141 | 65 |
| 3813 153rd St | 0.62mi | 2/1.0 (-1) | 1,075 (+4%) | 1mo | $268,130 | $249 | 59 |
| 15246 Calitonia Dr | 0.63mi | 3/1.0 | 1,113 (+7%) | 1mo | $137,000 | $123 | 58 |
| 15435 Hamlin Ave | 0.64mi | 3/1.0 | 1,107 (+7%) | 3mo | $155,000 | $140 | 56 |
| 14839 Lawndale Ave | 0.71mi | 3/2.0 | 1,086 (+5%) | 4mo | $217,000 | $200 | 52 |
| 14912 S San Francisco Ave | 0.74mi | 3/1.0 | 936 (-10%) | 1mo | $193,000 | $206 | 49 |
| 15120 Springfield Ave | 0.73mi | 3/2.0 | 1,127 (+9%) | 1mo | $236,000 | $209 | 47 |
| 14825 S Sacramento Ave | 0.75mi | 3/1.0 | 912 (-12%) | 0mo | $222,000 | $243 | 45 |
Match score weights: distance 35% · size 25% · config 20% · recency 20%. Top-matched comps best support the ARV.
Projected returns pro-forma
10.0% appreciation · 3.0% rent growth · sell at horizon
- IRR
- 20.3%
- Equity multiple
- 2.64×
- Total profit
- $95,421
- Equity at exit
- $186,662
- IRR
- 18.5%
- Equity multiple
- 6.08×
- Total profit
- $294,764
- Equity at exit
- $402,544
Cash invested: $58,016 (down + closing). Projections, not guarantees.
Landlord ↔ Tenant lean methodology
- Overall (STATE)
- 43 Moderately Tenant-Leaning
- State Illinois
- 43 Moderately Tenant-Leaning · D+7
- County
- — inherits STATE
- City
- — inherits STATE
ZIP-level market 60428
- Home prices YoY
- 8.5%
- Active inventory
- 65
- Price-to-rent
- 2.1×
Monthly cashflow live
- Estimated rent
- $1,466 medium interval (Pro) →
- Mortgage (P&I)
- −$1,087
- Tax est. 1.5%
- −$259 /mo · $3,108/yr
- Insurance
- −$86
- HOA
- −$0
- Vacancy / Maint / Mgmt
- −$308
- Net cashflow
- $-274
Break-even live
Sensitivity live
| Price | -10% $-131 | -5% $-202 | +0% $-274 | +5% $-346 | +10% $-417 |
|---|---|---|---|---|---|
| Rent | -10% $-390 | -5% $-332 | +0% $-274 | +5% $-216 | +10% $-158 |
| Rate | -1.0pp $-170 | -0.5pp $-221 | base $-274 | +0.5pp $-328 | +1.0pp $-382 |
UW: 25.0% down · 7.5% · 30yr · 1.5% tax · 5.0% vac · 8.0% maint · 8.0% mgmt
Financing live
Cash to close
- Down payment
- $51,800
- Closing costs
- $6,216
- Reserves months
- —
- Total cash needed
- —
Loan-product check · same deal, 3 products live
Conventional
25% down · 7.5% · 30yr
- Down + closing
- —
- Monthly P&I
- —
- Monthly cashflow
- —
- DSCR
- —
- Eligible?
- —
Personal DTI + credit; lowest rate.
DSCR
20% down · 8.5% · 30yr
- Down + closing
- —
- Monthly P&I
- —
- Monthly cashflow
- —
- DSCR
- —
- Eligible?
- —
No personal income docs; deal must DSCR.
Hard money
10% down · 12.0% · 12mo
- Down + closing
- —
- Monthly P&I
- —
- Monthly cashflow
- —
- DSCR
- —
- Eligible?
- —
Short-term bridge; refi at stabilization.
Rent comps 3 comps
| Address | Beds | Baths | Sqft | Rent | $/sqft | DOM | Units | Dist |
|---|---|---|---|---|---|---|---|---|
| 3349 147th St Unit 3240 06 Midlothian, IL | 2.0 | 1.0 | 817 | $1,500 | $1.84 | 6d | 1 | 0.72mi |
| 3542 147th St Midlothian, IL | 2.0 | 1.0 | 817 | $1,500 | $1.84 | 7d | 2 | 0.83mi |
| 14521 Richmond Ave Unit 3 Posen, IL | 2.0 | 1.0 | 850 | $1,375 | $1.62 | 25d | 1 | 1.06mi |
Listing history 24 events
-
2026-06-18price $37,750 Active 148 DOM
-
2026-06-18days on market $44,900 Active 148 DOM
-
2026-06-17days on market $44,900 Active 147 DOM
-
2026-06-16days on market $44,900 Active 146 DOM
-
2026-06-15days on market $44,900 Active 145 DOM
-
2026-06-13days on market $44,900 Active 143 DOM
-
2026-06-09days on market $44,900 Active 139 DOM
-
2026-06-08days on market $44,900 Active 138 DOM
-
2026-06-07statusdays on market $44,900 Active 137 DOM
-
2026-06-04days on market $44,900 Contingent - Continue to Show 134 DOM
-
2026-06-03days on market $44,900 Contingent - Continue to Show 133 DOM
-
2026-06-02days on market $44,900 Contingent - Continue to Show 132 DOM
-
2026-06-01days on market $44,900 Contingent - Continue to Show 131 DOM
-
2026-05-31days on market $44,900 Contingent - Continue to Show 130 DOM
-
2026-04-30historical Contingent - Continue to Show
-
2026-04-20status Active
-
2026-04-13historical Contingent - Continue to Show
-
2026-04-06status Active
-
2026-02-06historical Contingent - Continue to Show
-
2026-01-21$44,900 Active
-
2007-05-17soldstatus $58,275 269-char remark
Show marketing remark (269 chars)
HUD FORECLOSURE SALE!CASE#137-062252 SOLD"AS IS". INSURED STATUS:IN. HUD ELEC AUCTION.USE HUD KEY. DISCLSR INCLD LBP, PROP COND REPORT, BIDDING & PROCEDURES SEE SHWNG INSTR. REPLACE FLOORING REPAIR DRYWALL, REPLACE BATH FIXTURES, EVIDENCE OF POSSIBLE MOLD
-
2007-02-20historical 269-char remark
Show marketing remark (269 chars)
HUD FORECLOSURE SALE!CASE#137-062252 SOLD"AS IS". INSURED STATUS:IN. HUD ELEC AUCTION.USE HUD KEY. DISCLSR INCLD LBP, PROP COND REPORT, BIDDING & PROCEDURES SEE SHWNG INSTR. REPLACE FLOORING REPAIR DRYWALL, REPLACE BATH FIXTURES, EVIDENCE OF POSSIBLE MOLD
-
2007-02-09$61,000 269-char remark
Show marketing remark (269 chars)
HUD FORECLOSURE SALE!CASE#137-062252 SOLD"AS IS". INSURED STATUS:IN. HUD ELEC AUCTION.USE HUD KEY. DISCLSR INCLD LBP, PROP COND REPORT, BIDDING & PROCEDURES SEE SHWNG INSTR. REPLACE FLOORING REPAIR DRYWALL, REPLACE BATH FIXTURES, EVIDENCE OF POSSIBLE MOLD
-
2000-10-10soldstatus $60,000
ⓘ Source: listings_history table (triggers on properties + properties_extension) + one-shot
backfill from property_details.listing_events for pre-trigger history.
Climate risk First Street
- Flood 4/10 Moderate FEMA zone X (unshaded) · 20% chance over 30 yrs
- Wildfire 1/10 Low
- Heat 2/10 Low 7 d/yr ≥102°F today · 14 d/yr by 30 yrs out
- Wind 2/10 Low
- Air quality 3/10 Moderate 4 unhealthy d/yr today · 4 by 30 yrs out
Nearby sold comps map
Loading sold comps map…
Walkable amenities ~0.75 mi
Loading nearby amenities…
Taxation est. · year 1
- Rental income
- $17,589
- − Mortgage interest
- −$11,606
- − Property taxes
- −$3,108
- − Insurance
- −$1,036
- − Repairs & maintenance
- −$1,407
- − Management
- −$1,407
- − Depreciation
- −$6,028
- Taxable loss
- −$7,003
- Est. tax savings @ 24.0%
- +$1,681
- After-tax cash flow
- $-1,607/yr
For passive investors: Depreciation is non-cash, so a rental often shows a tax loss while cash-flowing — sheltering income. Rental losses are passive: they offset passive income freely, and up to $25,000/yr can offset ordinary (W-2) income if you actively participate and your MAGI is under $100k (phasing out to $0 by $150k); unused losses carry forward. On sale, claimed depreciation is recaptured at up to 25%, and gains may owe capital-gains tax (a 1031 exchange can defer both). Figures are a year-1 estimate at your 24.0% rate — not tax advice; consult a CPA.
Schools (NCES district)
- District
- Bremen Chsd 228
- NCES district ID
- 1707050
- Math proficiency
- 15% ▼ -4.00%
- Reading proficiency
- 17% ▼ -5.00%
- Median HH income
- $57,625
- Composite
- 15.32/100
- National rank
- #9327
- State rank
- #468 of 620 in IL
Livability — Markham
- Score
- 76/100
- State rank
- #186
- US rank
- #3539
Category grades
Schools grade is shown separately in the Schools card above.
Census & demographics
- Census place
- Markham, IL
- City population
- 10,980
- Population (ZIP)
- 10,980
Population outlook (Cook County) Hauer SSP2
- Today (2025)
- 5,347,519 people
- By 2030
- 5,357,703 · +0.2%
- By 2040
- 5,324,924 · -0.4%
- By 2050
- 5,230,762 · -2.2%
- By 2075
- 4,785,735 · -10.5%
- By 2100
- 4,188,836 · -21.7%
Race, ethnicity, and origin ACS 2023
- Neighborhood character
- Predominantly Black (69%)
- Race & ethnicity
- Black 69% Hispanic / Latino 17% White 11% Two or more races 4%
- Hispanic origin (detail)
- Mexican 16%
- Common ancestry
- Romanian 1% Lithuanian 1% Iranian 1%
- Foreign-born
- 8% · Canada
- Languages at home
- 86% English-only · Spanish 14%
Political lean MEDSL · Cook
- 2024 margin
- Solid D (+42.0) · D 70.4% · R 28.4% · Other 1.2%
- 2008→2024 swing
- -11.4pp toward R · 2008: 53.4pp · 2024: 42.0pp
- All cycles
- 2024: D+42.0 2020: D+50.3 2016: D+53.0 2012: D+49.4 2008: D+53.4
Not yet ingested
- Civics
- —
Market trends
- HPI YoY
- ▲ 23.63%
- Current HPI
- 302.333
- Rent YoY
- —
- Metro
- —
- State GDP YoY
- ▲ 1.59%
- F500 in state
- 60
Industry mix (Fortune 500 HQ in IL)
| Industry | F500 HQs | Revenue |
|---|---|---|
| Insurance | 4 | $201B |
|
||
| Consumer Goods | 4 | $87B |
|
||
| Industrial Machinery | 3 | $64B |
|
||
| Healthcare | 2 | $55B |
|
||
| Retail / Pharmacy | 1 | $148B |
|
||
| Agriculture / Food | 1 | $86B |
|
||
Price history
-25.2% since first listed10 events — show timeline
- 2026-04-30 Contingent — MRED as Distributed by MLS Grid
- 2026-04-20 Relisted — MRED as Distributed by MLS Grid
- 2026-04-13 Contingent — MRED as Distributed by MLS Grid
- 2026-04-06 Relisted — MRED as Distributed by MLS Grid
- 2026-02-06 Contingent — MRED as Distributed by MLS Grid
- 2026-01-21 Listed $44,900 MRED as Distributed by MLS Grid
- 2007-05-17 Sold (MLS) $58,275 MRED as Distributed by MLS Grid
- 2007-02-20 Listing Removed — MRED as Distributed by MLS Grid
- 2007-02-09 Listed $61,000 MRED as Distributed by MLS Grid
- 2000-10-10 Sold (Public Records) $60,000 Public Records
Property tax history
+3.0%/yrLatest (2023): $3,568 · +299.5% YoY. Source: county tax records.
Cash-flow waterfall
monthlySold comps — $/sqft
last 12 mo · ≤1 miLoading sold comps…