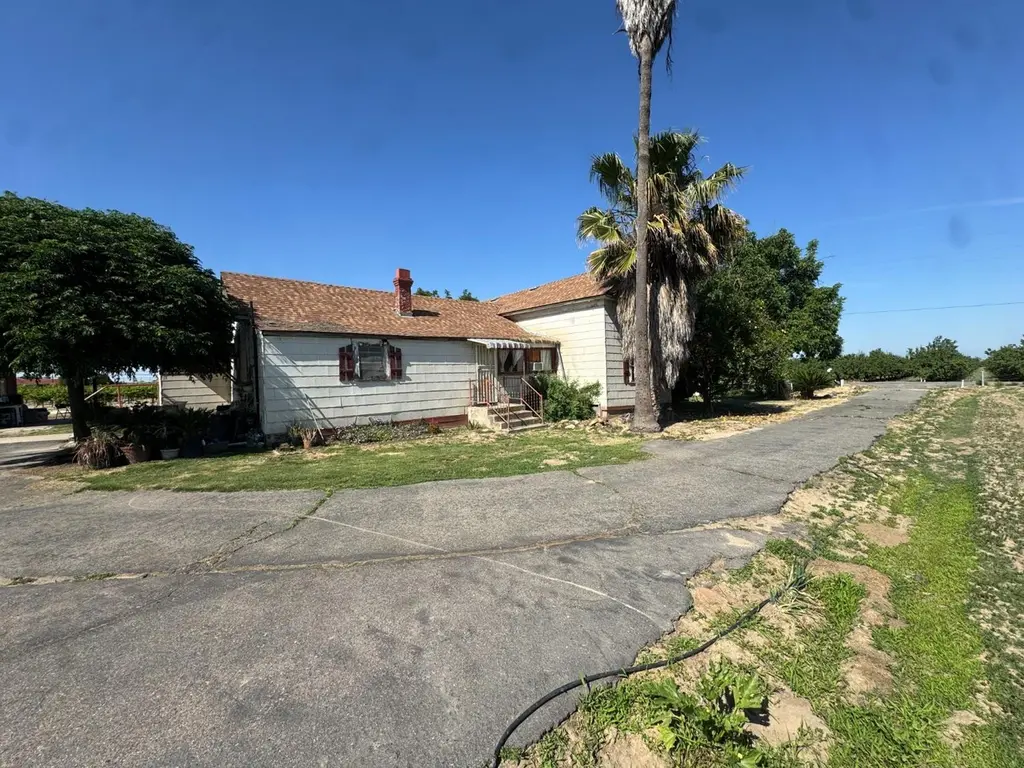
8138 S Kenneth Ave · Fowler, CA
Flood risk No data
- FEMA flood zone
- —
- Chance of flooding over 30 yrs
- —
- Est. flood insurance / yr
- —
Fire risk No data
- Est. fire insurance / yr
- —
Heat risk No data
- Hot days now (above threshold)
- —
- Hot days in 30 yrs
- —
Wind risk No data
- Chance of severe wind over 30 yrs
- —
Air-quality risk No data
- Unhealthy air days now
- —
- Unhealthy air days in 30 yrs
- —
Risk factors via First Street. Map © Google.
Why this score? — see what drove the D+ grade
The composite is a weighted blend of 9 inputs, each scored 0–100. Each bar is that input's sub-score; the figure is the points it added to the 100-point composite (weight × sub-score).
- Cash flow +11.8/30.0
- Appreciation +10.0/10.0
- ARV discount +7.5/15.0
- Rent growth +5.0/5.0
- DSCR +3.5/10.0
- 1% rule +3.4/10.0
- Livability +3.3/5.0
- Schools +2.9/10.0
- Condition / age +2.2/5.0
$950,000
🖨 Deal sheet 📄 Offer letter ✓ Due diligence
Listing remarks
Charming Country Property with Producing Vineyard & Investment Potential in Fowler, CAWelcome to 8139 S Kenneth Ave, Fowler, CA 93625 a rare opportunity to own a charming older farm home paired with a productive agricultural setup and exciting future development potential. The property features a good-producing Thompson vineyard, offering immediate income potential along with the benefits of established farming infrastructure. Supported by double source water, including Consolidated Irrigation District (CID) surface water allocation and delivery, this ranch is well-equipped for reliable and efficient agricultural operations. The home itself carries classic country charm and is ready
Key facts
- Agricultural setup
- Large equipment shop
- Producing vineyard
Tags
Property features AI
Exterior
- Parking: 1-car garage
- Utilities: Electric service available; Sewer is septic tank; Public utilities available; Propane available
- Home design: Single family residence
- Construction: Wood siding; Composition roof; Wood subfloor foundation; No solar panels
- Exterior features: Rural setting; One level
Interior
- Bathrooms: 2 bathrooms
- Heating & cooling: Other heating; Other cooling
- Interior features: Laundry is inside the home
- Laundry & utility: In‑home laundry
Neighborhood map
What this means for you Summary
Snapshot
- This is a 3-bed/2.0-bath single-family listed at $950k. Condition is rated fair.
Deal economics
- At list price, monthly cash flow is $-257 ($-3k/yr) — negative.
- To cash-flow at today's rent, offer at most $913k (3.9% below list).
- To meet the 1% rule (rent ≥ 1% of price), the offer needs to be $799k (15.9% below list).
- Recommended offer: $799k (15.9% below list) — sets the bar for 1% rule.
Location & tenants
- Location reads 66/100 on livability (#350 in CA) — a middle-class / working-renter tenant base. Strengths: housing A+, commute B+; Watch: crime D, amenities F, cost of living F.
- Fowler Unified (town): math 27% / reading 42% proficiency, ranked #287 of 517 in CA (top 56%) — families likely to look elsewhere, expect single-tenant / working-renter base with shorter leases; 66% free/reduced lunch — lower-income household profile, screen leases tightly.
- Zoned schools: Fremont Elementary (math 28% / reading 37%, grade F, #771 of 1,571 statewide, top 49%, 476 students, 83% FRL); John Sutter Middle (math 28% / reading 45%, grade F, #175 of 498 statewide, top 36%, 621 students, 87% FRL); Fowler High (math 27% / reading 52%, grade F, #532 of 1,170 statewide, top 48%, 818 students, 85% FRL) — zoned schools average 85% FRL vs 66% district-wide (19 pts higher); higher-poverty schools than district average — tighter screening recommended.
- Market conditions: Rents rising fast (+12.4%/yr); 91 active listings in the ZIP; 1 comparable units currently listed for rent nearby; high-income renter base; 2,426 units permitted in Fresno County in 2024 (296 in 5+ unit buildings).
- At $7,985/mo this rent would consume 55% of the median local household income ($175k/yr) (locally 767% of renters already pay >50% of income on rent) — very limited rent-growth headroom before tenants either downsize or default.
Forward outlook
- In year one you build about $102k of equity ($7k loan paydown + $95k appreciation (10.0% local appreciation)).
- Fresno County population projected at +11% by 2050 — modest demand growth; plan on rents tracking national, not racing it.
- By year 2, paydown + projected appreciation supports a ~$163k cash-out refi (75% LTV) — recoverable capital for the next deal without selling this one.
Negotiation context
- It's been on market 53 days — a 3% lower offer ($922k) is reasonable based on typical stale-listing flexibility.
Risks & watch-outs
- Watch-outs: built in 1910 — expect roof / HVAC / electrical / plumbing capex.
Questions for the listing agent
- What do current leases actually rent for vs. the listed asking? Can we see a recent rent roll and the last 12 months of T-12 income?
- It's been on market 53 days. Have you received any prior offers? Is the seller open to a 16% concession, seller financing, or rate buy-down credit?
- Have any recent inspections been done? Can we get a copy of the seller's disclosures and any deferred-maintenance estimates?
- Built in 1910 — when were the roof, HVAC, electrical panel, plumbing, and water heater last replaced?
- Is there a deadline driving the sale (1031 exchange, divorce, estate, relocation)? That informs how much negotiation room exists.
- Crime grade is D in this area — have there been break-ins, vandalism, or insurance claims at this property in the last 3 years? What carrier currently insures it and at what premium?
- The area grade is low — what's the realistic commute time and amenity access for the typical tenant pool here? Any planned neighborhood developments (good or bad) we should know about?
- What's the average days-on-market for RENTAL listings here right now (not sales)? A rising rental-DOM trend means longer vacancies and softer asking-rent achievability than the comps imply.
- What's the recent tenant-quality profile in this submarket — average credit score on applications, eviction rate, late-payment / NSF rate, and stable-employment percentage? A property-management company in the area should have these aggregated.
- How much new for-sale + rental construction is in the pipeline within 1–3 miles? Heavy new supply typically softens prices + rents 12–24 months out; constrained supply supports both.
Investment metrics
- 1% rule
- 0.84% ✗
- Cap rate
- 5.97%
- Cash-on-cash
- -1.16%
- DSCR
- 0.95
- GRM
- 9.9
CMA / ARV
- ARV (median comp)
- $485,880
- List price
- $950,000
- Delta
- 95.52%
- Verdict
- OVERPRICED
- Comps
- 20 within 1.0 mi
Show comp detail 6 sales within ~0.75 mi
| Address | Dist | Beds/Ba | Sqft | Sold | Price | $/sf | Match |
|---|---|---|---|---|---|---|---|
| 906 Philip Ave | 0.51mi | 3/2.0 | 1,694 (+11%) | 1mo | $429,990 | $254 | 56 |
| 826 Philip Ave | 0.52mi | 3/2.0 | 1,694 (+11%) | 8mo | $469,990 | $277 | 50 |
| 1444 Clara Ave | 0.58mi | 3/2.0 | 1,694 (+11%) | 8mo | $478,240 | $282 | 48 |
| 1353 Clara Ave | 0.67mi | 3/2.0 | 1,694 (+11%) | 12mo | $477,990 | $282 | 40 |
| 1422 W Marc Ave | 0.59mi | 3/2.0 | 1,694 (+11%) | 17mo | $459,990 | $272 | 40 |
| 1442 W Ryan Ct | 0.58mi | 3/2.0 | 1,694 (+11%) | 23mo | $409,990 | $242 | 35 |
Match score weights: distance 35% · size 25% · config 20% · recency 20%. Top-matched comps best support the ARV.
Projected returns pro-forma
10.0% appreciation · 8.0% rent growth · sell at horizon
- IRR
- 25.1%
- Equity multiple
- 3.04×
- Total profit
- $543,344
- Equity at exit
- $855,835
- IRR
- 23.5%
- Equity multiple
- 7.46×
- Total profit
- $1,717,714
- Equity at exit
- $1,845,641
Cash invested: $266,000 (down + closing). Projections, not guarantees.
Landlord ↔ Tenant lean methodology
- Overall (STATE)
- 18 Strongly Tenant-Friendly
- State California
- 18 Strongly Tenant-Friendly · D+13
- County
- — inherits STATE
- City
- — inherits STATE
ZIP-level market 92625
- Home prices YoY
- 3.5%
- Rents YoY
- 12.4%
- Active inventory
- 91
- Price-to-rent
- 9.9×
Monthly cashflow live
- Estimated rent
- $7,985 medium interval (Pro) →
- Mortgage (P&I)
- −$4,982
- Tax est. 1.5%
- −$1,188 /mo · $14,250/yr
- Insurance
- −$396
- HOA
- −$0
- Vacancy / Maint / Mgmt
- −$1,677
- Net cashflow
- $-257
Break-even live
UW: 25.0% down · 7.5% · 30yr · 1.5% tax · 5.0% vac · 8.0% maint · 8.0% mgmt
Financing live
Cash to close
- Down payment
- $237,500
- Closing costs
- $28,500
- Reserves months
- —
- Total cash needed
- —
Loan-product check · same deal, 3 products live
Conventional
25% down · 7.5% · 30yr
- Down + closing
- —
- Monthly P&I
- —
- Monthly cashflow
- —
- DSCR
- —
- Eligible?
- —
Personal DTI + credit; lowest rate.
DSCR
20% down · 8.5% · 30yr
- Down + closing
- —
- Monthly P&I
- —
- Monthly cashflow
- —
- DSCR
- —
- Eligible?
- —
No personal income docs; deal must DSCR.
Hard money
10% down · 12.0% · 12mo
- Down + closing
- —
- Monthly P&I
- —
- Monthly cashflow
- —
- DSCR
- —
- Eligible?
- —
Short-term bridge; refi at stabilization.
Rent comps 1 comps
| Address | Beds | Baths | Sqft | Rent | $/sqft | DOM | Units | Dist |
|---|---|---|---|---|---|---|---|---|
| 1122 Marc Ave Fowler, CA | 3.0 | 2.0 | 1433 | $2,500 | $1.74 | 14d | 1 | 0.89mi |
Listing history 16 events
-
2026-06-18days on market $950,000 Active 53 DOM
-
2026-06-17days on market $950,000 Active 52 DOM
-
2026-06-16days on market $950,000 Active 51 DOM
-
2026-06-15days on market $950,000 Active 50 DOM
-
2026-06-13days on market $950,000 Active 48 DOM
-
2026-06-13days on market $950,000 Active 47 DOM
-
2026-06-10days on market $950,000 Active 45 DOM
-
2026-06-09days on market $950,000 Active 44 DOM
-
2026-06-08days on market $950,000 Active 43 DOM
-
2026-06-07days on market $950,000 Active 42 DOM
-
2026-06-05days on market $950,000 Active 39 DOM
-
2026-06-03days on market $950,000 Active 38 DOM
-
2026-06-02days on market $950,000 Active 37 DOM
-
2026-06-01days on market $950,000 Active 36 DOM
-
2026-05-31days on market $950,000 Active 35 DOM
-
2026-04-26$950,000 Active 1289-char remark
ⓘ Source: listings_history table (triggers on properties + properties_extension) + one-shot
backfill from property_details.listing_events for pre-trigger history.
Nearby sold comps map
Loading sold comps map…
Walkable amenities ~0.75 mi
Loading nearby amenities…
Taxation est. · year 1
- Rental income
- $95,821
- − Mortgage interest
- −$53,215
- − Property taxes
- −$14,250
- − Insurance
- −$4,750
- − Repairs & maintenance
- −$7,666
- − Management
- −$7,666
- − Depreciation
- −$27,636
- Taxable loss
- −$19,362
- Est. tax savings @ 24.0%
- +$4,647
- After-tax cash flow
- $1,562/yr
For passive investors: Depreciation is non-cash, so a rental often shows a tax loss while cash-flowing — sheltering income. Rental losses are passive: they offset passive income freely, and up to $25,000/yr can offset ordinary (W-2) income if you actively participate and your MAGI is under $100k (phasing out to $0 by $150k); unused losses carry forward. On sale, claimed depreciation is recaptured at up to 25%, and gains may owe capital-gains tax (a 1031 exchange can defer both). Figures are a year-1 estimate at your 24.0% rate — not tax advice; consult a CPA.
Condition & rehab AI · 11 photos
This charming older farm home with a producing vineyard presents moderate rehabilitation needs, primarily in the kitchen, bathrooms, and exterior. Upgrading these areas can significantly increase its resale and rental value.
Repairs flagged
- Minor Kitchen countertops — Worn appearance
- Minor Bathroom fixtures — Old and worn
- Moderate Exterior siding — Wear and discoloration
- Moderate Windows — Old and may need replacement
- Moderate Flooring — Worn and may need replacement
Value-add opportunities
- Both Kitchen renovation — Modernizing the kitchen can increase both resale and rental value.
- Both Bathroom updates — Updating bathrooms can significantly boost both resale and rental appeal.
- Both Exterior painting and siding repair — Fresh paint and repairs can enhance curb appeal and property value.
- Both Window replacement — New windows can improve energy efficiency and increase property value.
- Both Landscaping and curb appeal — A well-maintained yard can attract more buyers and renters, increasing property value.
Renovation cost estimate screening
| Repair item | Severity | Est. cost |
|---|---|---|
| Kitchen countertops · Worn appearance | Minor | $500–3,000 |
| Bathroom fixtures · Old and worn | Minor | $500–3,000 |
| Exterior siding · Wear and discoloration | Moderate | $3,000–15,000 |
| Windows · Old and may need replacement | Moderate | $3,000–15,000 |
| Flooring · Worn and may need replacement | Moderate | $3,000–15,000 |
| Total estimated repair cost · 5 items | $10,000–51,000 |
Value-add ROI direction
- Both Kitchen renovation — Modernizing the kitchen can increase both resale and rental value. ↑
- Both Bathroom updates — Updating bathrooms can significantly boost both resale and rental appeal. ↑
- Both Exterior painting and siding repair — Fresh paint and repairs can enhance curb appeal and property value. ↑
- Both Window replacement — New windows can improve energy efficiency and increase property value. ↑
- Both Landscaping and curb appeal — A well-maintained yard can attract more buyers and renters, increasing property value. ↑
ⓘ Cost ranges are severity-bucket heuristics (US national rule-of-thumb). Get contractor quotes + a written scope before underwriting a rehab budget.
Schools (NCES district)
- District
- Fowler Unified
- NCES district ID
- 0614250
- Math proficiency
- 27% ▼ -10.00%
- Reading proficiency
- 42% ▼ -9.00%
- Median HH income
- $44,280
- Composite
- 29.33/100
- National rank
- #6545
- State rank
- #287 of 517 in CA
Livability — Fowler
- Score
- 66/100
- State rank
- #350
- US rank
- #11939
Category grades
Schools grade is shown separately in the Schools card above.
Census & demographics
- County
- Orange County · 3,096,323 people
- City population
- 8,889
- Metro
- Los Angeles-Long Beach-Anaheim, CA
- Population (ZIP)
- 12,294
- Household income
- $174,904
- Rent vs Own
- Severe rent burden
- 767.0
Population outlook (Fresno County) Hauer SSP2
- Today (2025)
- 1,042,971 people
- By 2030
- 1,072,198 · +2.8%
- By 2040
- 1,122,408 · +7.6%
- By 2050
- 1,157,251 · +11.0%
- By 2075
- 1,182,575 · +13.4%
- By 2100
- 1,105,899 · +6.0%
Race, ethnicity, and origin ACS 2023
- Neighborhood character
- Predominantly White (77%)
- Race & ethnicity
- White 77% Hispanic / Latino 10% Two or more races 10% Asian 8%
- Hispanic origin (detail)
- Mexican 7%
- Common ancestry
- Scotch-Irish 5% Slovak 5% Italian 4%
- Foreign-born
- 15% · Canada, China, Vietnam
- Languages at home
- 82% English-only · Spanish 6% Other Indo-European 5% Chinese 3%
Political lean MEDSL · Fresno
- 2024 margin
- Toss-up / Even · D 46.5% · R 50.9% · Other 2.6%
- 2008→2024 swing
- -6.5pp toward R · 2008: 2.1pp · 2024: -4.4pp
- All cycles
- 2024: R+4.4 2020: D+7.8 2016: D+3.9 2012: R+2.9 2008: D+2.1
Not yet ingested
- Civics
- —
Market trends
- HPI YoY
- ▲ 16.70%
- Current HPI
- 494.6724
- Rent YoY
- ▲ 12.39%
- Metro
- Los Angeles-Long Beach-Anaheim, CA
- State GDP YoY
- ▲ 3.21%
- F500 in state
- 116
Industry mix (Fortune 500 HQ in CA)
| Industry | F500 HQs | Revenue |
|---|---|---|
| Technology | 27 | $1,492B |
|
||
| Financial Services | 3 | $174B |
|
||
| Retail | 3 | $44B |
|
||
| Insurance | 3 | $26B |
|
||
| Media / Entertainment | 2 | $115B |
|
||
| Pharmaceuticals / Biotech | 2 | $62B |
|
||
Price history
1 event — show timeline
- 2026-04-26 Listed $950,000 FRESNOMLS
Cash-flow waterfall
monthlySold comps — $/sqft
last 12 mo · ≤1 miLoading sold comps…