 Multi-family
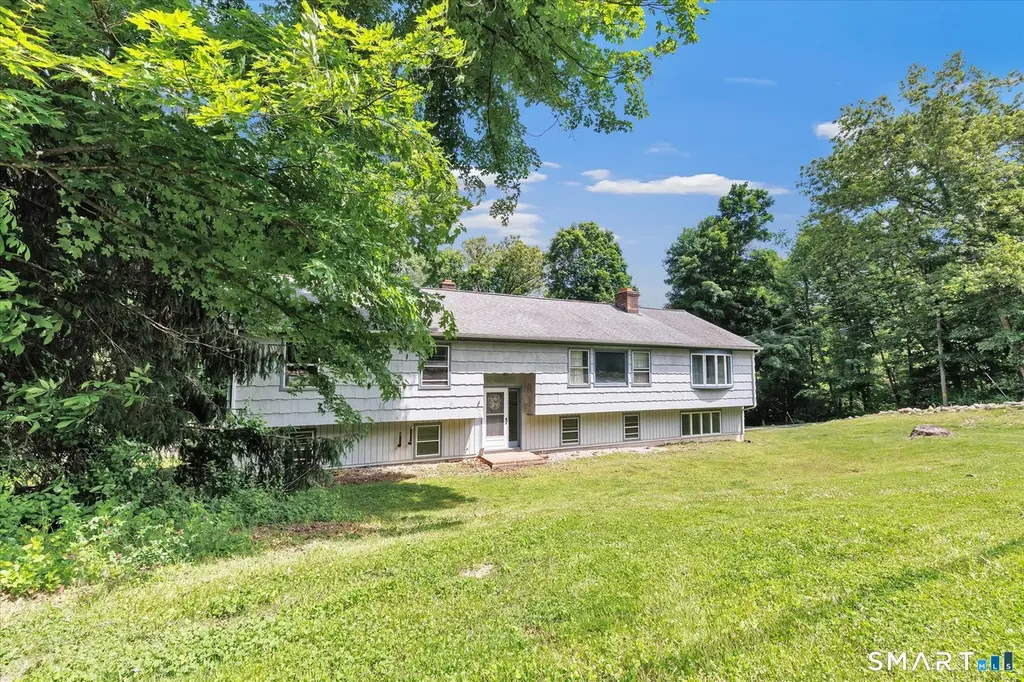
119 Freeman Rd · Oxford, CT
Flood risk 1/10 · Minimal
- FEMA flood zone
- X (unshaded)
- Chance of flooding over 30 yrs
- 0.0%
- Est. flood insurance / yr
- $473 – $860
Fire risk 3/10 · Minor
- Est. fire insurance / yr
- $829 – $1,539
Heat risk 5/10 · Moderate
- Hot days now (above 98°F)
- 7 days/yr
- Hot days in 30 yrs
- 16 days/yr
Wind risk 6/10 · Moderate
- Chance of severe wind over 30 yrs
- 27.0%
Air-quality risk 3/10 · Minor
- Unhealthy air days now
- 3 days/yr
- Unhealthy air days in 30 yrs
- 4 days/yr
Risk factors via First Street. Map © Google.
Why this score? — see what drove the D+ grade
The composite is a weighted blend of 9 inputs, each scored 0–100. Each bar is that input's sub-score; the figure is the points it added to the 100-point composite (weight × sub-score).
- Cash flow +16.4/30.0
- ARV discount +7.5/15.0
- DSCR +5.1/10.0
- Schools +4.9/10.0
- 1% rule +3.9/10.0
- Rent growth +2.5/5.0
- Livability +2.5/5.0
- Condition / age +2.5/5.0
- Appreciation +0.0/10.0
$565,000
🖨 Deal sheet (PDF) 📄 Offer letter ✓ Due diligence
Multi-family units
County records classify this as Multi-Family (2-4 Unit). Listing-text estimate: 1 unit. estimate disagrees with records
Listing remarks MLS
HIGHEST AND BEST TO BE IN BY 5PM 9/1/2020 Welcome to 119 Freeman Road. This spacious raised ranch with a legal in-law is just waiting for your finishing touches. The property offers access via a driveway on either side of the property. The back yard is nice and level with lots of space. The interior is clean and neat, but ready for a rehab or move right in. The main section of the house offers three full bedrooms and two full baths, a large eat-in kitchen and oversized family room. The lower level is currently gutted and is plumbed for a full bath. The legal in-law is on two levels with a chair lift in place. The lower level offers a full kitchen, eat in area and a 1/2 bath. The upper level offers a bedroom with full bath and living room with easy access to the main section of the house. The perfect setup for multi generational families. Property is being sold as is. Come see what this large property has to offer. Deeded access to Lake Zoar and i n the alcove around the corner. Detailed in the deed.
Key facts
- Flexible layout
- Private entrances
- Finished basement
Tags
Property features AI
Exterior
- Parking: Attached 2-car garage
- Utilities: Private well water; Septic system; Oil fuel tank located in garage
- Home design: Single-family home
- Construction: Frame construction; Shingle and wood siding; Asphalt shingle roof; Concrete foundation
- Exterior features: Deck; Patio; Shed; Gutters; Exterior lighting; Above-ground swimming pool; Treed, dry lot; Walk-to-water access and beach rights
Interior
- Kitchen: Electric range; Microwave; Refrigerator; Dishwasher
- Bedrooms: 5 bedrooms
- Bathrooms: 4 full bathrooms; 1 half bathroom
- Heating & cooling: Hot water heat (oil-fired); Tankless hot water
- Interior features: Open floor plan; In-law apartment with separate entry; One fireplace; Full, heated, partially finished walk-out basement; Attic with pull-down stairs
- Laundry & utility: Washer; Dryer; Laundry room on lower level
Neighborhood map
What this means for you Summary
Snapshot
- This is a 4-bed/4.0-bath multifamily listed at $565k.
Deal economics
- At list price, monthly cash flow is $319 ($4k/yr) — positive.
- The deal already cash-flows at list — no discount required.
- To meet the 1% rule (rent ≥ 1% of price), the offer needs to be $502k (11.2% below list).
- Recommended offer: $502k (11.2% below list) — sets the bar for 1% rule.
Location & tenants
- Location reads: area grade D — affects rentability + tenant quality, not the cash-flow math above.
- Oxford School District (rural): math 42% / reading 61% proficiency, ranked #67 of 153 in CT (top 44%) — acceptable for families but not a draw, mixed tenant base, ~2y average lease; only 6% free/reduced lunch — higher-income household profile.
- Zoned schools: Quaker Farms School (405 students, 15% FRL); Oxford Middle School (math 33% / reading 57%, grade D, #92 of 175 statewide, top 52%, 410 students, 15% FRL); Oxford High School (math 47% / reading 67%, grade C, #52 of 194 statewide, top 31%, 527 students, 12% FRL).
- Market conditions: 71 active listings in the ZIP; 502 units permitted in Naugatuck Valley Planning Region in 2024 (171 in 5+ unit buildings).
Forward outlook
- Local home prices are declining (-3.0%/yr); year-one equity from $4k of loan paydown is wiped out by about $17k of value loss. Plan a longer hold.
Negotiation context
- It's been on market 18 days — a 2% lower offer ($557k) is reasonable based on typical stale-listing flexibility.
- 2 sale attempts since 6y ago with the ask held roughly flat each time — persistent listings suggest the price (not the market) is what's stuck; bring a comps-based counter.
- Current owner paid $318k; list at $565k implies a 78% gain — meaningful room to come down on a strong offer.
Risks & watch-outs
- Climate carrying-cost: major wind risk, 27% chance of damaging wind over 30y; extreme-heat days projected 7→16/yr by 2055 (HVAC capex compounding) — expect insurance premiums to compound above CPI over the hold.
Questions for the listing agent
- Built in 1977 — when were the roof, HVAC, electrical panel, plumbing, and water heater last replaced?
- Is there a deadline driving the sale (1031 exchange, divorce, estate, relocation)? That informs how much negotiation room exists.
- The area grade is low — what's the realistic commute time and amenity access for the typical tenant pool here? Any planned neighborhood developments (good or bad) we should know about?
- What's the average days-on-market for RENTAL listings here right now (not sales)? A rising rental-DOM trend means longer vacancies and softer asking-rent achievability than the comps imply.
- What's the recent tenant-quality profile in this submarket — average credit score on applications, eviction rate, late-payment / NSF rate, and stable-employment percentage? A property-management company in the area should have these aggregated.
- How much new apartment / multifamily construction is in the pipeline within 1–3 miles? Heavy new supply (>2% of stock underway) typically softens rents 12–24 months out; light construction supports rent growth.
Investment metrics
- 1% rule
- 0.89% ✗
- Cap rate
- 6.97%
- Cash-on-cash
- 2.42%
- DSCR
- 1.11
- GRM
- 9.4
CMA / ARV
No comps found within radius.
Projected returns pro-forma
-3.0% appreciation · 3.0% rent growth · sell at horizon
- IRR
- -12.5%
- Equity multiple
- 0.55×
- Total profit
- $-71,307
- Equity at exit
- $84,243
- IRR
- -3.4%
- Equity multiple
- 0.77×
- Total profit
- $-36,254
- Equity at exit
- $48,851
Cash invested: $158,200 (down + closing). Projections, not guarantees.
Landlord ↔ Tenant lean methodology
- Overall (STATE)
- 27 Tenant-Leaning
- State Connecticut
- 27 Tenant-Leaning · D+7
- County
- — inherits STATE
- City
- — inherits STATE
ZIP-level market 06478
- Active inventory
- 71
- Price-to-rent
- 31.1×
Monthly cashflow live
- Estimated rent
- $5,018 medium interval (Pro) →
- Mortgage (P&I)
- −$2,963
- Tax from tax record
- −$447 /mo · $5,360/yr
- Insurance
- −$235
- HOA
- −$0
- Vacancy / Maint / Mgmt
- −$1,054
- Net cashflow
- $319
Break-even live
Sensitivity live
| Price | -10% $639 | -5% $479 | +0% $319 | +5% $159 | +10% $-1 |
|---|---|---|---|---|---|
| Rent | -10% $-77 | -5% $121 | +0% $319 | +5% $517 | +10% $716 |
| Rate | -1.0pp $604 | -0.5pp $463 | base $319 | +0.5pp $173 | +1.0pp $24 |
3-unit breakdown (identical units grouped — click to expand)
| Units | Beds | Baths | Est. rent |
|---|---|---|---|
| 1× unit | 1 | 1.5 | $1,512 |
| 2× units | 2 | 2 | $3,506 |
| #2 | 2 | 2 | $1,753 |
| #3 | 2 | 2 | $1,753 |
| Total (3 units) | $5,018 | ||
UW: 25.0% down · 7.5% · 30yr · 1.5% tax · 5.0% vac · 8.0% maint · 8.0% mgmt
Financing live
Cash to close
- Down payment
- $141,250
- Closing costs
- $16,950
- Reserves months
- —
- Total cash needed
- —
Loan-product check · same deal, 3 products live
Conventional
25% down · 7.5% · 30yr
- Down + closing
- —
- Monthly P&I
- —
- Monthly cashflow
- —
- DSCR
- —
- Eligible?
- —
Personal DTI + credit; lowest rate.
DSCR
20% down · 8.5% · 30yr
- Down + closing
- —
- Monthly P&I
- —
- Monthly cashflow
- —
- DSCR
- —
- Eligible?
- —
No personal income docs; deal must DSCR.
Hard money
10% down · 12.0% · 12mo
- Down + closing
- —
- Monthly P&I
- —
- Monthly cashflow
- —
- DSCR
- —
- Eligible?
- —
Short-term bridge; refi at stabilization.
Listing history 13 events
-
2026-06-22days on market $565,000 Active 18 DOM
-
2026-06-18days on market $565,000 Active 15 DOM
-
2026-06-17days on market $565,000 Active 14 DOM
-
2026-06-16days on market $565,000 Active 13 DOM
-
2026-06-15days on market $565,000 Active 12 DOM
-
2026-06-14days on market $565,000 Active 10 DOM
-
2026-06-13days on market $565,000 Active 9 DOM
-
2026-06-10days on market $565,000 Active 7 DOM
-
2026-06-09days on market $565,000 Active 6 DOM
-
2026-06-08days on market $565,000 Active 5 DOM
-
2026-06-07days on market $565,000 Active 4 DOM
-
2026-06-05remarks 699-char remark
-
2026-06-05$565,000 Active 1 DOM
ⓘ Source: listings_history table (triggers on properties + properties_extension) + one-shot
backfill from property_details.listing_events for pre-trigger history.
Tax reassessment forecast CT · Partial reset (capped growth)
- Current annual tax
- $5,360 · $447/mo
- Projected year-2 tax
- $8,726 · $727/mo
- Expected delta
- +$3,366/yr (+$280/mo · 62.8%)
ⓘ Screening estimate from a state-policy table — verify with the county assessor before closing.
Climate risk First Street
- Flood 1/10 Low FEMA zone X (unshaded) · 0% chance over 30 yrs
- Wildfire 3/10 Moderate
- Heat 5/10 Major 7 d/yr ≥98°F today · 16 d/yr by 30 yrs out
- Wind 6/10 Major 27% chance of damaging wind over 30 yrs
- Air quality 3/10 Moderate 3 unhealthy d/yr today · 4 by 30 yrs out
Nearby sold comps map
Loading sold comps map…
Walkable amenities ~0.75 mi
Loading nearby amenities…
Taxation est. · year 1
- Rental income
- $60,216
- − Mortgage interest
- −$31,649
- − Property taxes
- −$5,360
- − Insurance
- −$2,825
- − Repairs & maintenance
- −$4,817
- − Management
- −$4,817
- − Depreciation
- −$16,436
- Taxable loss
- −$5,689
- Est. tax savings @ 24.0%
- +$1,365
- After-tax cash flow
- $5,196/yr
For passive investors: Depreciation is non-cash, so a rental often shows a tax loss while cash-flowing — sheltering income. Rental losses are passive: they offset passive income freely, and up to $25,000/yr can offset ordinary (W-2) income if you actively participate and your MAGI is under $100k (phasing out to $0 by $150k); unused losses carry forward. On sale, claimed depreciation is recaptured at up to 25%, and gains may owe capital-gains tax (a 1031 exchange can defer both). Figures are a year-1 estimate at your 24.0% rate — not tax advice; consult a CPA.
Schools (NCES district)
- District
- Oxford School District
- NCES district ID
- 0903240
- Math proficiency
- 42% ▼ -12.00%
- Reading proficiency
- 61% ▼ -7.00%
- Median HH income
- $100,564
- Composite
- 48.79/100
- National rank
- #2091
- State rank
- #67 of 153 in CT
Livability — Oxford
No livability data for this city. (Only ~50 U.S. cities are tracked.)
Census & demographics
- Population (ZIP)
- 12,870
Population outlook (Naugatuck Valley County) Hauer SSP2
- By 2040
- 496,846
Race, ethnicity, and origin ACS 2023
- Neighborhood character
- Predominantly White (77%)
- Race & ethnicity
- White 77% Hispanic / Latino 12% Two or more races 8% Asian 5%
- Hispanic origin (detail)
- Mexican 1% Puerto Rican 5% Salvadoran 3%
- Common ancestry
- Romanian 15% Lithuanian 4% Russian 2%
- Foreign-born
- 11% · Canada, Jamaica, Vietnam
- Languages at home
- 83% English-only · Spanish 8% Other Indo-European 4% Russian/Polish/Slavic 1%
Political lean MEDSL · Naugatuck Valley
- 2024 margin
- Lean R (+7.4) · D 45.6% · R 53.0% · Other 1.4%
- All cycles
- 2024: R+7.4
Not yet ingested
- Civics
- —
Market trends
- HPI YoY
- ▼ -119.12%
- Current HPI
- 219.773
- Rent YoY
- —
- Metro
- —
- State GDP YoY
- ▲ 1.06%
- F500 in state
- 38
Industry mix (Fortune 500 HQ in CT)
| Industry | F500 HQs | Revenue |
|---|---|---|
| Industrial Machinery | 4 | $38B |
|
||
| Insurance | 3 | $71B |
|
||
| Financial Services | 2 | $25B |
|
||
| Transportation / Logistics | 2 | $18B |
|
||
| Healthcare | 1 | $247B |
|
||
| Telecommunications | 1 | $55B |
|
||
Price history
+89.0% since first listed5 events — show timeline
- 2026-06-03 Listed $565,000 Smart MLS
- 2020-10-19 Sold (Public Records) $318,000 Public Records
- 2020-10-14 Sold (MLS) $318,000 Smart MLS
- 2020-09-03 Contingent — Smart MLS
- 2020-08-27 Listed $299,000 Smart MLS
Property tax history
-0.0%/yrLatest (2023): $5,360 · +0.6% YoY. Source: county tax records.
Cash-flow waterfall
monthlySold comps — $/sqft
last 12 mo · ≤1 miLoading sold comps…