 Fourplex
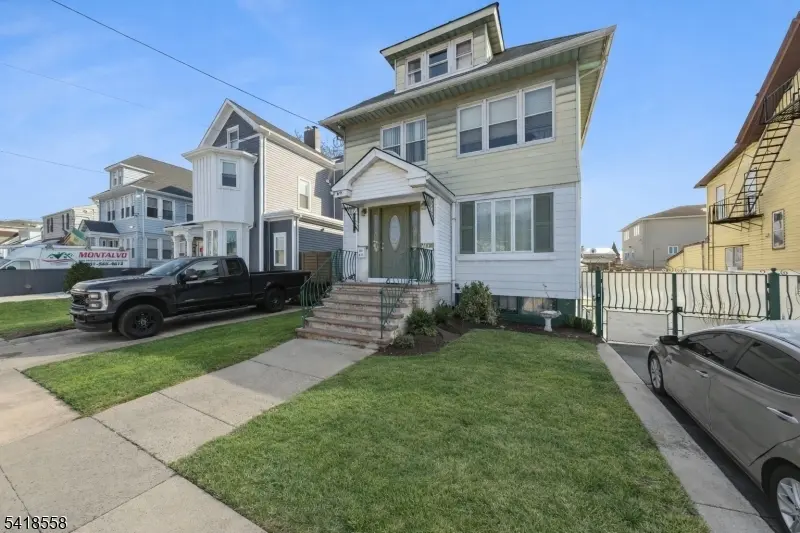
611-613 Jefferson Ave · Elizabeth, NJ
Flood risk 1/10 · Minimal
- FEMA flood zone
- X (unshaded)
- Chance of flooding over 30 yrs
- 0.0%
- Est. flood insurance / yr
- $507 – $1,088
Fire risk 1/10 · Minimal
- Est. fire insurance / yr
- $526 – $976
Heat risk 7/10 · Major
- Hot days now (above 100°F)
- 7 days/yr
- Hot days in 30 yrs
- 15 days/yr
Wind risk 6/10 · Moderate
- Chance of severe wind over 30 yrs
- 27.0%
Air-quality risk 4/10 · Minor
- Unhealthy air days now
- 4 days/yr
- Unhealthy air days in 30 yrs
- 5 days/yr
Risk factors via First Street. Map © Google.
Why this score? — see what drove the C grade
The composite is a weighted blend of 9 inputs, each scored 0–100. Each bar is that input's sub-score; the figure is the points it added to the 100-point composite (weight × sub-score).
- Cash flow +25.1/30.0
- DSCR +8.2/10.0
- ARV discount +7.5/15.0
- 1% rule +6.6/10.0
- Livability +3.5/5.0
- Condition / age +2.8/5.0
- Schools +1.8/10.0
- Rent growth +1.0/5.0
- Appreciation +0.0/10.0
$899,000
🖨 Deal sheet (PDF) 📄 Offer letter ✓ Due diligence
Multi-family units
County records classify this as Multi-Family (2-4 Unit). Listing-text estimate: 4 units. confirmed
Listing remarks
Located in Elizabeth's highly sought-after North End, 611 Jefferson offers a rare combination of location, scale, and upside potential. Just under one mile (. 7 to be exact) from the train station and moments from major highways, this well-positioned multi-family property is ideal for commuters, investors, and owner-occupants alike. Situated within the R-3A zone, which allows for residential properties of up to four units, this property presents an outstanding opportunity for potential conversion to a three & four unit homes, creating significant added value. The home is currently configured as a two-unit residence, with each unit offering an impressive 4-bedroom layout a true rarity
Key facts
- 6,098 sq ft lot
- 2 garage spots
- Built 1926
Property features AI
Finance
- Financial info: 2 total residential units; Gross operating income: $49,200; Net operating income: $34,348; Total operating expenses: $14,852 (includes insurance and taxes); Unit 1 rent: $2,250 (security deposit $2,250); Unit 2 rent: $1,800 (security deposit $1,800); Unit 3 rent: not currently listed
Exterior
- Parking: Total of 5 parking spaces; 2 garage spaces; Detached carport-style garage (one car width driveway)
- Utilities: Public water; Public sewer; Natural gas available; All utilities underground
- Home design: Three-story multi-unit building
- Construction: Asphalt shingle roof; Approximate year built; Has home warranty
- Exterior features: Aluminum siding; Level lot
Interior
- Kitchen: Unit 1: Dishwasher, Microwave, Gas range/oven; Unit 2: Dishwasher, Microwave, Gas range/oven; Unit 3: Eat-in kitchen
- Bedrooms: Unit 1: 4 bedrooms (single level); Unit 2: 4 bedrooms (single level); Unit 3: 2 bedrooms (single level)
- Bathrooms: Four full bathrooms total; Unit 1: 1 bathroom; Unit 2: 1 bathroom; Unit 3: 1 bathroom
- Interior features: Gas water heater; Finished full walkout basement
- Laundry & utility: Tenants pay electric, gas and heat for Units 1–3
Neighborhood map
What this means for you Summary
Snapshot
- This is a 4 × 3-bed/1.0-bath units multifamily listed at $899k. Condition is rated average.
Deal economics
- At list price, monthly cash flow is $2k ($24k/yr) — positive. Per door: $500/mo.
- The deal already cash-flows at list — no discount required.
- Meets the 1% rule at list price ($10k rent vs $899k).
- Recommended offer: $872k (3.0% below list) — sets the bar for market timing.
- Cap rate 9.0% vs local median 2.4% in Elizabeth — top-decile yield for the area; either an underpriced asset or a hidden risk that comps aren't pricing in. Stress-test before assuming the spread holds.
Location & tenants
- Location reads 69/100 on livability (#277 in NJ) — a middle-class / working-renter tenant base. Strengths: commute A+, health & safety B+; Watch: amenities D+, schools D-, crime D-.
- Elizabeth Public Schools (suburban): math 9% / reading 33% proficiency, ranked #430 of 472 in NJ (top 91%) — low school quality limits family demand, transient renter base, plan for 1-2y turnover; 74% free/reduced lunch — lower-income household profile, screen leases tightly.
- Market conditions: Rents falling (-6.0%/yr); 10 active listings in the ZIP; 1,749 units permitted in Union County in 2024 (1,421 in 5+ unit buildings).
- At $10,395/mo this rent would consume 208% of the median local household income ($60k/yr) (locally 2200% of renters already pay >50% of income on rent) — very limited rent-growth headroom before tenants either downsize or default.
Forward outlook
- Local home prices are declining (-3.0%/yr); year-one equity from $6k of loan paydown is wiped out by about $27k of value loss. Plan a longer hold.
- Union County population projected at +17% by 2050 — long-run rental-demand tailwind backs the buy-and-hold thesis.
Negotiation context
- It's been on market 45 days — a 3% lower offer ($872k) is reasonable based on typical stale-listing flexibility.
Risks & watch-outs
- Watch-outs: built in 1926 — expect roof / HVAC / electrical / plumbing capex.
- Climate carrying-cost: major wind risk, 27% chance of damaging wind over 30y; extreme-heat days projected 7→15/yr by 2055 (HVAC capex compounding) — expect insurance premiums to compound above CPI over the hold.
Questions for the listing agent
- It's been on market 45 days. Have you received any prior offers? Is the seller open to a 3% concession, seller financing, or rate buy-down credit?
- Can we see the unit-by-unit rent roll, current vacancy, and any below-market leases? What's the average tenancy length?
- What capital expenditures (roof, boiler, parking lot, exteriors) have been made in the last 5 years, and what's planned in the next 2?
- Built in 1926 — when were the roof, HVAC, electrical panel, plumbing, and water heater last replaced?
- Is there a deadline driving the sale (1031 exchange, divorce, estate, relocation)? That informs how much negotiation room exists.
- Schools are D-rated, which usually means shorter tenancies and higher turnover. Who's the typical renter profile here, and what's been the actual vacancy rate?
- Crime grade is D in this area — have there been break-ins, vandalism, or insurance claims at this property in the last 3 years? What carrier currently insures it and at what premium?
- What's the average days-on-market for RENTAL listings here right now (not sales)? A rising rental-DOM trend means longer vacancies and softer asking-rent achievability than the comps imply.
- What's the recent tenant-quality profile in this submarket — average credit score on applications, eviction rate, late-payment / NSF rate, and stable-employment percentage? A property-management company in the area should have these aggregated.
- How much new apartment / multifamily construction is in the pipeline within 1–3 miles? Heavy new supply (>2% of stock underway) typically softens rents 12–24 months out; light construction supports rent growth.
Investment metrics
- 1% rule
- 1.16% ✓
- Cap rate
- 8.96%
- Cash-on-cash
- 9.53%
- DSCR
- 1.42
- GRM
- 7.2
CMA / ARV
No comps found within radius.
Projected returns pro-forma
-3.0% appreciation · 0.0% rent growth · sell at horizon
- IRR
- -5.4%
- Equity multiple
- 0.81×
- Total profit
- $-48,649
- Equity at exit
- $134,044
- IRR
- 0.3%
- Equity multiple
- 1.02×
- Total profit
- $4,507
- Equity at exit
- $77,729
Cash invested: $251,720 (down + closing). Projections, not guarantees.
Landlord ↔ Tenant lean methodology
- Overall (STATE)
- 21 Tenant-Leaning
- State New Jersey
- 21 Tenant-Leaning · D+6
- County
- — inherits STATE
- City
- — inherits STATE
ZIP-level market 07201
- Home prices YoY
- -27.9%
- Rents YoY
- -6.0%
- Active inventory
- 10
- Price-to-rent
- 28.8×
Monthly cashflow live
- Estimated rent
- $10,395 high interval (Pro) →
- Mortgage (P&I)
- −$4,714
- Tax est. 1.5%
- −$1,124 /mo · $13,485/yr
- Insurance
- −$375
- HOA
- −$0
- Vacancy / Maint / Mgmt
- −$2,183
- Net cashflow
- $1,999
Break-even live
Sensitivity live
| Price | -10% $2,621 | -5% $2,310 | +0% $1,999 | +5% $1,689 | +10% $1,378 |
|---|---|---|---|---|---|
| Rent | -10% $1,178 | -5% $1,589 | +0% $1,999 | +5% $2,410 | +10% $2,820 |
| Rate | -1.0pp $2,452 | -0.5pp $2,228 | base $1,999 | +0.5pp $1,766 | +1.0pp $1,529 |
4-unit breakdown (identical units grouped — click to expand)
| Units | Beds | Baths | Est. rent |
|---|---|---|---|
| 4× units | 3 | 1 | $10,396 |
| #1 | 3 | 1 | $2,599 |
| #2 | 3 | 1 | $2,599 |
| #3 | 3 | 1 | $2,599 |
| #4 | 3 | 1 | $2,599 |
| Total (4 units) | $10,395 | ||
UW: 25.0% down · 7.5% · 30yr · 1.5% tax · 5.0% vac · 8.0% maint · 8.0% mgmt
Financing live
Cash to close
- Down payment
- $224,750
- Closing costs
- $26,970
- Reserves months
- —
- Total cash needed
- —
Loan-product check · same deal, 3 products live
Conventional
25% down · 7.5% · 30yr
- Down + closing
- —
- Monthly P&I
- —
- Monthly cashflow
- —
- DSCR
- —
- Eligible?
- —
Personal DTI + credit; lowest rate.
DSCR
20% down · 8.5% · 30yr
- Down + closing
- —
- Monthly P&I
- —
- Monthly cashflow
- —
- DSCR
- —
- Eligible?
- —
No personal income docs; deal must DSCR.
Hard money
10% down · 12.0% · 12mo
- Down + closing
- —
- Monthly P&I
- —
- Monthly cashflow
- —
- DSCR
- —
- Eligible?
- —
Short-term bridge; refi at stabilization.
Listing history 3 events
-
2026-05-06status Under Contract
-
2026-03-22$899,000 Active
-
2026-03-20historical $899,000
ⓘ Source: listings_history table (triggers on properties + properties_extension) + one-shot
backfill from property_details.listing_events for pre-trigger history.
Climate risk First Street
- Flood 1/10 Low FEMA zone X (unshaded) · 0% chance over 30 yrs
- Wildfire 1/10 Low
- Heat 7/10 Severe 7 d/yr ≥100°F today · 15 d/yr by 30 yrs out
- Wind 6/10 Major 27% chance of damaging wind over 30 yrs
- Air quality 4/10 Moderate 4 unhealthy d/yr today · 5 by 30 yrs out
Nearby sold comps map
Loading sold comps map…
Walkable amenities ~0.75 mi
Loading nearby amenities…
Taxation est. · year 1
- Rental income
- $124,740
- − Mortgage interest
- −$50,358
- − Property taxes
- −$13,485
- − Insurance
- −$4,495
- − Repairs & maintenance
- −$9,979
- − Management
- −$9,979
- − Depreciation
- −$26,153
- Taxable income
- $10,291
- Est. tax owed @ 24.0%
- −$2,470
- After-tax cash flow
- $21,521/yr
For passive investors: Depreciation is non-cash, so a rental often shows a tax loss while cash-flowing — sheltering income. Rental losses are passive: they offset passive income freely, and up to $25,000/yr can offset ordinary (W-2) income if you actively participate and your MAGI is under $100k (phasing out to $0 by $150k); unused losses carry forward. On sale, claimed depreciation is recaptured at up to 25%, and gains may owe capital-gains tax (a 1031 exchange can defer both). Figures are a year-1 estimate at your 24.0% rate — not tax advice; consult a CPA.
Condition & rehab AI · 13 photos
This multi-family property in Elizabeth's North End requires moderate renovations, including painting, updating cabinets, and HVAC system replacement, to enhance its resale and rental value.
Repairs flagged
- Minor Kitchen cabinets — Dated appearance suggests they could be replaced or updated.
- Minor Paint touch-ups — Faded paint in some areas indicates touch-ups are needed.
- Minor Floor refinishing — Worn hardwood floors suggest refinishing or replacement.
Value-add opportunities
- Resale Painting and updating kitchen cabinets — Fresh paint and updated cabinets can significantly enhance curb appeal and interior aesthetics.
- Rental HVAC system replacement — A reliable HVAC system is crucial for tenant satisfaction and can increase rental value.
- Both Landscaping improvements — A well-maintained yard can improve both resale and rental value.
Renovation cost estimate screening
| Repair item | Severity | Est. cost |
|---|---|---|
| Kitchen cabinets · Dated appearance suggests they could be replaced or updated. | Minor | $500–3,000 |
| Paint touch-ups · Faded paint in some areas indicates touch-ups are needed. | Minor | $500–3,000 |
| Floor refinishing · Worn hardwood floors suggest refinishing or replacement. | Minor | $500–3,000 |
| Total estimated repair cost · 3 items | $1,500–9,000 |
Value-add ROI direction
- Resale Painting and updating kitchen cabinets — Fresh paint and updated cabinets can significantly enhance curb appeal and interior aesthetics. ↑
- Rental HVAC system replacement — A reliable HVAC system is crucial for tenant satisfaction and can increase rental value. ↑
- Both Landscaping improvements — A well-maintained yard can improve both resale and rental value. ↑
ⓘ Cost ranges are severity-bucket heuristics (US national rule-of-thumb). Get contractor quotes + a written scope before underwriting a rehab budget.
Schools (NCES district)
- District
- Elizabeth Public Schools
- NCES district ID
- 3404590
- Math proficiency
- 9% ▼ -17.00%
- Reading proficiency
- 33% ▼ -19.00%
- Median HH income
- $43,785
- Composite
- 18.05/100
- National rank
- #8979
- State rank
- #430 of 472 in NJ
Livability — Elizabeth
- Score
- 69/100
- State rank
- #277
- US rank
- #8270
Category grades
Schools grade is shown separately in the Schools card above.
Census & demographics
- Census place
- Elizabeth, NJ
- County
- Union County · 492,165 people
- City population
- 105,365
- Metro
- New York-Newark-Jersey City, NY-NJ-PA
- Population (ZIP)
- 28,467
- Household income
- $60,080
- Rent vs Own
- Severe rent burden
- 2200.0
Population outlook (Union County) Hauer SSP2
- Today (2025)
- 596,450 people
- By 2030
- 616,880 · +3.4%
- By 2040
- 658,185 · +10.4%
- By 2050
- 696,707 · +16.8%
- By 2075
- 785,448 · +31.7%
- By 2100
- 836,583 · +40.3%
Race, ethnicity, and origin ACS 2023
- Neighborhood character
- Majority Hispanic (65%)
- Race & ethnicity
- Hispanic / Latino 65% Two or more races 20% Black 17% White 12% Native American 2% Asian 1%
- Hispanic origin (detail)
- Mexican 1% Puerto Rican 9% Cuban 4% Dominican 13%
- Common ancestry
- Russian 5% Estonian 5% Hispanic 4%
- Foreign-born
- 52% · Canada, Jamaica, Dominican Republic
- Languages at home
- 24% English-only · Spanish 58% Other Indo-European 10% French/Haitian/Cajun 5%
Political lean MEDSL · Union
- 2024 margin
- Strong D (+24.2) · D 61.2% · R 37.0% · Other 1.8%
- 2008→2024 swing
- -4.0pp toward R · 2008: 28.2pp · 2024: 24.2pp
- All cycles
- 2024: D+24.2 2020: D+35.5 2016: D+35.5 2012: D+33.5 2008: D+28.2
Not yet ingested
- Civics
- —
Market trends
- HPI YoY
- ▼ -148.13%
- Current HPI
- 383.187
- Rent YoY
- ▼ -5.98%
- Metro
- New York-Newark-Jersey City, NY-NJ-PA
- State GDP YoY
- ▲ 2.05%
- F500 in state
- 34
Industry mix (Fortune 500 HQ in NJ)
| Industry | F500 HQs | Revenue |
|---|---|---|
| Consumer Goods | 3 | $31B |
|
||
| Pharmaceuticals | 2 | $153B |
|
||
| Technology | 2 | $21B |
|
||
| Insurance | 2 | $20B |
|
||
| Healthcare | 2 | $19B |
|
||
| Financial Services | 1 | $70B |
|
||
Price history
+0.0% since first listed3 events — show timeline
- 2026-05-06 Pending — GSMLS
- 2026-03-22 Listed $899,000 GSMLS
- 2026-03-20 Coming Soon $899,000 GSMLS
Cash-flow waterfall
monthlySold comps — $/sqft
last 12 mo · ≤1 miLoading sold comps…