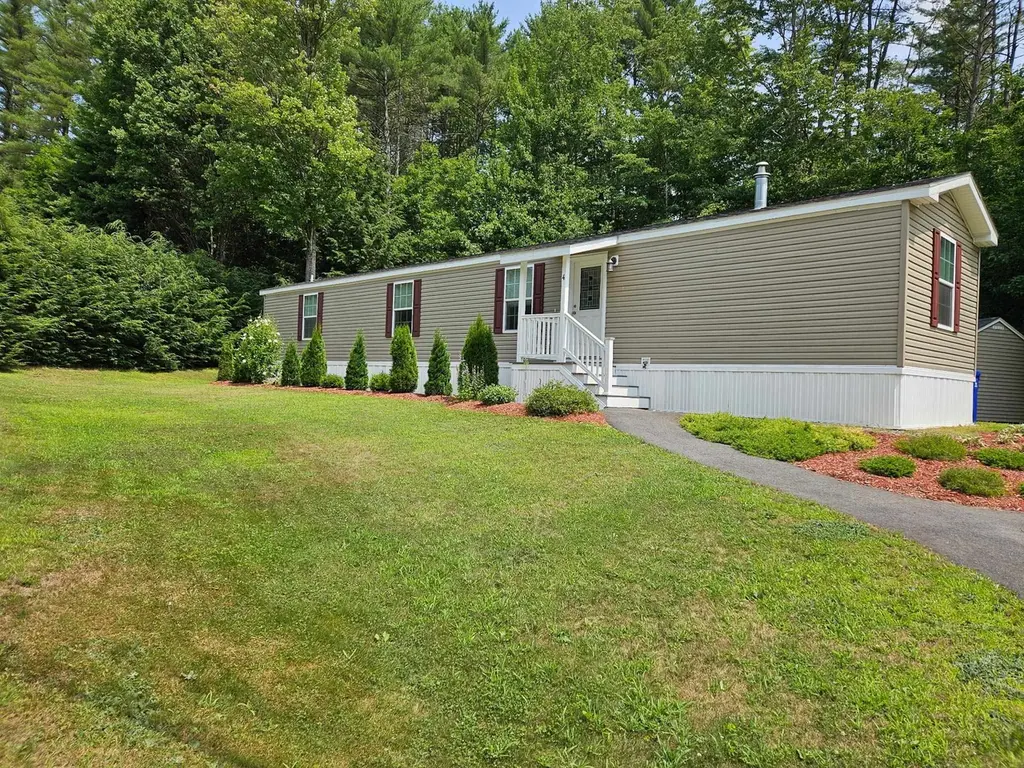
4 Hemlock Rd · Tilton Northfield, NH
Flood risk No data
- FEMA flood zone
- —
- Chance of flooding over 30 yrs
- —
- Est. flood insurance / yr
- —
Fire risk No data
- Est. fire insurance / yr
- —
Heat risk No data
- Hot days now (above threshold)
- —
- Hot days in 30 yrs
- —
Wind risk No data
- Chance of severe wind over 30 yrs
- —
Air-quality risk No data
- Unhealthy air days now
- —
- Unhealthy air days in 30 yrs
- —
Risk factors via First Street. Map © Google.
Why this score? — see what drove the D- grade
The composite is a weighted blend of 9 inputs, each scored 0–100. Each bar is that input's sub-score; the figure is the points it added to the 100-point composite (weight × sub-score).
- Cash flow +7.4/30.0
- 1% rule +5.9/10.0
- ARV discount +4.5/15.0
- Appreciation +4.1/10.0
- Livability +4.0/5.0
- Schools +3.4/10.0
- Rent growth +2.5/5.0
- Condition / age +2.5/5.0
- DSCR +1.6/10.0
$169,900
🖨 Deal sheet 📄 Offer letter ✓ Due diligence
Listing remarks MLS
RELOCATION brings this property to the market. Well maintained home sits on double lot. MANY updates windows, roof, skirting, to mention a few. Pet and child friendly park. Agent related to the Sellers. MOTIVATED. .
Key facts
- Easy access
- Private bath
- Rear deck
Tags
Property features AI
Finance
- HOA & community: Monthly park/HOA fee of 558 (includes trash and park rent)
Exterior
- Parking: Paved driveway
- Utilities: Public water; Public sewer; Circuit breaker electrical; Cable internet available
- Home design: Manufactured/Mobile home; Tan exterior
- Construction: Built in 2021; Vinyl siding; Asphalt shingle roof; Commodore make (mobile); Mobile serial number 59849A; Located in Hemlocks mobile park (park approved)
- Exterior features: Landscaped; Wooded; Leased lot (mobile located in a park)
Interior
- Kitchen: Dishwasher; Refrigerator; Electric stove
- Bedrooms: Bedroom (main level); Bedroom with bath (main level)
- Flooring: Carpet; Vinyl plank
- Bathrooms: 2 full bathrooms
- Heating & cooling: Forced air heat; Central air conditioning
- Interior features: 5 total rooms; Eat-in kitchen; Laundry room; Bedroom with bath; Living room (two listed)
- Laundry & utility: Laundry room (main level)
Neighborhood map
What this means for you Summary
Snapshot
- This is a 2-bed/2.0-bath manufactured listed at $170k.
Deal economics
- At list price, monthly cash flow is $-216 ($-3k/yr) — negative.
- To cash-flow at today's rent, offer at most $132k (22.5% below list).
- Meets the 1% rule at list price ($2k rent vs $170k).
- Recommended offer: $132k (22.5% below list) — sets the bar for cash-flow.
- Cap rate 4.8% vs local median 3.4% in Tilton Northfield — top-decile yield for the area; either an underpriced asset or a hidden risk that comps aren't pricing in. Stress-test before assuming the spread holds.
Location & tenants
- Location reads 79/100 on livability (#18 in NH, #2,102 nationally) — a middle-class / working-renter tenant base. Strengths: crime A+, cost of living A+, health & safety A+; Watch: amenities F, commute F.
- Winnisquam Regional School District (town): math 32% / reading 46% proficiency, ranked #64 of 98 in NH (top 65%) — families likely to look elsewhere, expect single-tenant / working-renter base with shorter leases.
- Market conditions: 41 active listings in the ZIP; 8 comparable units currently listed for rent nearby; rentals at typical pace (median 25d on market — plan ~3-4 weeks tenant-placement turnaround); 301 units permitted in Belknap County in 2024 (32 in 5+ unit buildings).
Forward outlook
- Local home prices are declining (-1.9%/yr); year-one equity from $1k of loan paydown is wiped out by about $3k of value loss. Plan a longer hold.
- Belknap County population projected at -10% by 2050 — secular population decline; favor cash flow + early exit over multi-decade hold.
Negotiation context
- It's been on market 17 days — a 2% lower offer ($167k) is reasonable based on typical stale-listing flexibility.
- 2 sale attempts since 18y ago with the ask held roughly flat each time — persistent listings suggest the price (not the market) is what's stuck; bring a comps-based counter.
Risks & watch-outs
- Watch-outs: HOA is 30% of rent.
Questions for the listing agent
- What do current leases actually rent for vs. the listed asking? Can we see a recent rent roll and the last 12 months of T-12 income?
- What does the HOA fee cover, when was the last increase, and are there any pending special assessments or reserve-fund shortfalls?
- Is there a deadline driving the sale (1031 exchange, divorce, estate, relocation)? That informs how much negotiation room exists.
- The area grade is low — what's the realistic commute time and amenity access for the typical tenant pool here? Any planned neighborhood developments (good or bad) we should know about?
- What's the average days-on-market for RENTAL listings here right now (not sales)? A rising rental-DOM trend means longer vacancies and softer asking-rent achievability than the comps imply.
- What's the recent tenant-quality profile in this submarket — average credit score on applications, eviction rate, late-payment / NSF rate, and stable-employment percentage? A property-management company in the area should have these aggregated.
- How much new for-sale + rental construction is in the pipeline within 1–3 miles? Heavy new supply typically softens prices + rents 12–24 months out; constrained supply supports both.
Investment metrics
- 1% rule
- 1.09% ✓
- Cap rate
- 4.77%
- Cash-on-cash
- -5.45%
- DSCR
- 0.76
- GRM
- 7.7
CMA / ARV
- ARV (on-the-fly)
- $159,367
- Comps found
- 5
Show comp detail 5 sales within ~0.75 mi
| Address | Dist | Beds/Ba | Sqft | Sold | Price | $/sf | Match |
|---|---|---|---|---|---|---|---|
| 2 Hemlock Rd | 0.03mi | 2/1.5 | 960 (+2%) | 8mo | $162,000 | $169 | 86 |
| 12 Foothills Way | 0.03mi | 2/1.5 | 1,026 (+9%) | 6mo | $155,000 | $151 | 77 |
| 1 Northbrook Rd | 0.09mi | 2/1.0 | 892 (-5%) | 10mo | $155,000 | $174 | 74 |
| 1 Foothills Way | 0.05mi | 2/1.5 | 1,036 (+10%) | 10mo | $115,000 | $111 | 71 |
| 64 Kendall St | 0.71mi | 3/1.0 (+1) | 960 (+2%) | 18mo | $237,000 | $247 | 40 |
Match score weights: distance 35% · size 25% · config 20% · recency 20%. Top-matched comps best support the ARV.
Projected returns pro-forma
-1.88% appreciation · 3.0% rent growth · sell at horizon
- IRR
- -17.6%
- Equity multiple
- 0.31×
- Total profit
- $-32,875
- Equity at exit
- $33,940
- IRR
- -10.4%
- Equity multiple
- 0.21×
- Total profit
- $-37,739
- Equity at exit
- $29,908
Cash invested: $47,572 (down + closing). Projections, not guarantees.
Landlord ↔ Tenant lean methodology
- Overall (STATE)
- 56 Moderately Landlord-Leaning
- State New Hampshire
- 56 Moderately Landlord-Leaning · D+1
- County
- — inherits STATE
- City
- — inherits STATE
ZIP-level market 03276
- Home prices YoY
- -0.4%
- Active inventory
- 41
- Price-to-rent
- 7.7×
Monthly cashflow live
- Estimated rent
- $1,843 high interval (Pro) →
- Mortgage (P&I)
- −$891
- Tax from tax record
- −$153 /mo · $1,833/yr
- Insurance
- −$71
- HOA
- −$558
- Vacancy / Maint / Mgmt
- −$387
- Net cashflow
- $-216
Break-even live
UW: 25.0% down · 7.5% · 30yr · 1.5% tax · 5.0% vac · 8.0% maint · 8.0% mgmt
Financing live
Cash to close
- Down payment
- $42,475
- Closing costs
- $5,097
- Reserves months
- —
- Total cash needed
- —
Loan-product check · same deal, 3 products live
Conventional
25% down · 7.5% · 30yr
- Down + closing
- —
- Monthly P&I
- —
- Monthly cashflow
- —
- DSCR
- —
- Eligible?
- —
Personal DTI + credit; lowest rate.
DSCR
20% down · 8.5% · 30yr
- Down + closing
- —
- Monthly P&I
- —
- Monthly cashflow
- —
- DSCR
- —
- Eligible?
- —
No personal income docs; deal must DSCR.
Hard money
10% down · 12.0% · 12mo
- Down + closing
- —
- Monthly P&I
- —
- Monthly cashflow
- —
- DSCR
- —
- Eligible?
- —
Short-term bridge; refi at stabilization.
Rent comps 8 comps
| Address | Beds | Baths | Sqft | Rent | $/sqft | DOM | Units | Dist |
|---|---|---|---|---|---|---|---|---|
| 672 Central St Unit A Franklin, NH | 3.0 | 1.0 | 1100 | $1,950 | $1.77 | 43d | 1 | 0.83mi |
| 76 Terrace Rd Franklin, NH | 2.0 | 1.0 | 750 | $1,675 | $2.23 | 5d | 1 | 0.85mi |
| 6 Terrace Rd Unit 6A Franklin, NH | 1.0 | 1.0 | 640 | $1,600 | $2.50 | 17d | 1 | 0.97mi |
| 20 Canal St Franklin, NH | 2.0 | 1.0 | 758 | $2,995 | $3.95 | 4d | 5 | 1.29mi |
| 42 Franklin St Unit F Franklin, NH | 1.0 | 1.0 | 600 | $1,400 | $2.33 | 24d | 1 | 1.33mi |
| 96 Franklin St Franklin, NH | 2.0 | 1.0 | 550 | $1,695 | $3.08 | 43d | 1 | 1.38mi |
| 97 Franklin St Unit C Franklin, NH | 2.0 | 1.0 | 949 | $1,500 | $1.58 | 24d | 1 | 1.41mi |
| 115 Franklin St Unit 6 Flanders Franklin, NH | 3.0 | 1.0 | 1012 | $1,875 | $1.85 | 5d | 1 | 1.43mi |
HOA detail
- Monthly dues
- $558 · $6,696/yr
Listing history 12 events
-
2026-06-19days on market $169,900 Active 17 DOM
-
2026-06-18days on market $169,900 Active 16 DOM
-
2026-06-17days on market $169,900 Active 15 DOM
-
2026-06-16days on market $169,900 Active 14 DOM
-
2026-06-15days on market $169,900 Active 13 DOM
-
2026-06-14days on market $169,900 Active 11 DOM
-
2026-06-12days on market $169,900 Active 10 DOM
-
2026-06-09days on market $169,900 Active 7 DOM
-
2026-06-08days on market $169,900 Active 6 DOM
-
2026-06-07days on market $169,900 Active 5 DOM
-
2026-06-03remarks 699-char remark
-
2026-06-03$169,900 Active 1 DOM
ⓘ Source: listings_history table (triggers on properties + properties_extension) + one-shot
backfill from property_details.listing_events for pre-trigger history.
Tax reassessment forecast NH · Partial reset (capped growth)
- Current annual tax
- $1,833 · $153/mo
- Projected year-2 tax
- $2,768 · $231/mo
- Expected delta
- +$935/yr (+$78/mo · 51.0%)
ⓘ Screening estimate from a state-policy table — verify with the county assessor before closing.
Nearby sold comps map
Loading sold comps map…
Walkable amenities ~0.75 mi
Loading nearby amenities…
Taxation est. · year 1
- Rental income
- $22,122
- − Mortgage interest
- −$9,517
- − Property taxes
- −$1,833
- − Insurance
- −$850
- − Repairs & maintenance
- −$1,770
- − Management
- −$1,770
- − HOA
- −$6,696
- − Depreciation
- −$4,943
- Taxable loss
- −$5,256
- Est. tax savings @ 24.0%
- +$1,261
- After-tax cash flow
- $-1,333/yr
For passive investors: Depreciation is non-cash, so a rental often shows a tax loss while cash-flowing — sheltering income. Rental losses are passive: they offset passive income freely, and up to $25,000/yr can offset ordinary (W-2) income if you actively participate and your MAGI is under $100k (phasing out to $0 by $150k); unused losses carry forward. On sale, claimed depreciation is recaptured at up to 25%, and gains may owe capital-gains tax (a 1031 exchange can defer both). Figures are a year-1 estimate at your 24.0% rate — not tax advice; consult a CPA.
Schools (NCES district)
- District
- Winnisquam Regional School District
- NCES district ID
- 3307300
- Math proficiency
- 32% ▼ -9.00%
- Reading proficiency
- 46% ▼ -6.00%
- Median HH income
- $58,761
- Composite
- 34.45/100
- National rank
- #5194
- State rank
- #64 of 98 in NH
Livability — Tilton Northfield
- Score
- 79/100
- State rank
- #18
- US rank
- #2102
Category grades
Schools grade is shown separately in the Schools card above.
Census & demographics
- Population (ZIP)
- 9,046
Population outlook (Belknap County) Hauer SSP2
- Today (2025)
- 60,702 people
- By 2030
- 60,353 · -0.6%
- By 2040
- 58,264 · -4.0%
- By 2050
- 54,533 · -10.2%
- By 2075
- 45,622 · -24.8%
- By 2100
- 33,772 · -44.4%
Race, ethnicity, and origin ACS 2023
- Neighborhood character
- Predominantly White (93%)
- Race & ethnicity
- White 93% Two or more races 4% Hispanic / Latino 2%
- Common ancestry
- Lithuanian 14% Slovak 2% Romanian 2%
- Foreign-born
- 3% · Canada
- Languages at home
- 96% English-only · Spanish 2% Other Indo-European 1% Russian/Polish/Slavic 1%
Political lean MEDSL · Belknap
- 2024 margin
- R (+13.1) · D 43.1% · R 56.1%
- 2008→2024 swing
- -14.2pp toward R · 2008: 1.2pp · 2024: -13.1pp
- All cycles
- 2024: R+13.1 2020: R+10.4 2016: R+16.8 2012: R+5.0 2008: D+1.2
Not yet ingested
- Civics
- —
Market trends
- HPI YoY
- ▼ -1.88%
- Current HPI
- 436.242
- Rent YoY
- —
- Metro
- —
- State GDP YoY
- —
- F500 in state
- 0
Price history
+753.8% since first listed4 events — show timeline
- 2026-06-01 Listed $169,900 PrimeMLS
- 2020-06-23 Sold (Public Records) $240,000 Public Records
- 2008-12-15 Sold (MLS) $18,500 PrimeMLS
- 2008-05-08 Listed $19,900 PrimeMLS
Property tax history
+15.9%/yrLatest (2025): $1,833 · +5.1% YoY. Source: county tax records.
Cash-flow waterfall
monthlySold comps — $/sqft
last 12 mo · ≤1 miLoading sold comps…