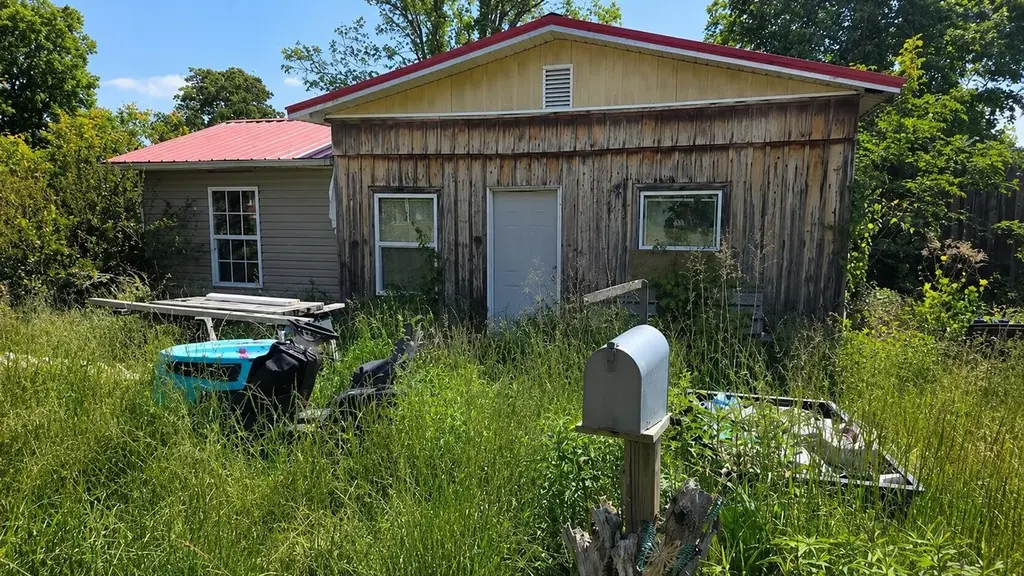
2105 Deer Lodge Hwy · Sunbright, TN
Flood risk 1/10 · Minimal
- FEMA flood zone
- X (unshaded)
- Chance of flooding over 30 yrs
- 0.0%
- Est. flood insurance / yr
- $473 – $860
Fire risk 5/10 · Moderate
- Est. fire insurance / yr
- $949 – $1,763
Heat risk 4/10 · Minor
- Hot days now (above 99°F)
- 7 days/yr
- Hot days in 30 yrs
- 20 days/yr
Wind risk 3/10 · Minor
- Chance of severe wind over 30 yrs
- 6.0%
Air-quality risk 2/10 · Minimal
- Unhealthy air days now
- 1 days/yr
- Unhealthy air days in 30 yrs
- 2 days/yr
Risk factors via First Street. Map © Google.
Why this score? — see what drove the B grade
The composite is a weighted blend of 9 inputs, each scored 0–100. Each bar is that input's sub-score; the figure is the points it added to the 100-point composite (weight × sub-score).
- Cash flow +30.0/30.0
- 1% rule +10.0/10.0
- DSCR +10.0/10.0
- Appreciation +7.6/10.0
- ARV discount +7.5/15.0
- Rent growth +2.5/5.0
- Condition / age +2.5/5.0
- Livability +2.4/5.0
- Schools +1.3/10.0
$59,900
🖨 Deal sheet 📄 Offer letter ✓ Due diligence
Listing remarks
2-bedroom, 1-bath investment opportunity with potential for a possible 3rd bedroom conversion. Property is being sold as-is and will require repairs and updates, making it a great value-add opportunity for investors or buyers looking to customize. Conveniently located with strong potential for future improvement and added value. ADDITIONAL LOT WITH OVER 1 ACRE INCLUDED WITH THE SALE THAT SURROUNDS THE HOUSE!!! APN 052H C 01100
Key facts
- 5,662 sq ft lot
- Built 1962
- Listed 17 days
Property features AI
Finance
- Other: Pets not allowed
- Financial info: Tax amount reported (annual): $308
Exterior
- Parking: No covered parking; No designated parking spaces
- Utilities: Public water; Public sewer; Water available
- Home design: Single family residence; Residential property; One level
- Construction: Built as a model home; Other construction materials; Other foundation details
- Exterior features: Barn(s); Lot about 0.13 acres
Interior
- Kitchen: Gas Range
- Bedrooms: 12 bedrooms (all on the main level)
- Flooring: Wood flooring; Other flooring
- Bathrooms: 1 full bathroom
- Heating & cooling: Radiant heating; Has cooling (type: Other)
- Interior features: Unfinished basement; Gas Range
- Laundry & utility: Water available
Neighborhood map
What this means for you Summary
Snapshot
- This is a 2-bed/1.0-bath single-family listed at $60k.
Deal economics
- At list price, monthly cash flow is $416 ($5k/yr) — positive.
- The deal already cash-flows at list — no discount required.
- Meets the 1% rule at list price ($989 rent vs $60k).
- Recommended offer: $59k (1.5% below list) — sets the bar for market timing.
- Cap rate 14.6% vs local median 2.5% in Sunbright — top-decile yield for the area; either an underpriced asset or a hidden risk that comps aren't pricing in. Stress-test before assuming the spread holds.
Location & tenants
- Location reads 48/100 on livability (#419 in TN) — a working-class tenant base; expect higher turnover. Strengths: cost of living A+, housing A; Watch: crime F, amenities F, commute F.
- Morgan County (rural): math 14% / reading 18% proficiency, ranked #128 of 139 in TN (top 92%) — low school quality limits family demand, transient renter base, plan for 1-2y turnover.
- Zoned schools: Central Elementary (math 24% / reading 20%, grade F, #601 of 952 statewide, top 66%, 553 students, 0% FRL); Central High School (math 2% / reading 17%, grade F, #279 of 332 statewide, top 86%, 376 students, 0% FRL) — zoned schools average 0% FRL vs 53% district-wide (53 pts lower); this property's tenant base skews higher-income than the district average.
- Market conditions: 40 active listings in the ZIP.
Forward outlook
- In year one you build about $4k of equity ($414 loan paydown + $3k appreciation (5.2% local appreciation)).
- Morgan County population projected at -15% by 2050 — secular population decline; favor cash flow + early exit over multi-decade hold.
- At projected returns (5.2% appreciation + 3.0% rent growth), your $17k cash investment doubles in ~2 years — after that, you're playing with house money.
- By year 9, paydown + projected appreciation supports a ~$31k cash-out refi (75% LTV) — recoverable capital for the next deal without selling this one.
Negotiation context
- It's been on market 17 days — a 2% lower offer ($59k) is reasonable based on typical stale-listing flexibility.
- Current owner paid $10k; list at $60k implies a 508% gain — meaningful room to come down on a strong offer.
Risks & watch-outs
- Climate carrying-cost: moderate wildfire risk — expect insurance premiums to compound above CPI over the hold.
Questions for the listing agent
- Built in 1962 — when were the roof, HVAC, electrical panel, plumbing, and water heater last replaced?
- Is there a deadline driving the sale (1031 exchange, divorce, estate, relocation)? That informs how much negotiation room exists.
- Schools are F-rated, which usually means shorter tenancies and higher turnover. Who's the typical renter profile here, and what's been the actual vacancy rate?
- Crime grade is F in this area — have there been break-ins, vandalism, or insurance claims at this property in the last 3 years? What carrier currently insures it and at what premium?
- What's the average days-on-market for RENTAL listings here right now (not sales)? A rising rental-DOM trend means longer vacancies and softer asking-rent achievability than the comps imply.
- What's the recent tenant-quality profile in this submarket — average credit score on applications, eviction rate, late-payment / NSF rate, and stable-employment percentage? A property-management company in the area should have these aggregated.
- How much new for-sale + rental construction is in the pipeline within 1–3 miles? Heavy new supply typically softens prices + rents 12–24 months out; constrained supply supports both.
Investment metrics
- 1% rule
- 1.65% ✓
- Cap rate
- 14.63%
- Cash-on-cash
- 29.79%
- DSCR
- 2.33
- GRM
- 5.0
CMA / ARV
No comps found within radius.
Projected returns pro-forma
5.19% appreciation · 3.0% rent growth · sell at horizon
- IRR
- 39.3%
- Equity multiple
- 3.44×
- Total profit
- $40,966
- Equity at exit
- $34,641
- IRR
- 37.2%
- Equity multiple
- 7.00×
- Total profit
- $100,595
- Equity at exit
- $60,370
Cash invested: $16,772 (down + closing). Projections, not guarantees.
Landlord ↔ Tenant lean methodology
- Overall (STATE)
- 87 Strongly Landlord-Friendly
- State Tennessee
- 87 Strongly Landlord-Friendly · R+13
- County
- — inherits STATE
- City
- — inherits STATE
ZIP-level market 37726
- Home prices YoY
- 1.6%
- Active inventory
- 40
- Price-to-rent
- 5.0×
Monthly cashflow live
- Estimated rent
- $989 medium interval (Pro) →
- Mortgage (P&I)
- −$314
- Tax from tax record
- −$26 /mo · $308/yr
- Insurance
- −$25
- HOA
- −$0
- Vacancy / Maint / Mgmt
- −$208
- Net cashflow
- $416
Break-even live
UW: 25.0% down · 7.5% · 30yr · 1.5% tax · 5.0% vac · 8.0% maint · 8.0% mgmt
Financing live
Cash to close
- Down payment
- $14,975
- Closing costs
- $1,797
- Reserves months
- —
- Total cash needed
- —
Loan-product check · same deal, 3 products live
Conventional
25% down · 7.5% · 30yr
- Down + closing
- —
- Monthly P&I
- —
- Monthly cashflow
- —
- DSCR
- —
- Eligible?
- —
Personal DTI + credit; lowest rate.
DSCR
20% down · 8.5% · 30yr
- Down + closing
- —
- Monthly P&I
- —
- Monthly cashflow
- —
- DSCR
- —
- Eligible?
- —
No personal income docs; deal must DSCR.
Hard money
10% down · 12.0% · 12mo
- Down + closing
- —
- Monthly P&I
- —
- Monthly cashflow
- —
- DSCR
- —
- Eligible?
- —
Short-term bridge; refi at stabilization.
Listing history 15 events
-
2026-06-12remarks 430-char remark
-
2026-06-12pricestatusdays on market $59,900 Pending 17 DOM
-
2026-06-09days on market $39,500 Active 14 DOM
-
2026-06-08days on market $39,500 Active 13 DOM
-
2026-06-08days on market $39,500 Active 12 DOM
-
2026-06-07days on market $39,500 Active 11 DOM
-
2026-06-04price $39,500 Active 8 DOM
-
2026-06-03days on market $45,000 Active 8 DOM
-
2026-06-02days on market $45,000 Active 7 DOM
-
2026-06-01days on market $45,000 Active 6 DOM
-
2026-05-31days on market $45,000 Active 5 DOM
-
2026-05-26$45,000 Active
-
2012-08-01soldstatus $9,850
-
2007-08-30soldstatus $16,000
-
2005-03-02soldstatus $8,000
ⓘ Source: listings_history table (triggers on properties + properties_extension) + one-shot
backfill from property_details.listing_events for pre-trigger history.
Tax reassessment forecast TN · Resets to sale price
- Current annual tax
- $308 · $26/mo
- Projected year-2 tax
- $425 · $35/mo
- Expected delta
- +$117/yr (+$10/mo · 38.1%)
ⓘ Screening estimate from a state-policy table — verify with the county assessor before closing.
Climate risk First Street
- Flood 1/10 Low FEMA zone X (unshaded) · 0% chance over 30 yrs
- Wildfire 5/10 Major
- Heat 4/10 Moderate 7 d/yr ≥99°F today · 20 d/yr by 30 yrs out
- Wind 3/10 Moderate 6% chance of damaging wind over 30 yrs
- Air quality 2/10 Low 1 unhealthy d/yr today · 2 by 30 yrs out
Nearby sold comps map
Loading sold comps map…
Walkable amenities ~0.75 mi
Loading nearby amenities…
Taxation est. · year 1
- Rental income
- $11,865
- − Mortgage interest
- −$3,355
- − Property taxes
- −$308
- − Insurance
- −$300
- − Repairs & maintenance
- −$949
- − Management
- −$949
- − Depreciation
- −$1,743
- Taxable income
- $4,262
- Est. tax owed @ 24.0%
- −$1,023
- After-tax cash flow
- $3,974/yr
For passive investors: Depreciation is non-cash, so a rental often shows a tax loss while cash-flowing — sheltering income. Rental losses are passive: they offset passive income freely, and up to $25,000/yr can offset ordinary (W-2) income if you actively participate and your MAGI is under $100k (phasing out to $0 by $150k); unused losses carry forward. On sale, claimed depreciation is recaptured at up to 25%, and gains may owe capital-gains tax (a 1031 exchange can defer both). Figures are a year-1 estimate at your 24.0% rate — not tax advice; consult a CPA.
Schools (NCES district)
- District
- Morgan County
- NCES district ID
- 4703090
- Math proficiency
- 14% ▼ -3.00%
- Reading proficiency
- 18% ▼ -2.00%
- Median HH income
- $37,668
- Composite
- 13.41/100
- National rank
- #9528
- State rank
- #128 of 139 in TN
Livability — Sunbright
- Score
- 48/100
- State rank
- #419
- US rank
- #26176
Category grades
Schools grade is shown separately in the Schools card above.
Census & demographics
- Population (ZIP)
- 2,313
Population outlook (Morgan County) Hauer SSP2
- Today (2025)
- 20,667 people
- By 2030
- 20,166 · -2.4%
- By 2040
- 18,913 · -8.5%
- By 2050
- 17,524 · -15.2%
- By 2075
- 14,582 · -29.4%
- By 2100
- 11,694 · -43.4%
Race, ethnicity, and origin ACS 2023
- Neighborhood character
- Predominantly White (96%)
- Race & ethnicity
- White 96% Two or more races 2% Hispanic / Latino 2%
- Common ancestry
- Polish 9% Slovak 5% Serbian 3%
- Foreign-born
- 0%
- Languages at home
- 73% English-only · German/W. Germanic 26% Spanish 1%
Political lean MEDSL · Morgan
- 2024 margin
- Solid R (+74.5) · D 12.3% · R 86.8%
- 2008→2024 swing
- -34.2pp toward R · 2008: -40.3pp · 2024: -74.5pp
- All cycles
- 2024: R+74.5 2020: R+70.0 2016: R+65.7 2012: R+45.3 2008: R+40.3
Not yet ingested
- Civics
- —
Market trends
- HPI YoY
- ▲ 5.19%
- Current HPI
- 325.4111
- Rent YoY
- —
- Metro
- —
- State GDP YoY
- ▲ 2.78%
- F500 in state
- 22
Industry mix (Fortune 500 HQ in TN)
| Industry | F500 HQs | Revenue |
|---|---|---|
| Healthcare | 3 | $91B |
|
||
| Retail | 3 | $72B |
|
||
| Transportation / Logistics | 1 | $88B |
|
||
| Paper / Packaging | 1 | $19B |
|
||
| Insurance | 1 | $13B |
|
||
| Energy | 1 | $12B |
|
||
Price history
+462.5% since first listed4 events — show timeline
- 2026-05-26 Listed $45,000 REALTRACS as Distributed by MLS Grid
- 2012-08-01 Sold (Public Records) $9,850 Public Records
- 2007-08-30 Sold (Public Records) $16,000 Public Records
- 2005-03-02 Sold (Public Records) $8,000 Public Records
Property tax history
+7.2%/yrLatest (2025): $308 · +0.0% YoY. Source: county tax records.
Cash-flow waterfall
monthlySold comps — $/sqft
last 12 mo · ≤1 miLoading sold comps…