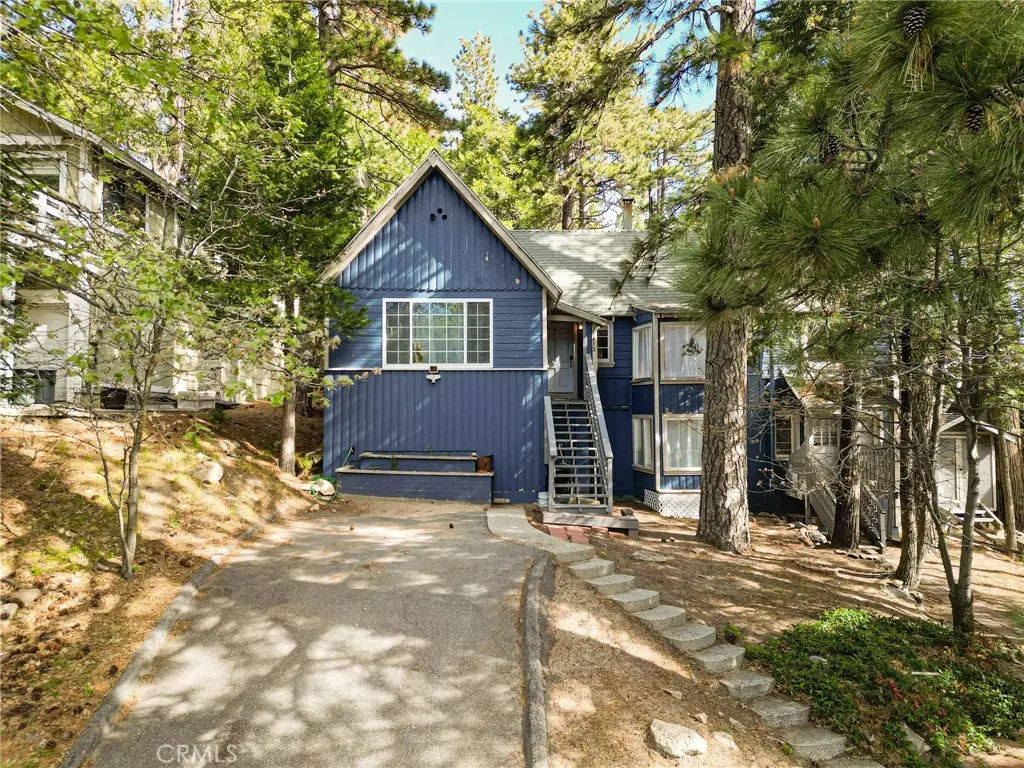
27472 Meadow Dr · Lake Arrowhead, CA
Flood risk 1/10 · Minimal
- FEMA flood zone
- D
- Chance of flooding over 30 yrs
- 0.0%
- Est. flood insurance / yr
- $400 – $4,352
Fire risk 8/10 · Major
- Est. fire insurance / yr
- $659 – $1,223
Heat risk 2/10 · Minimal
- Hot days now (above threshold)
- —
- Hot days in 30 yrs
- —
Wind risk 1/10 · Minimal
- Chance of severe wind over 30 yrs
- —
Air-quality risk 10/10 · Severe
- Unhealthy air days now
- 25 days/yr
- Unhealthy air days in 30 yrs
- 32 days/yr
Risk factors via First Street. Map © Google.
Why this score? — see what drove the D grade
The composite is a weighted blend of 9 inputs, each scored 0–100. Each bar is that input's sub-score; the figure is the points it added to the 100-point composite (weight × sub-score).
- ARV discount +15.0/15.0
- Cash flow +8.9/30.0
- Appreciation +5.0/10.0
- Livability +2.7/5.0
- 1% rule +2.6/10.0
- DSCR +2.5/10.0
- Rent growth +2.5/5.0
- Condition / age +2.5/5.0
- Schools +2.1/10.0
$485,000
🖨 Deal sheet (PDF) 📄 Offer letter ✓ Due diligence
Listing remarks
Charming mountain retreat nestled among the trees in desirable Crest Park! This spacious 3-bedroom, 2-bath home offers over 2,300 sq ft of living space, featuring cozy fireplaces, warm wood accents, and peaceful forest views throughout. Enjoy a private setting with room to relax or entertain, just minutes from Lake Arrowhead Village, dining, and shops. Perfect as a full-time home, weekend retreat, or investment opportunity experience the best of mountain living!
Key facts
- Mountain retreat
- Cozy fireplaces
- Wood accents
Tags
Property features AI
Exterior
- Parking: One covered garage space; One total parking space
- Utilities: Public sewer
- Home design: Cabin-style structure; Two stories; Entry on first level; Mountainous community
- Construction: Shingle roof; No ADU; No common walls; Year built from assessor data
- Exterior features: Patio; Front yard; Back yard; No fencing
Interior
- Kitchen: Kitchen (appliances not specified)
- Bedrooms: One bedroom on the main level
- Bathrooms: Two full bathrooms
- Heating & cooling: Central heating (furnace); Central cooling
- Interior features: Two levels; Front entry; Has a view
- Laundry & utility: In-unit laundry located on the upper level
Neighborhood map
What this means for you Summary
Snapshot
- This is a 3-bed/2.0-bath single-family listed at $485k.
Deal economics
- At list price, monthly cash flow is $-390 ($-5k/yr) — negative.
- To cash-flow at today's rent, offer at most $416k (14.2% below list).
- To meet the 1% rule (rent ≥ 1% of price), the offer needs to be $371k (23.5% below list).
- Recommended offer: $371k (23.5% below list) — sets the bar for 1% rule.
- Cap rate 5.3% vs local median 2.8% in Lake Arrowhead — top-decile yield for the area; either an underpriced asset or a hidden risk that comps aren't pricing in. Stress-test before assuming the spread holds.
Location & tenants
- Location reads 53/100 on livability (#965 in CA) — a working-class tenant base; expect higher turnover. Strengths: housing A-, commute B+, employment B; Watch: health & safety C-, crime D+, amenities F.
- Rim Of The World Unified (town): math 13% / reading 34% proficiency, ranked #415 of 517 in CA (top 80%) — low school quality limits family demand, transient renter base, plan for 1-2y turnover.
- Zoned schools: Lake Arrowhead Elementary (421 students, 54% FRL); Mary P. Henck Intermediate (math 13% / reading 36%, grade F, #277 of 498 statewide, top 73%, 585 students, 61% FRL); Rim of The World Senior High (math 12% / reading 32%, grade F, #950 of 1,170 statewide, top 82%, 917 students, 52% FRL).
- Market conditions: 6 active listings in the ZIP; 7 comparable units currently listed for rent nearby; rentals lingering (median 46d on market — plan ~5-8 weeks vacancy on turnover, expect pricing pressure); 57% of comp listings sitting > 30 days — soft ceiling on asking rent; 5,458 units permitted in San Bernardino County in 2024 (1,500 in 5+ unit buildings).
Forward outlook
- In year one you build about $18k of equity ($3k loan paydown + $15k appreciation (3.0% local appreciation)).
- San Bernardino County population projected at +15% by 2050 — modest demand growth; plan on rents tracking national, not racing it.
- By year 3, paydown + projected appreciation supports a ~$45k cash-out refi (75% LTV) — recoverable capital for the next deal without selling this one.
Negotiation context
- It's been on market 61 days — a 6% lower offer ($456k) is reasonable based on typical stale-listing flexibility.
- 2 sale attempts with the ask held roughly flat each time — persistent listings suggest the price (not the market) is what's stuck; bring a comps-based counter.
Risks & watch-outs
- Watch-outs: built in 1949 — expect roof / HVAC / electrical / plumbing capex.
- Climate carrying-cost: severe wildfire risk — expect insurance premiums to compound above CPI over the hold.
Questions for the listing agent
- What do current leases actually rent for vs. the listed asking? Can we see a recent rent roll and the last 12 months of T-12 income?
- It's been on market 61 days. Have you received any prior offers? Is the seller open to a 24% concession, seller financing, or rate buy-down credit?
- Built in 1949 — when were the roof, HVAC, electrical panel, plumbing, and water heater last replaced?
- Why hasn't it sold? Are there any deal-killer items the seller is aware of (foundation, flood, title, zoning, code violations)?
- Is there a deadline driving the sale (1031 exchange, divorce, estate, relocation)? That informs how much negotiation room exists.
- Schools are D-rated, which usually means shorter tenancies and higher turnover. Who's the typical renter profile here, and what's been the actual vacancy rate?
- Crime grade is D in this area — have there been break-ins, vandalism, or insurance claims at this property in the last 3 years? What carrier currently insures it and at what premium?
- The area grade is low — what's the realistic commute time and amenity access for the typical tenant pool here? Any planned neighborhood developments (good or bad) we should know about?
- What's the average days-on-market for RENTAL listings here right now (not sales)? A rising rental-DOM trend means longer vacancies and softer asking-rent achievability than the comps imply.
- What's the recent tenant-quality profile in this submarket — average credit score on applications, eviction rate, late-payment / NSF rate, and stable-employment percentage? A property-management company in the area should have these aggregated.
- How much new for-sale + rental construction is in the pipeline within 1–3 miles? Heavy new supply typically softens prices + rents 12–24 months out; constrained supply supports both.
Investment metrics
- 1% rule
- 0.76% ✗
- Cap rate
- 5.33%
- Cash-on-cash
- -3.45%
- DSCR
- 0.85
- GRM
- 10.9
CMA / ARV
- ARV (median comp)
- $680,784
- List price
- $485,000
- Delta
- -28.76%
- Verdict
- UNDERPRICED
- Comps
- 20 within 1.0 mi
Show comp detail 2 sales within ~0.75 mi
| Address | Dist | Beds/Ba | Sqft | Sold | Price | $/sf | Match |
|---|---|---|---|---|---|---|---|
| 717 Crest Ests | 0.66mi | 3/3.0 | 2,056 (-11%) | 1mo | $602,999 | $293 | 46 |
| 523 Dogwood Canyon Rd | 0.57mi | 2/2.5 (-1) | 2,079 (-10%) | 6mo | $825,000 | $397 | 44 |
Match score weights: distance 35% · size 25% · config 20% · recency 20%. Top-matched comps best support the ARV.
Projected returns pro-forma
3.0% appreciation · 3.0% rent growth · sell at horizon
- IRR
- 4.3%
- Equity multiple
- 1.25×
- Total profit
- $33,627
- Equity at exit
- $218,077
- IRR
- 7.5%
- Equity multiple
- 2.14×
- Total profit
- $154,641
- Equity at exit
- $336,083
Cash invested: $135,800 (down + closing). Projections, not guarantees.
Landlord ↔ Tenant lean methodology
- Overall (STATE)
- 18 Strongly Tenant-Friendly
- State California
- 18 Strongly Tenant-Friendly · D+13
- County
- — inherits STATE
- City
- — inherits STATE
ZIP-level market 92326
- Active inventory
- 6
- Price-to-rent
- 10.9×
Monthly cashflow live
- Estimated rent
- $3,710 high interval (Pro) →
- Mortgage (P&I)
- −$2,543
- Tax from tax record
- −$575 /mo · $6,903/yr
- Insurance
- −$202
- HOA
- −$0
- Vacancy / Maint / Mgmt
- −$779
- Net cashflow
- $-390
Break-even live
Sensitivity live
| Price | -10% $-115 | -5% $-253 | +0% $-390 | +5% $-527 | +10% $-664 |
|---|---|---|---|---|---|
| Rent | -10% $-683 | -5% $-536 | +0% $-390 | +5% $-243 | +10% $-97 |
| Rate | -1.0pp $-146 | -0.5pp $-267 | base $-390 | +0.5pp $-516 | +1.0pp $-643 |
UW: 25.0% down · 7.5% · 30yr · 1.5% tax · 5.0% vac · 8.0% maint · 8.0% mgmt
Financing live
Cash to close
- Down payment
- $121,250
- Closing costs
- $14,550
- Reserves months
- —
- Total cash needed
- —
Loan-product check · same deal, 3 products live
Conventional
25% down · 7.5% · 30yr
- Down + closing
- —
- Monthly P&I
- —
- Monthly cashflow
- —
- DSCR
- —
- Eligible?
- —
Personal DTI + credit; lowest rate.
DSCR
20% down · 8.5% · 30yr
- Down + closing
- —
- Monthly P&I
- —
- Monthly cashflow
- —
- DSCR
- —
- Eligible?
- —
No personal income docs; deal must DSCR.
Hard money
10% down · 12.0% · 12mo
- Down + closing
- —
- Monthly P&I
- —
- Monthly cashflow
- —
- DSCR
- —
- Eligible?
- —
Short-term bridge; refi at stabilization.
Rent comps 7 comps
| Address | Beds | Baths | Sqft | Rent | $/sqft | DOM | Units | Dist |
|---|---|---|---|---|---|---|---|---|
| 400 Cottage Grove Rd Lake Arrowhead, CA | 4.0 | 4.0 | 2500 | $5,700 | $2.28 | 45d | 1 | 0.88mi |
| 641 Virginia Ct Lake Arrowhead, CA | 3.0 | 2.5 | 2016 | $2,300 | $1.14 | 45d | 1 | 1.05mi |
| 29591 Sugar Cone Ln Twin Peaks, CA | 3.0 | 3.0 | 1680 | $2,200 | $1.31 | 45d | 1 | 1.09mi |
| 233 Corona Cir Lake Arrowhead, CA | 3.0 | 2.0 | 2040 | $2,900 | $1.42 | 45d | 1 | 1.12mi |
| 27313 Pinewood Dr Lake Arrowhead, CA | 4.0 | 2.5 | 2746 | $4,500 | $1.64 | 26d | 1 | 1.20mi |
| 353 Mittry Ln Lake Arrowhead, CA | 3.0 | 3.0 | 2771 | $4,500 | $1.62 | 1d | 1 | 1.25mi |
| 359 Kuffel Canyon Rd Lake Arrowhead, CA | 3.0 | 2.0 | 1723 | $2,999 | $1.74 | 26d | 1 | 1.47mi |
Listing history 22 events
-
2026-06-21days on market $485,000 Active 61 DOM
-
2026-06-18days on market $485,000 Active 58 DOM
-
2026-06-17days on market $485,000 Active 57 DOM
-
2026-06-16days on market $485,000 Active 56 DOM
-
2026-06-15days on market $485,000 Active 55 DOM
-
2026-06-13days on market $485,000 Active 53 DOM
-
2026-06-13days on market $485,000 Active 52 DOM
-
2026-06-09days on market $485,000 Active 49 DOM
-
2026-06-08days on market $485,000 Active 48 DOM
-
2026-06-07days on market $485,000 Active 47 DOM
-
2026-06-04days on market $485,000 Active 44 DOM
-
2026-06-03days on market $485,000 Active 43 DOM
-
2026-06-02days on market $485,000 Active 42 DOM
-
2026-06-01days on market $485,000 Active 41 DOM
-
2026-05-31days on market $485,000 Active 40 DOM
-
2026-04-21$485,000 Active 466-char remark
-
2026-02-02price
-
2025-09-22Active
-
2023-01-11soldstatus $492,000
-
2020-09-16soldstatus $315,000
-
2018-09-28soldstatus $193,000
-
1980-12-18soldstatus $24,700
ⓘ Source: listings_history table (triggers on properties + properties_extension) + one-shot
backfill from property_details.listing_events for pre-trigger history.
Tax reassessment forecast CA · Resets to sale price
- Current annual tax
- $6,903 · $575/mo
- Projected year-2 tax
- $6,903 · $575/mo
- Expected delta
- $0/yr ($0/mo · 0.0%)
ⓘ Screening estimate from a state-policy table — verify with the county assessor before closing.
Climate risk First Street
- Flood 1/10 Low FEMA zone D · 0% chance over 30 yrs
- Wildfire 8/10 Severe
- Heat 2/10 Low
- Wind 1/10 Low
- Air quality 10/10 Extreme 25 unhealthy d/yr today · 32 by 30 yrs out
Nearby sold comps map
Loading sold comps map…
Walkable amenities ~0.75 mi
Loading nearby amenities…
Taxation est. · year 1
- Rental income
- $44,519
- − Mortgage interest
- −$27,168
- − Property taxes
- −$6,903
- − Insurance
- −$2,425
- − Repairs & maintenance
- −$3,561
- − Management
- −$3,561
- − Depreciation
- −$14,109
- Taxable loss
- −$13,209
- Est. tax savings @ 24.0%
- +$3,170
- After-tax cash flow
- $-1,509/yr
For passive investors: Depreciation is non-cash, so a rental often shows a tax loss while cash-flowing — sheltering income. Rental losses are passive: they offset passive income freely, and up to $25,000/yr can offset ordinary (W-2) income if you actively participate and your MAGI is under $100k (phasing out to $0 by $150k); unused losses carry forward. On sale, claimed depreciation is recaptured at up to 25%, and gains may owe capital-gains tax (a 1031 exchange can defer both). Figures are a year-1 estimate at your 24.0% rate — not tax advice; consult a CPA.
Schools (NCES district)
- District
- Rim Of The World Unified
- NCES district ID
- 0632610
- Math proficiency
- 13% ▼ -10.00%
- Reading proficiency
- 34% ▼ -7.00%
- Median HH income
- $55,860
- Composite
- 21.29/100
- National rank
- #8389
- State rank
- #415 of 517 in CA
Livability — Lake Arrowhead
- Score
- 53/100
- State rank
- #965
- US rank
- #24524
Category grades
Schools grade is shown separately in the Schools card above.
Census & demographics
- Census place
- Lake Arrowhead, CA
Population outlook (San Bernardino County) Hauer SSP2
- Today (2025)
- 2,300,329 people
- By 2030
- 2,378,907 · +3.4%
- By 2040
- 2,523,137 · +9.7%
- By 2050
- 2,642,388 · +14.9%
- By 2075
- 2,880,769 · +25.2%
- By 2100
- 2,909,436 · +26.5%
Not yet ingested
- Political lean
- —
- Race & ethnicity
- —
- Common origin
- —
- Civics
- —
Market trends
- HPI YoY
- —
- Current HPI
- —
- Rent YoY
- —
- Metro
- —
- State GDP YoY
- ▲ 3.21%
- F500 in state
- 116
Industry mix (Fortune 500 HQ in CA)
| Industry | F500 HQs | Revenue |
|---|---|---|
| Technology | 27 | $1,492B |
|
||
| Financial Services | 3 | $174B |
|
||
| Retail | 3 | $44B |
|
||
| Insurance | 3 | $26B |
|
||
| Media / Entertainment | 2 | $115B |
|
||
| Pharmaceuticals / Biotech | 2 | $62B |
|
||
Price history
+1863.6% since first listed7 events — show timeline
- 2026-04-21 Listed $485,000 CRMLS
- 2026-02-02 Price Changed — TheMLS
- 2025-09-22 Listed — TheMLS
- 2023-01-11 Sold (Public Records) $492,000 Public Records
- 2020-09-16 Sold (Public Records) $315,000 Public Records
- 2018-09-28 Sold (Public Records) $193,000 Public Records
- 1980-12-18 Sold (Public Records) $24,700 Public Records
Property tax history
+7.7%/yrLatest (2025): $6,903 · -1.4% YoY. Source: county tax records.
Cash-flow waterfall
monthlySold comps — $/sqft
last 12 mo · ≤1 miLoading sold comps…